Abstract
A sample of 4,920 disease-related deaths from New York City for 1979 (8.7 percent of all relevant data from New York City's files) showed a 60 percent rise in death rate beginning at 2 a.m. and reaching a peak at 8 a.m. A smaller peak was also noted at 6 p.m. The rise in human mortality beginning at 2 a.m. and peaking at 8 a.m. might be explained by: (1) artifact of deaths occurring anytime during the night that are discovered after daybreak, (2) effect of less efficient health care between 2 a.m. and 8 a.m., and (3) disease processes that somehow increase risk of death between 2 a.m. and 8 a.m. An attempt was made to differentiate among these possibilities by comparing time of death for various subsamples. The bimodal pattern appeared only in the temporal distribution of deaths of persons over 65 years of age; deaths of persons under 65 did not show significant temporal concentration. There were also prominent differences in the distribution of deaths for different reported causes of death. Ischemic heart disease, which numerically accounted for over 50 percent of the sample, showed peak mortality at 8 a.m. for both males and females. Hypertensive disease showed a significant peak in mortality at 1 a.m. for females only. Cerebrovascular disease peaked significantly at 6 a.m. with a significant peak only for males. The age and disease specificity of the 2 a.m. to 8 a.m. rise in death is consistent with a disease-related explanation for the bimodal circadian pattern in mortality. The quality and efficiency of health care could be improved with more precise information on peak periods of risk for specific morbid conditions.
Human mortality rises rapidly from a low at 12 a.m. to 2 a.m. to a peak at 6 a.m. to 8 a.m., according to reported times of death from death certificates [1–3]. The early morning rise in reported death might be explained in three ways: discovery artifact: the rise in reported deaths in the early morning is related to a statistical tendency for all deaths that occur during the usual hours in bed to be discovered when people awaken in the morning; uneven health care: the rise in deaths is related to differential quality and quantity in health care services stemming from lower numbers of nursing staff and physicians available in the morning hours; circadian rhythms, sleep, and disease processes: the phenomenon is related to disease processes interacting with circadian physiology, sleep physiology, and concomitant hypnotic medications to produce increased likelihood of catastrophic events occurring between 2 a.m. and 8 a.m. [4–9].
If there is truly a sharp rise in mortality between 2 a.m. and 8 a.m., our health care system needs to be redirected to confront the problem. To explore these issues, we examined a modern, urban sample of population mortality statistics. We herein report data that (1) corroborate earlier findings of an increased mortality between 2 a.m. and 8 a.m. and (2) broaden available information by showing that specific temporal patterns in mortality are characteristic of particular recorded causes of death.
METHODS
Sampling
This report is based on a sample of death certificates for disease-related deaths (i.e., deaths not involving trauma) that occurred in New York City during the year 1979. We gathered data in two subsamples taken from death certificates held by New York City's Bureau of Vital Statistics. The first subsample, obtained to establish our data gathering and analysis procedures, consisted of selecting one date at random from each of the 12 months and recording age, sex, reported cause of death, and reported time of death. The first subsample was restricted to the following ICD-9-CM codes: infectious and parasitic diseases (001−139); alcohol and drug dependency (303−304); hypertensive disease (401−405); ischemic heart disease (410−414); other heart disease (420−429); cerebrovascular disease (430−438); atherosclerosis (440); influenza and pneumonia (480−487); and bronchitis, emphysema, and asthma (490−493). The second subsample was from the 15th and the 16th of each month. These dates were chosen because they did not duplicate dates selected in the first subsample. In the second subsample, we included the previous ICD-9-CM codes as well as deaths attributed to neoplasm (141−239).
We obtained a sample total of 4,920 certificates (8.7 percent) from the population of 56,596 deaths in New York City for 1979 that were attributed to the causes we selected [10]. It was not possible to study all disease-related deaths, because of the expense involved. Reported time of death was not computerized and had to be retrieved by hand from each death certificate. The format of the death certificate did not contain information that would permit us to segregate cases by single versus multiple diagnoses or by whether or not autopsy was performed.
Data Analysis
Graphic displays of the data were generated by plotting the number of deaths for each two-hour interval as a percent of the mean number of deaths per two-hour interval. The actual peak time of each distribution was estimated by extracting the maximum of a five-hour average that was moved hour by hour through the 24 hours of the day. Statistical analyses of our data were based on the methods of Batschelet [11] for dealing with circular measurements such as clock time and direction of motion. Thus, we converted each reported time of death into its 24-hour clock form. For example, 11:15 a.m. became 11:15 and 2:30 p.m. became 14:30. Clock times from midnight to midnight could then be represented as points on a unit circle and each of the death times could be considered as a vector with unit length that had a direction between 0 degrees and 359 degrees. The length of the mean vector, r (the r concentration statistic), of all unit vectors was computed for the overall sample and for subgroups according to age, sex, and reported causes of death. If deaths are distributed nonrandomly in time, the r concentration statistic is large and exceeds a significance criterion computed through the Rayleigh test [11].
RESULTS
Of the 4,920 death certificates sampled, 4,619 had both death times and causes of death reported. There were 2,350 males (mean age: 70.73; standard deviation: 13.9) and 2,269 females (mean age: 74.75; standard deviation: 13.2). Table I summarizes numerical details of our results.
TABLE 1.
Numerical Summary of Results
| Sample Size | Population Size | Percent | Peak (24-hour clock time) | r | p | |
|---|---|---|---|---|---|---|
| Infectious and parasitic disease | ||||||
| Total | 33 | 594 | 5.56 | 01:00 | 0.13 | 0.700 |
| Males | 20 | 01:00 | 0.27 | 0.250 | ||
| Females | 13 | 07:00 | 0.22 | 0.550 | ||
| Malignant neoplasms | ||||||
| Total | 1,066 | 16,120 | 6.61 | 08:00 | 0.05 | 0.100 |
| Males | 558 | 07:00 | 0.05 | 0.900 | ||
| Females | 508 | 08:00 | 0.06 | 0.900 | ||
| Alcohol and drug dependency | ||||||
| Total | 45 | 781 | 5.76 | 10:00 | 0.15 | 0.630 |
| Males | 30 | 09:30 | 0.31 | 0.050 | ||
| Females | 15 | 21:30 | 0.19 | 0.580 | ||
| Hypertensive disease | ||||||
| Total | 81 | 1,143 | 7.09 | 01:00 | 0.15 | 0.100 |
| Males | 29 | 10:00 | 0.17 | 0.440 | ||
| Females | 52 | 01:00 | 0.29 | 0.015 | ||
| Ischemic heart disease | ||||||
| Total | 2,463 | 27,508 | 8.95 | 08:00 | 0.06 | 0.001 |
| Males | 1,251 | 08:00 | 0.07 | 0.010 | ||
| Females | 1,212 | 08:00 | 0.06 | 0.010 | ||
| Other heart disease | ||||||
| Total | 213 | 2,635 | 8.08 | 05:00 | 0.03 | 0.900 |
| Males | 105 | 05:00 | 0.04 | 0.900 | ||
| Females | 108 | 05:30 | 0.03 | 0.900 | ||
| Cerebrovascular diseases | ||||||
| Total | 358 | 3,841 | 9.32 | 06:00 | 0.03 | 0.900 |
| Males | 145 | 06:00 | 0.14 | 0.050 | ||
| Females | 213 | 20:00 | 0.05 | 0.900 | ||
| Atherosclerosis | ||||||
| Total | 51 | 800 | 6.38 | 12:30 | 0.20 | 0.130 |
| Males | 26 | 12:00 | 0.32 | 0.100 | ||
| Females | 25 | 17:30 | 0.10 | 0.780 | ||
| Influenza and pneumonia | ||||||
| Total | 249 | 2,551 | 9.76 | 18:00 | 0.11 | 0.100 |
| Males | 147 | 17:00 | 0.09 | 0.250 | ||
| Females | 102 | 10:30 | 0.15 | 0.140 | ||
| Bronchitis, emphysema, and asthma | ||||||
| Total | 60 | 623 | 9.63 | 10:00 | 0.19 | 0.070 |
| Males | 39 | 10:00 | 0.24 | 0.130 | ||
| Females | 21 | 10:00 | 0.14 | 0.670 | ||
| All causes | ||||||
| Total | 4,619 | 56,596 | 8.16 | 08:00 | 0.05 | 0.001 |
| Males < 65 | 675 | 13:00 | 0.01 | 0.900 | ||
| Males > 65 | 1,675 | 08:00 | 0.08 | 0.001 | ||
| Females < 65 | 451 | 10:00 | 0.04 | 0.900 | ||
| Females > 65 | 1,818 | 08:00 | 0.05 | 0.001 |
Sample size, population size, percent, and peak time of each distribution (estimated by extracting the maximum of a five-hour moving average) are shown in columns 2 to 5. The r concentration statistic and the probability of an r that large if the underlying distribution is random [11] are shown in the last two columns.
The temporal distribution of deaths for the entire sample is presented in Figure 1. Reported mortality during the 8 a.m. to 10 a.m. (08:00 to 10:00) interval was 60 percent greater than during the 2 a.m. to 4 a.m. (02:00 to 04:00) interval. The overall effect of time of day was highly significant (p <0.001) and was confirmed in the separate replications for males (p <0.001) and females (p <0.01). Note also the smaller, late afternoon peak during the 6 p.m. to 8 p.m. (18:00 to 20:00) interval.
Figure 1.
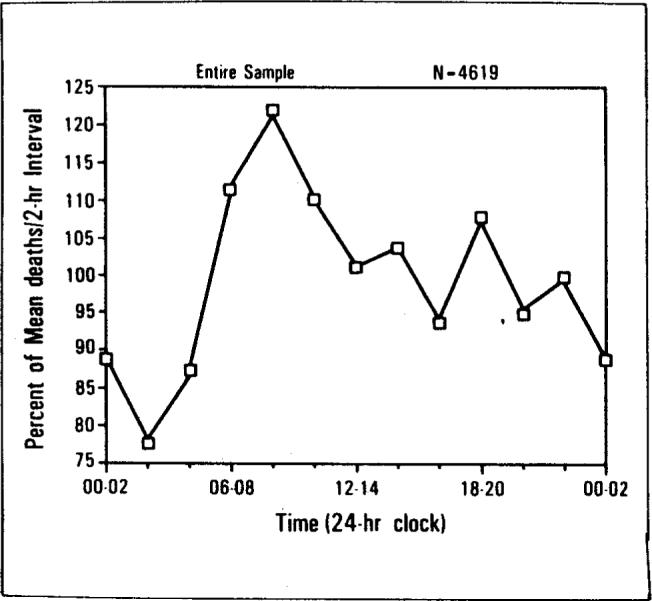
Death rate versus time of day. The temporal distribution of death for 4,619 disease-related deaths. The horizontal axis is successive two-hour intervals throughout the day. The vertical axis is the percent of mean death rate per two-hour interval.
The significant peaks in Figure 1 and Table I were due largely to temporal concentrations in deaths of the 1,675 males and 1,818 females over 65 years of age. The temporal concentrations in the deaths of the 675 males and the 451 females under age 65 were smaller and not significant. Tests of equality of the r concentration statistics were performed according to the methods of Batschelet [11]. Results indicated that the temporal distribution of deaths for males over age 65 was more concentrated than for males under age 65 (F = 1.08, df = 674/1,674, p <0.01). Similarly, the temporal distribution of deaths for females over age 65 was more concentrated than for females under age 65 (F = 1.02, df = 450/1,817, p <0.01). The age contrasts are summarized in Figures 2 and 3.
Figure 2.
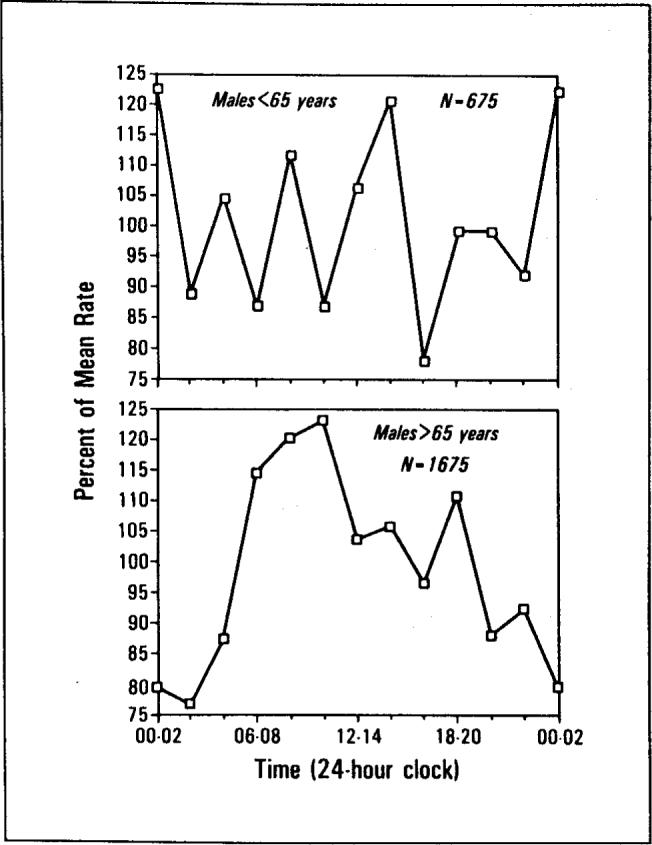
Death rate versus time of day. The temporal distribution of male deaths for persons under the age of 65 (top) and over the age of 65 (bottom).
Figure 3.
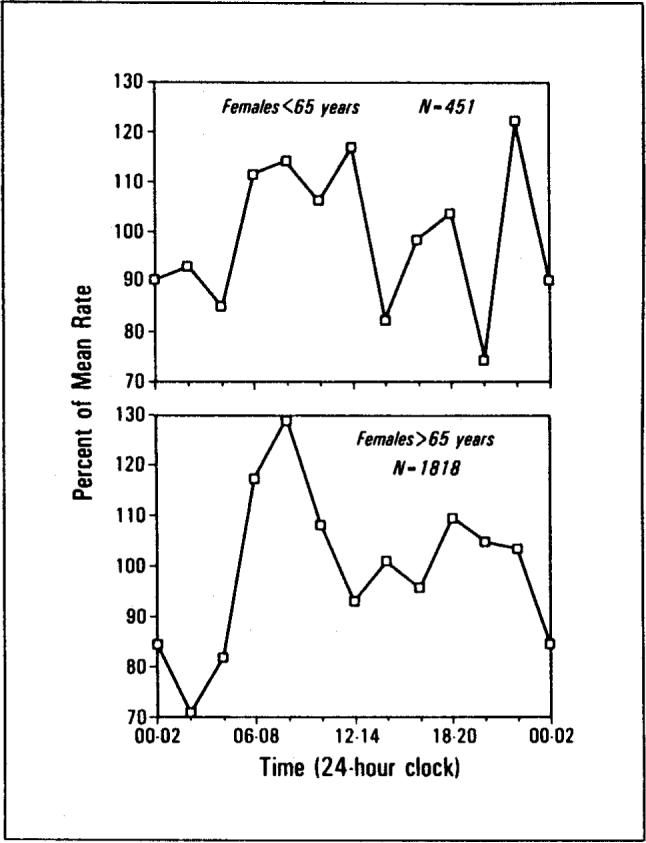
Death rate versus time of day. The temporal distribution of female deaths for persons under the age of 65 (top) and over the age of 65 (bottom).
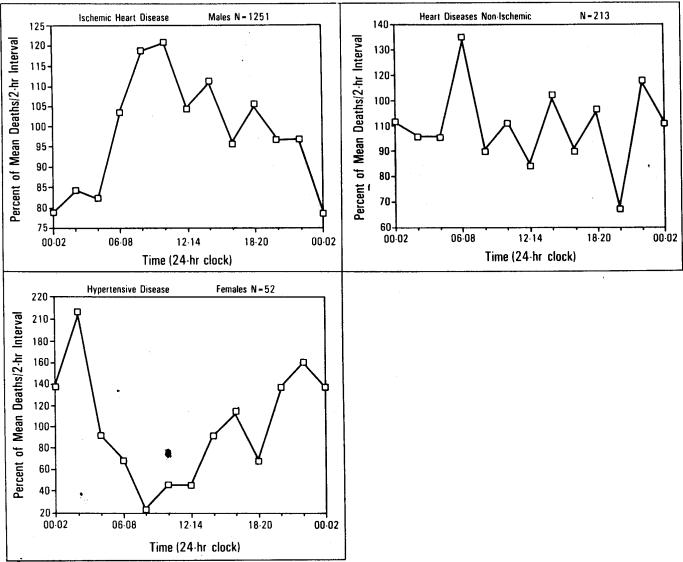
Data grouped by reported causes of death and sex (Table I) revealed four nonrandom, disease-specific distributions (all p's <0.05): ischemic heart disease in males, and females, which peaked at 8 a.m.; hypertensive disease in females, which peaked at 1 a.m.; and cerebrovascular disease in males, which peaked at 6 a.m.
There was no significant correlation between the number of certificates in each disease by sex category and the significance of the r concentration statistic (product-moment r = −0.18; n = 20; p = NS). Thus, in our sample, there was no significant relationship between the number of certificates in a disease category and the significance level for the corresponding r concentration statistic. Therefore, the significant time concentrations in deaths in various disease categories cannot be attributed to variations in sample size.
The r concentration statistic for ischemic heart disease was significantly greater than for all other heart disease (F = 1.04, df = 2,462/212, p = 0.01). Furthermore, the r concentration statistic for ischemic heart disease was significant for both males and females and satisfied the very conservative Bonferroni criteria for reducing false-positive results in repeated statistical testing [12].
The findings of significant r concentrations for females with hypertensive disease but not for males, and males with cerebrovascular disease but not for females, are noteworthy. However, these particular findings must be viewed with reserve. Between sexes for hypertensive disease, the test for differences in the r concentration statistic did not reach significance (F = 1.18, df = 51/28, p = NS). Similarly, the test between males and females in the cerebrovascular disease category did not reach significant (F = 1.11, df = 144/212, p = NS).
Thus, the overall rise in deaths between 2 a.m. and 8 a.m. was largely due to deaths from ischemic heart disease, which was the reported cause of death of over 50 percent of the sample. For total deaths, the trough at 2 a.m. occurred just six hours before the peak at 8 a.m.
Results for certain causes of death are illustrated in Figure 4, top to bottom. Data have been segregated by sex when analyses (see Table I) indicated statistically different temporal distributions for males and females. Figure 4, top, presents the temporal distributions of male deaths attributed to ischemic heart disease, and Figure 4, middle, female deaths attributed to hypertensive disease. Both distributions have statistically significant temporal concentrations (p <0.05); however, the two distributions are significantly different (p <0.05), due to the peak times differing by seven hours. Figure 4, bottom, presents death times for deaths of males and females combined that were attributed to heart disease of types other than ischemic (e.g., valve or other structural abnormality) and shows a much flatter distribution and consequently little temporal concentration (p >0.25).
Figure 4.
Death rate versus time of day. Left,the temporal distribution of male deaths attributed to ischemic heart disease peaked at 8 a.m. Temporal concentration was statistically significant (p <0.01). Bottom, the temporal distribution of female deaths attributed to hypertensive disease peaked at 1 a.m. Temporal concentration was statistically significant (p <0.01). Right, the temporal distribution of deaths attributed to heart disease of types other than ischemic (e.g., valve or other structural abnormality) showed little temporal concentration (p >0.25) and, consequently, a much flatter distribution.
COMMENTS
Overview
Human mortality studies showing a large peak in the early morning and a smaller peak in the late afternoon are not new. The present findings are consistent with other data dating to the late 1800s [1–3]. However, data from earlier in the century [1] show a much more prominent afternoon peak than recent reports [2,3]. Our results show that the morning peak is relatively specific to ischemic heart disease and to subjects over 65.
Limitations of the Study
We recognize that there are limitations inherent in data reported on death certificates. The catastrophic event leading to death and/or the actual death itself may have preceded the pronouncement of death by minutes, hours, or longer because of procedural and medical factors. The time involved in discovering an apparent death, summoning a physician, attempting resuscitation, and procedures associated with pronouncing a person dead may vary widely. Not enough is known about how well reported times of death correspond to the catastrophic events leading to death or indeed, to the actual times of death. A related uncertainty is the unknown fraction of certificates issued after resuscitation left the patient alive but in a precarious condition (e.g., requiring life support) for indeterminate periods of time. In these cases, a death could follow the causal catastrophic event by many hours or even days. Such delays may be particularly significant in cases of unexpected death when it is most likely that attempts to resuscitate will be made. Also, the accuracy of reported causes of death may vary with respect to whether autopsy was performed, what diseases were present prior to death, etc. We believe that the most likely effects of these limitations would be to (1) flatten any observed peaks and troughs in the temporal distributions of deaths, (2) reduce any observed differences between reported causes of death, and (3) somewhat delay the reported times of death after the actual catastrophic events.
The temporal distribution of human mortality does not appear to be random. Moreover, to the extent that the r concentration statistic reflects the temporal concentration of deaths, our data indicate that the timing of some disease-related human mortality is not random with respect to disease and age. We found statistically significant temporal concentrations of death in ischemic heart disease and in persons over the age of 65. It is possible, but unlikely, that the small numbers in our sample caused us to miss equivalent temporal concentrations of death in other disease categories and in persons under the age of 65. First, we found no significant relationship between sample size and significance of temporal concentration in our sample. Second, tests within each sex category showed inequality of the concentration parameters between the younger and older subsamples.
Possible Explanations. Discovery artifact
From the present data and available literature, it is not likely that the rise in reported deaths from 2 a.m. to 8 a.m. is an artifact of discovery. If disease-related deaths occurred at random throughout the night and day, and the sharp rise of deaths between 2 a.m. and 8 a.m. were just a ‘wave’ of undiscovered deaths recognized in the morning by family members or institutional personnel, then we would expect similar peaks and troughs in the temporal distributions for all major subsets of the sample. Table I and Figures 2 and 3 indicate that temporal distributions were not similar for persons above and below the age of 65. The 8 a.m. peak in death rate was only characteristic of the subset over 65. Furthermore, the sharp rise in reported deaths between 2 a.m. and 8 a.m. was only found in certain ICD-9-CM categories, especially ischemic heart disease.
Uneven health care
Can the 2 a.m. to 8 a.m. rise in mortality be explained by reduced availability of health care during these hours? A review of the literature on the timing of clinically significant cardiopulmonary events provides strong circumstantial evidence against this explanation [13–16]. Shepard and colleagues [13] have shown a nighttime increase in ventricular ectopy associated with oxygen desaturation in patients with chronic obstructive pulmonary disease. There have been several studies on the timing of electrocardiographic abnormalities in patients with ischemic heart disease [14,15]. These reports describe temporal distributions with a large, morning peak in ischemic events that occurs between 4 a.m. and 6 a.m. and a smaller afternoon peak between 6 p.m. and 8 p.m. Figure 5 summarizes the data of Araki et al [14] plotted in the same format we have used throughout this report. The shape of this distribution is very similar to our Figure 4, top, which summarizes the temporal distribution of mortality attributed to ischemic heart disease. The early morning peak (4 a.m. to 6 a.m.) in S-T segment elevations occurred about two to four hours before the early morning peak in recorded death time (8 a.m. to 10 a.m.) There was also an afternoon peak in S-T segment elevation that occurred at the same time (6 p.m. to 8 p.m.) as the afternoon peak recorded death times shown in Figures 1 to 3.
Figure 5.
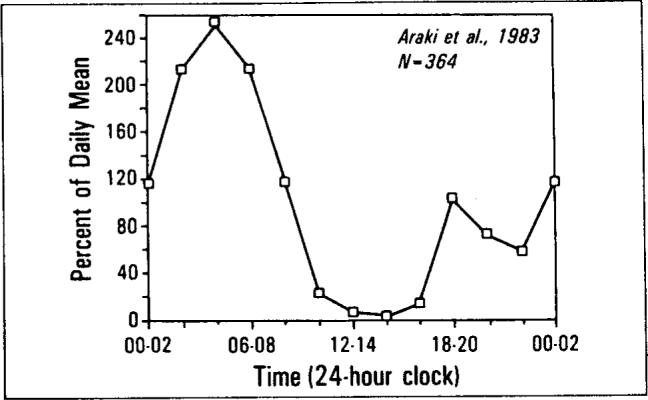
The temporal distributions of S-T segment elevations in 24-hour Holter monitor recordings of Araki et al [14]. Data have been plotted on the same axes as Figure 1. Note the similarities with Figures 1, 2 bottom, 3 bottom, and 4, top left.
The temporal distribution in the incidence of myocardial infarction described by Muller and colleagues [16] is remarkably consistent with the timing of the 2,463 deaths due to ischemic heart disease in our study. Data of Muller et al are normalized and replotted in Figure 6. The correlation between the two-hour intervals between the frequency of myocardial infarctions [16] and frequency of deaths attributed to ischemic heart disease was significant (product-moment r = 0.56; n = 12; p <0.05). When we organized both distributions into three-hour intervals, the correlation between the timing of myocardial infarctions and deaths due to ischemic heart disease was larger (product-moment r = 0.72; n = 8; p <0.025). The enzyme studies described by Muller et al tend to eliminate the possibility of discovery artifact in their data.
Figure 6.
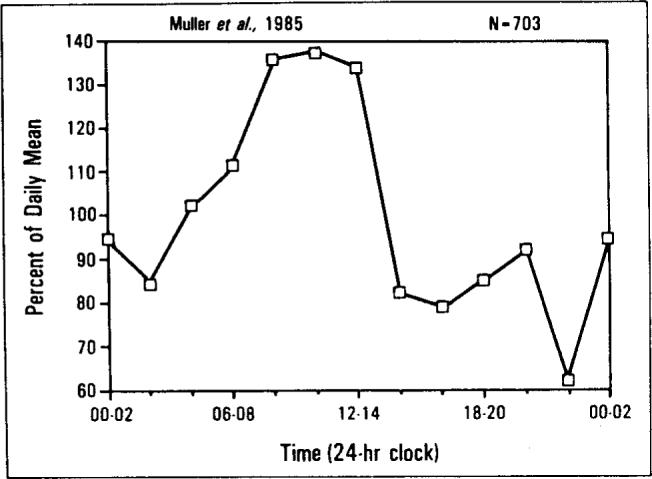
The temporal distributions of myocardial infarctions (MB creatine kinase method) as reported by Muller et al [16]. Data have been plotted on the same axes as Figure 1. Note the similarities with Figure 4, top left.
There have also been several studies indicating that stroke is most frequent during the usual hours of sleep [17,18]. It has been shown that cardiovascular responses to noise are more pronounced in sleep than they are in wakefulness and that they habituate more slowly with increasing age [19]. Another important contributory factor may be the relationship that has been documented between sleep apnea and hypertension [20]. Furthermore, there are two independent reports of clear associations between snoring and hemodynamic disturbances such as hypertension and angina pectoris [21,22].
The Holter monitoring data of Araki et al [14] and the myocardial infarction data of Muller et al [16] do not seem to be distorted by either an artifact of discovery or by access to health care.
Circadian rhythms, sleep, and disease processes
It is possible that interactions among circadian rhythms, sleep, and disease play an important role in the temporal distribution of human mortality.
Respiratory pauses (sleep apneas) and other cardiopulmonary irregularities are thought to be one source of catastrophic events during sleep [4,5,9]. Deaths from cardiac arrhythmias secondary to sleep apnea might commonly be ascribed to ischemic heart disease on death certificates. Because apnea is so common among persons over 65, this explanation is consistent with the age patterns in the data. Moreover, studies of cardiovascular responses to noise during sleep have demonstrated that autonomic instability increases during sleep—particularly in the elderly [19]. During rapid-eye-movement (REM) sleep, marked fluctuations in heart rate and blood pressure may trigger crises in certain patients [8]. Some think, for example, that cardiac arrhythmia during REM sleep could explain sudden nighttime death in Southeast Asians [9].
Another factor may be use of sleeping pills. Persons who take sleeping pills “often” have 50 percent higher mortality, and this excess mortality occurs mainly at night [6,7]. Preliminary evidence suggests that inpatient use of sleeping pills leads to increased falls at night and injuries such as broken hip [23].
Thus, the data are consistent with the hypothesis that circadian rhythms, sleep, and disease processes interact somehow to increase mortality. The three most significant peaks for deaths grouped by disease and sex occurred during the following two-hour intervals: ischemic heart disease (8 a.m. to 10 a.m.), hypertension (2 a.m. to 4 a.m.), and cerebrovascular disease (6 a.m. to 8 a.m.). The rises to these peaks began two to four hours prior to the peak. These findings point to events that occur during the principal sleep period of the day, which is 11 p.m. to 7 a.m. Patients in these categories may be particularly prone to morbid events during this interval of time [4–8]. It cannot be determined what factors associated with this interval are involved. Logic dictates that the most important factors for further experimentation are: (1) body position (i.e., upright versus horizontal), (2) circadian rhythm, and (3) changes in autonomic regulation of cardiopulmonary activity associated with changes in physiologic state (i.e., changes from wakefulness to non-REM sleep to REM sleep).
Systematic studies to evaluate the separate influences of body position, circadian rhythm, and physiologic state on human mortality or morbidity have not been performed. Several studies, however, have emphasized the influences of body position and/or inactivity on ventricular arrhythmias and other cardiac dysfunctions [24,25]. Moreover, some data suggest the states of sleep are somehow involved. The data of Kripke et al [6,7] and of Wingard and Berkman [26] indicate that departure from a normal sleep duration of seven to eight hours is also associated with increased risk of mortality. These authors have interpreted their findings in a manner consistent with present data by suggesting that cardiopulmonary pathology during sleep can present either as a complaint of too much sleep or too little sleep.
The literature on sleep tendency measured objectively by electroencephalographic techniques suggests a further reason to think that the temporal relationship of mortality to sleep is not accidental. The number of minutes a person requires to reach electroencephalographically confirmed sleep is defined as “sleep latency” and is inversely related to physiologic tendency to sleep [27,28]. Physiologic sleep tendency throughout the day is measured by offering opportunities to fall asleep at two-hour intervals throughout the usual waking hours of the day. Studies of the temporal distribution of sleep tendency throughout the day indicate that the distribution of sleep tendency is bimodal with peaks between 4 a.m. and 6 a.m. and between 1 p.m. and 3 p.m. [29,30]. The temporal distributions of mortality from Smolensky et al [3] and of sleep tendency from Carskadon et al [30] have been redrawn in Figure 7, top and bottom on the same axes as our data (Figure 1). The product-moment correlation between the two-hour intervals in human mortality and sleep tendency is 0.45 (n = 12; p <0.08). The peaks and troughs of the two curves appear somewhat out-of-phase, which may account for the relatively low correlation. Nevertheless, the similarity in the shapes of the curves is noteworthy.
Figure 7.
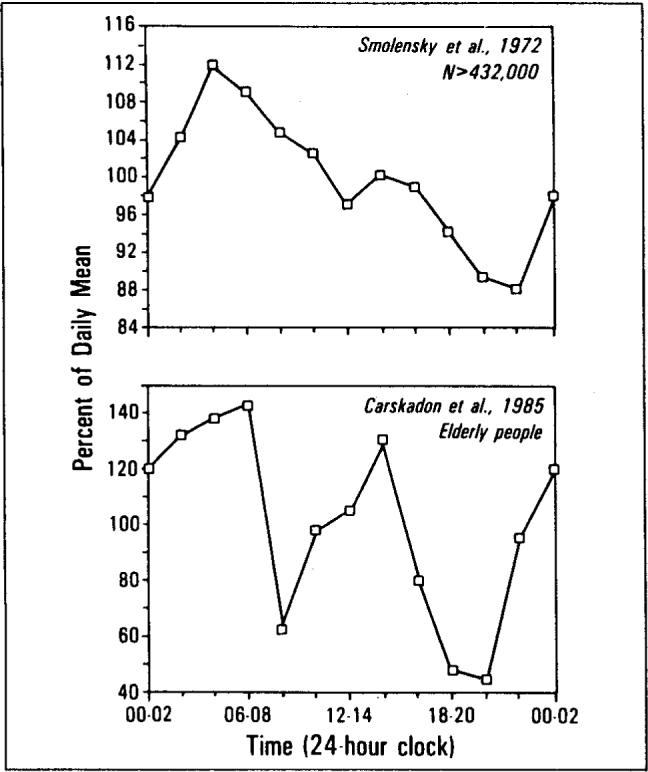
The temporal distributions of mortality data from Smolensky et al [3] (top) and of sleep tendency from Carskadon et al [29] (bottom) have been redrawn on the same axes as Figure 1.
There is also similarity in the bimodal shape of the distributions for our data (Figure 1) and those of Smolensky et al [3] (Figure 7, top). The early morning and afternoon peaks in sleep tendency precede the peaks in mortality found herein and by von Jenny [1] in 1933 by one to two hours. The most likely explanation for this two-hour difference is that times on New York City death certificates are the times when death is officially pronounced—after examination and any resuscitation attempts have been completed.
CONCLUSIONS
The temporal distributions of human mortality are characterized by a large peak in the early morning and a smaller peak in the late afternoon. Statistical tests disclosed that this distribution is not random. The bimodal pattern appeared only in the temporal distribution of deaths of persons over 65 years of age; deaths of persons under 65 did not show significant temporal concentration. There were also prominent differences in the temporal distribution of deaths for different reported causes of death. Ischemic heart disease, which numerically accounted for over 50 percent of the sample, showed peak mortality at 8 a.m. for both males and females. Hypertensive disease showed a significant peak in mortality at 1 a.m. for females only. Cerebrovascular disease peaked significantly at 6 a.m. with a significant peak only for males.
Our data, considered in combination with studies of the temporal distributions of electrocardiographic abnormalities, myocardial infarction, stroke, and respiratory abnormalities, suggest a relationship between the timing of medical catastrophes and events that occur during the usual hours of sleep. The influences of body position, circadian rhythm, and physiologic states of sleep may all be involved.
From a viewpoint of health economics, this deserves evaluation. It is reasonable to postulate that the major peak, which in our studies constituted a 60 percent rise in death rate, is a reflection of a comparable rise in the rate of catastrophic events such as myocardial infarction. Furthermore, it is conceivable that such events more frequently leave the patient temporarily or permanently disabled, without causing death but prolonging hospitalization and/or disability. Specific knowledge about the risk factors and their interaction with sleep processes could be useful in controlling losses in life as well as in reducing morbidity and health care expenses. In particular, special methods may be needed to preserve life for patients at risk during certain periods of the day.
ACKNOWLEDGMENT
We wish to thank Dr. Reinaldo A. Ferrer, Commissioner of Health for New York City, for his cooperation, and Mrs. E. A. Mitler for her assistance in the compilation of data.
Dr. Mitler is supported in part by Grant NS-20459 from the National Institute of Neurological and Communicative Disorders and Stroke, and Grant 80−102 from the John D. and Catherine T. MacArthur Foundation. Dr. Kripke is supported in part by Research Scientist Development Award Grant MH00117 from the National Institute of Mental Health.
REFERENCES
- 1.von Jenny E. Tagesperiodisch Einflüsse auf Geburt und Tod. Schweiz Med Wochenschr. 1933;14:15–17. [Google Scholar]
- 2.Reinberg A, Gervais P, Halberg F, et al. Mortalité des adultes: rhythmes circadiens et circannuels dans un hôpital parisien et en France. Nouv Presse Med. 1973;2:289–294. [PubMed] [Google Scholar]
- 3.Smolensky M, Halberg F, Sargent F. Chronobiology of the life sequence. In: Ito S, Ogata K, Yoshimura H, editors. Advances in climatic physiology. Igaku Shoin; Tokyo: 1972. pp. 281–318. [Google Scholar]
- 4.Tilkian AG, Guilleminault C, Schroeder JS, Lehrman KL, Simmons FB, Dement WC. Sleep-induced apnea syndrome, prevalence of cardiac arrhythmias and their reversal after tracheostomy. Am J Med. 1977;63:348–358. doi: 10.1016/0002-9343(77)90272-8. [DOI] [PubMed] [Google Scholar]
- 5.Guilleminault C, Briskin JG, Greenfield MS, Silvestri R. The impact of autonomic nervous system dysfunction on breathing during sleep. Sleep. 1984;4:263–278. doi: 10.1093/sleep/4.3.263. [DOI] [PubMed] [Google Scholar]
- 6.Kripke DF, Simons RN, Garfinkel L, Hammond EC. Short and long sleep and sleeping pills: is increased mortality associated? Arch Gen Psychiatry. 1979;36:103–116. doi: 10.1001/archpsyc.1979.01780010109014. [DOI] [PubMed] [Google Scholar]
- 7.Kripke D, Garfinkel L. Excess nocturnal deaths related to sleeping pill and tranquilizer use (letter). Lancet. 1984;I:99. doi: 10.1016/s0140-6736(84)90022-9. [DOI] [PubMed] [Google Scholar]
- 8.Guilleminault C, Pool P, Motta J, Gillis AM. Sinus arrest during REM sleep in young adults. N Engl J Med. 1984;311:1006–1010. doi: 10.1056/NEJM198410183111602. [DOI] [PubMed] [Google Scholar]
- 9.Baron RC, Thacker SB, Gorelkin L, Vernon AA, Taylor WR, Choi K. Sudden death among Southeast Asian refugees. An unexplained nocturnal phenomenon. JAMA. 1983;250:2947–2951. [PubMed] [Google Scholar]
- 10.Summary of Vital Statistics 1979 . The City of New York. Department of Health; The City of New York: 1980. [Google Scholar]
- 11.Batschelet E. Circular statistics in biology. Academic Press; London: 1981. [Google Scholar]
- 12.Miller RG., Jr . Simultaneous statistical inference. Springer-Verlag; New York: 1981. [Google Scholar]
- 13.Shepard JW, Garrison MW, Grither DA, Evans R, Schweitzer PK. Relationship of ventricular ectopy to nocturnal oxygen desaturation in patients with chronic obstructive pulmonary disease. JAMA. 1985;78:28–34. doi: 10.1016/0002-9343(85)90457-7. [DOI] [PubMed] [Google Scholar]
- 14.Araki H, Koiwaya Y, Nakagaki O, Nakamura M. Diurnal distribution of ST-segment elevation and related arrhtyhmias in patients with variant angina: a study by ambulatory ECG monitoring. Circulation. 1983;67:995–1000. doi: 10.1161/01.cir.67.5.995. [DOI] [PubMed] [Google Scholar]
- 15.Chierchia S, Davies G, Berkenboom G, Crea F, Cran P, Maseri A. Alpha-adrenergic receptors and coronary spasm: an elusive link. Circulation. 1984;69:8–14. doi: 10.1161/01.cir.69.1.8. [DOI] [PubMed] [Google Scholar]
- 16.Muller JE, Stone PH, Turi ZG, et al. Circadian variation in the frequency of onset of acute myocardial infarction. N Engl J Med. 1985;313:1315–1322. doi: 10.1056/NEJM198511213132103. [DOI] [PubMed] [Google Scholar]
- 17.Olivares L, Castaneda E, Grife A, Alter M. Risk factors in stroke: a clinical study in Mexican patients. Stroke. 1973;4:773–781. doi: 10.1161/01.str.4.5.773. [DOI] [PubMed] [Google Scholar]
- 18.Marshall J. Diurnal variation in occurrence of strokes. Stroke. 1977;8:230–231. doi: 10.1161/01.str.8.2.230. [DOI] [PubMed] [Google Scholar]
- 19.Muzet A, Ehrhart J, Eschenlauer R, Leinhard JP. Habituation and age differences of cardiovascular responses to noise during sleep. In: Koella WP, editor. Sleep 1980. Karger; Basel: 1981. pp. 212–215. [Google Scholar]
- 20.Williams AJ, Houston D, Finberg S, Lam C, Kinney JL, Santiago S. Sleep apnea syndrome and essential hypertension. Am J Cardiol. 1985;55:1019–1022. doi: 10.1016/0002-9149(85)90738-6. [DOI] [PubMed] [Google Scholar]
- 21.Mondini S, Zucconi M, Cirignotta F, et al. Snoring as a risk factor for cardiac and circulatory problems: an epidemiological study. In: Guilleminault C, Lugaresi E, editors. Sleep/wake disorders: natural history, epidemiology, and long-term evolution. Raven Press; New York: 1983. pp. 99–107. [Google Scholar]
- 22.Koskenvuo K, Kaprio J, Partinen M, Langinvainio H, Sarna S, Heikkila K. Snoring as a risk factor for hypertension and angina pectoris. Lancet. 1985;I:893–896. doi: 10.1016/s0140-6736(85)91672-1. [DOI] [PubMed] [Google Scholar]
- 23.Bonnet MH, Kramer ML. Falls and flurazepam. Sleep Res. 1981;10:76. [Google Scholar]
- 24.Gillis AM, Maclean KE, Guilleminault C. The effect of sleep on the QT interval in patients with ventricular arrhythmias. Sleep Res. 1985;14:234. [PubMed] [Google Scholar]
- 25.Motta J, Guilleminault C. Cardiac dysfunction during sleep. Ann Clin Res. 1985;17:190–198. [PubMed] [Google Scholar]
- 26.Wingard DL, Berkman LF. Mortality risk associated with sleeping patterns among adults. Sleep. 1983;6:102–107. doi: 10.1093/sleep/6.2.102. [DOI] [PubMed] [Google Scholar]
- 27.Richardson GS, Carskadon MA, Flagg W, van den Hoed J, Dement WC, Mitler MM. Excessive daytime sleepiness in man: multiple sleep latency measurement in narcoleptic and control subjects. Electroencephalogr Clin Neurophysiol. 1978;45:621–627. doi: 10.1016/0013-4694(78)90162-1. [DOI] [PMC free article] [PubMed] [Google Scholar]
- 28.Mitler MM, Gujaverty KS, Sampson MG, Browman CP. Multiple daytime nap approaches to evaluating the sleep patient. Sleep. 1982;5:s119–s127. doi: 10.1093/sleep/5.s2.s119. [DOI] [PubMed] [Google Scholar]
- 29.Carskadon MA, Harvey K, Dement WC. Acute restriction of nocturnal sleep in children. Percept Mot Skills. 1981;53:103–112. [Google Scholar]
- 30.Carskadon MA, van den Hoed J, Dement WC. Sleep and daytime sleepiness in the elderly. Geriatr Psychiatry. 1980;13:135–151. [PubMed] [Google Scholar]


