Abstract
Phosphopeptides with one and four phosphate groups were characterized by MALDI mass spectrometry. The molecular ion of monophosphopeptide could be detected both as positive and negative ions by MALDI TOF with delayed extraction (DE) and in the reflector mode. The tetraphospho peptide could be detected in linear mode. When MS/MS spectra of the monophospho peptides were obtained in a MALDI TOF TOF instrument by CID, b and y ions with the intact phosphate group were observed, in addition the b and y ions without the phosphate group. Our study indicates that it is possible to detect phosphorylated peptides with out the loss of phosphate group by MALDI TOF as well as MALDI TOF TOF instruments with delayed extraction and in the reflector mode.
Keywords: phosphopeptides, mass spectrometry, positive ion, neutral loss, linear mode, reflector mode
Introduction
Post-translational modification (PTM) of proteins by phosphorylation is extensively observed in biological systems. It is a dynamic process effecting the folding and function of proteins (Tholey et al. 1999a; Moran et al. 2006). This process influences several cellular functions such as metabolic maintenance, cell division and signal transduction (Stock et al. 2000; Mumby and Brekenn, 2005; Morandell et al. 2006). The large number of functions that are influenced by the phosphorylation indicates the diverse role played by phosphorylation. Several amino acids in proteins can be phosphorylated. These include the common and well-known O-phosphates of serine, threonine and tyrosine residues and also unusual amino acids such as hydroxyproline, hydroxylysine (Sickmann and Meyer, 2001). Some lesser-known phosphorylations on amino acids such as histidine, lysine (N-phosphates), cysteine (S-phosphate), aspartic, glutamic acids (acyl-phosphates) were also identified in some proteins (Yan et al. 1998; Mclachilin and Chait, 2001; Reinders and Sickmann, 2005). In particular, phosphorylation of threonine, serine are known to play key roles in the regulation of the activities of the proteins involved in signal transduction in cells and is also important in the virulence mechanism of some pathogenic bacteria (Walburger et al. 2004; Papavinasa sundaram et al. 2005; Peris et al. 2005).
Characterization of these wide varieties of phosphorylations demands the development of a large number of strategies and methodologies. In tune with the requirements, several strategies are being developed (Yan et al. 1998; Kalume et al. 2003; Hjerrild and Gammeltoft, 2006; Moran et al. 2006; Ptacek and Snyder, 2006; Wang et al. 2006).
Mass spectrometry is a powerful tool due its capability to analyze complex mixtures. It is versatile, easy to use, produces spectra with high mass accuracies and great sensitivity. It is being extensively used for the characterization of PTMs. MALDI TOF and ESI mass spectrometry have been used extensively to identify PTMs (Jonscher et al. 1997; Larsen and Roepstorff, 2000; Lee et al. 2001; Salih, 2005; Loyet et al. 2005; Wang et al. 2006; Hardouin et al. 2006; Molle et al. 2006). Some of these studies demonstrated neutral loss of phosphate group, HPO3 or H3PO4 from the peptides detected by a reduction of 80 or 98 Da in the mass, due to metastable decomposition during MALDI TOF experiments in the reflector mode of acquisition of the spectrum (Annan and Carr, 1996; Neubauer and Mann, 1999; Kinumi et al. 2000). It was also shown that phosphoserine and phosphothreonine-containing peptides display significant intensity signals of the ions originating from the neutral loss of phosphoric acid, via gas phase β-elimination of the phosphate group (Neubauer and Mann, 1999). It was observed that all the y and b daughter ions containing these phosphoresidues were associated with this loss of phosphoric acid (Paizs and Suhai, 2005). In this process, the phosphoserine and the phosphothreonine residues are converted to dehydroalanine and dehydroamino-2-butyric acid respectively (Tholey et al. 1999b). Precursor ion scan and neutral ion scan methods can also be used to identify the phosphorylations in proteins and peptides (Wang et al. 2006; Domon and Abersold, 2006).
In source decay (ISD) and post source decay (PSD) have been used for the identification of the phosphorylation sites in peptides (Hoffmann et al. 1999; Kinumi et al. 2000; Chaurand et al. 1999; Lennon and Walsh, 1999; Talbo et al. 2001). However, lack of spectral information in the mass range 100–700 due to the interference of matrix cluster ions in the ISD spectra limits the detection of phosphorylation sites in this mass region. PSD cannot be used routinely, due to poor fragmentation of the peptides.
Phosphopeptide identification from the tryptic digests of proteins was successfully carried out with the help of MALDI peptide mapping before and after phosphatase treatment that results in a mass shift of 80 Da due to the removal of phosphate moiety (Liao et al. 1994; Wang et al. 1993; Larsen et al. 2001; Molle et al. 2006). MALDI ion trap MS was also used for the identification of phosphopeptides from protein digests (Quin and Chait, 1997). MALDI TOFMS has been used extensively for the detection of phosphopeptides. With delayed extraction of ions, it was shown to be a better choice as compared to the continuous extraction of ions (Vestal et al. 1995). Recent developments in the area of mass spectrometry, particularly with the availability of instrument such as MALDI TOF TOF could aid in not only detecting the phosphopeptides, but also mapping the site of phosphorylation.
In the present study, we show that mono phosphorylated peptides can be detected without loss of the phosphate group by MALDI mass spectrometry with delayed extraction, in the reflector mode. A tetra-phosphorylated peptide could be detected without loss of the phosphate groups in the linear mode. We have also observed that it is possible to detect peptide with the phosphate group intact when fragmented by CID in a MALDI TOF TOF instrument.
Materials and Methods
α-cyano-4-hydroxy cinnamic acid (HCCA), monophosphopeptide, FQ[pS]EEQQQTEDELQDK(F16Kp),tetraphosphopeptide,RELEENVPGEIVE[p S]L[pS][pS][pS]EESITR(R25R) of casein digest, enzymatically dephosphorylated casein were purchased from sigma chemical co(St.Louis, MO, USA). Peptides Ac-EGTHSFDG-am (E8G) and its phosphorylated form were synthesized using Fmoc chemistry and purified by reverse phase HPLC.
Trypsin digestion of protein
Casein (1picomole) was digested with trypsin using an enzyme to protein ratio of 1:50 in 25 mM ammonium bicarbonate buffer by incubating at 37 °C for 18 hours. The digest was dried on a speed vac concentrator and redissolved in 50% acetonitrile containing 0.1% trifluoroacetic acid before spotting on the MALDI target plate. The digest was also spiked with phosphopeptide (F16Kp) and spotted on the MALDI plate.
Preparation of Samples for MALDI Analysis
Peptides were dissolved in water (5 picomoles/μl) and 1 μl of the sample was spotted on the MALDI target plate. The sample was allowed to air dry and 1 μl of matrix was spotted (5 mg/ml of 50% ACN containing 0.1% TFA) allowed it to air dry. The MALDI plate was inserted in to the mass spectrometer to acquire the spectra.
MALDI TOF
A voyager DE-STR MALDI TOF mass spectrometer (Perceptive Biosystems, Framingham, MA, USA) was used for acquiring mass spectra in the positive ion reflector mode and linear mode. Negative ion spectra were also acquired. The mass spectrometer was fitted with a nitrogen laser (337 nm) for ionization. The laser-firing rate was 20 Hz. The grid voltage and delayed extraction time were optimized for obtaining good signals. The ion path length in linear and reflector mode is 2 meters and 3 meters respectively.
MALDI TOF TOF
The mass spectra of the phosphopeptides and the casein digest with and with out spiking with the phosphopeptide were also acquired using a 4800 MALDI TOF TOF analyzer obtained from Applied Biosystems (Foster city, CA). The mass spectrometer was fitted with a Nd:YAG laser (355 nm) to ionize samples. The laser-firing rate was 200 Hz. The ion path length of linear, reflector and MS/MS modes are 1.5 meters, 3 meters and 2.4 meters respectively. It consists of a high-energy collision induced (CID) cell and spectra were obtained using air as CID gas with 1 KV and 2 KV energy in the positive ion mode. TOF TOF or tandem mass spectrometry consists of two successive TOF accelerations. In tandem mass spectrometry the first acceleration selects, isolate and fragment (collision with neutral gas) a precursor ion selected for that purpose. The second acceleration accelerates the precursor ion and fragments, and measures masses and intensities of fragment ions. The instrument is also capable of deflecting matrix ions and suppresses metastable ions.
Results and Discussion
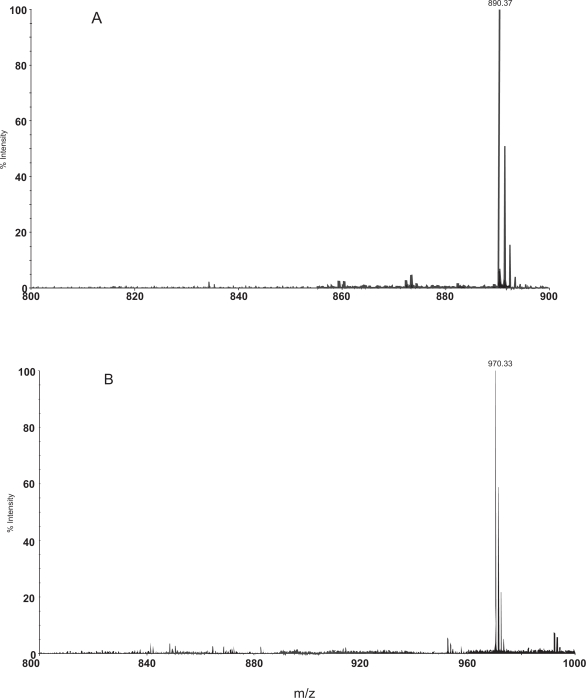
Several lines of evidence indicate that neutral loss of phosphate group occurs in phosphopeptides generated from ingel digest of proteins during the MALDI TOF acquisition of mass spectra in the reflector mode (Zhang et al. 1994; Zhang x et al. 1998). These peptides contain free amino group and carboxyl groups. In order to examine whether capping of the N and C termini modulates dephosphorylation during MALDI analysis, we examined the mass spectrum of E8G and E8Gp. The peptides with serine phosphorylated and non-phosphorylated stretching the region from residues 76 to 83 of the caveolin 1 (cav-1) were synthesized with capping of N and C terminals. Serine phosphorylation in this protein converts Cav-1 to a secretary protein from an integral membrane protein (Schelgel et al. 2001). The peptides exhibited molecular ion at m/z 890.37(Theoretical MH+ 890.36) and 970.33(Theoretical MH+ 970.33) respectively. The positive ion mass spectra of these peptides E8G and E8Gp recorded in the reflector mode of analysis are shown in Figures 1A and 1B. It is clear from Figure 1B that neutral loss of phosphate group was not observed in the reflector mode of spectrum acquisition with DE.
Figure 1.
MALDI-TOF mass spectra of the peptides E8G (panel A) and E8Gp (panel B) recorded in the reflector mode using HCCA as matrix. The isotopic peaks of the peptides are also shown.
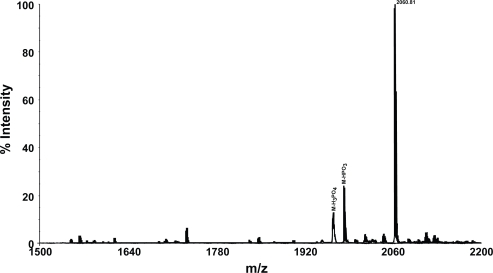
The mass spectrum of the phosphopeptide F16Kp with free amino and carboxyl groups exhibited molecular ion at m/z 2061.81 (Theoretical MH+ 2061.82) (Fig. 2). The molecular ion of this peptide was observed with good intensity and without any neutral loss of phosphate group. Hence it appears that presence or absence of blocking group at the N- or C- terminal has no effect on the neutral loss of phosphate group. Form these studies it is clear that phosphopeptides cannot be distinguished from non-phosphorylated peptides from the peptide mass fingerprints used in the identification of proteins using MALDI TOF analysis with delayed extraction and in the reflector mode.
Figure 2.
The MALDI TOF mass spectrum of the phosphopeptide F16Kp showing the molecular ion. Spectrum was recorded in the reflector mode. The peaks arising from the loss of phosphoric acid and phosphate moiety from the parent ion (M) are also shown.
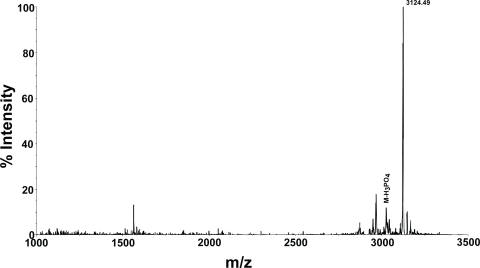
In order to examine whether multiply phosphorylated peptides can be detected, the mass spectrum of a tetraphospho peptide from casein digest was examined. The molecular ion of this peptide could not be obtained in the reflector mode. In the linear mode, the molecular ion could be detected at m/z 3124.49 (Theoretical MH+ 3123.92) using Voyager DE STR mass spectrometer. The MALDI TOF mass spectrum of this peptide is shown in Figure 3. However, molecular ion for the tetra phosphopeptide could not be detected even in the linear mode of analysis with 4800 MALDI TOF TOF (data not shown).
Figure 3.
The MALDI TOF mass spectrum of the tetraphosphopeptide R25R recorded in the linear mode on Voyager DE STR MALDI TOF instrument. The loss of phosphoric acid from the parent ion (M) was indicated in the spectrum. The additional peaks are some impurities present in the sample.
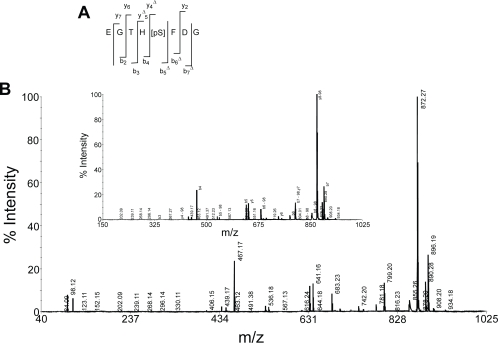
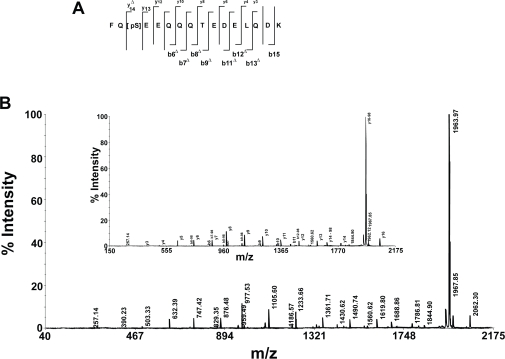
In order to determine the stability of phosphate group during fragmentation, CID mass spectra of the peptidesE8Gp and F16Kp were recorded using 4800 MALDI TOF TOF mass analyzer using HCCA as matrix in the reflector mode. The results are shown in the Figures 4 and 5. The fragmentation of these peptides is shown in the inset of the mass spectra. The fragment ions of the peptides with loss of phosphate groups from y and b ions are shown in Table 1 and 2. Examination of the fragments of the bn ion series indicates that the mass difference between b5 and b4 is 167 Da, corresponding to the b-ion of phosphoserine. Therefore, this establishes that in peptide E8Gp there is no loss of phosphate from phosphoserine. Further, the analysis of the b-type ions indicates the presence b5, b6 and b7 of the phosphoserine containing fragments at m/z 634.13, 781.18 and 896.19 respectively. b ions which correspond to loss of phosphate are also observed. These ions are identified at m/z 536.18, 683.23 and 798.24 that arise from ions b5 -98, b6 -98 and b7 -98 respectively (see inset of Fig. 4). Similarly, the y-type ions after phosphoserine residue y4, y5, y6 and y7 are observed at m/z 504.14, 641.16, 742.20 and 799.20 respectively. The ions corresponding to the loss of phosphate group from these ions i.e. y4-98, y5-98, y7-98 are observed at m/z 406.15, 543.20, and 701.25 respectively. The loss of phosphate group from y6 ion is not observed. Taken together, the fragmentation of b type and y type ions coupled with the fragments arising from the loss of phosphate group the location of the phosphoserine could be localized at residue 5. The b-type ions are more intense as compared to the y-type ions (Table 1, Fig. 4). A similar analysis of F16Kp indicates the location of the phosphoserine at residue 3. Figure 5 shows the MS/MS spectrum of F16Kp and Table 2 shows the characteristic peaks for the identification of the sequence of the peptide. Analysis of yn series of ions of F16Kp reveals that the mass difference between y14 at m/z 1619.80 and y13 at m/z 1786.81 is 167 Da corresponding to the y ion of phosphoserine. Loss of H3PO4 from the molecular ion appeared at m/z 1963.97 and it is the most intense peak in the spectrum. This suggests the presence of a phosphoamino acid in the peptide. Loss of phosphate moiety from y14 ion detected at m/z 1688.86. A series of b ions of the peptide are observed at m/z 829.35, 957.46, 1085.50, 1186.57, 1315.59, 1430.62, 1559.30 and 1673.38 corresponding to b6 to b13 respectively. Loss of phosphate group from these fragments is also found at m/z 731.36, 859.44, 981.51, 1088.58, 1217.62, 1332.64, 1461.72 and 1574.77. The intensity of yn series of ions is more as compared to the bn series of ions (Table 2, Fig. 5). Thus, form these fragments the phosphorylation site in the peptides could be detected.
Figure 4.
The CID mass spectrum of the phosphopeptide E8Gp recorded on 4800 MALDI TOF TOF mass analyzer. Panel A shows the fragmentation pattern of the peptide. Δ indicates the corresponding bn or yn ion minus H3PO4. Panel B shows the MS/MS spectrum of E8Gp. Number next to bn or yn ion indicates loss of H3PO4 .The inset shows expanded region of the spectrum showing b-type and y-type ions.
Figure 5.
The CID mass spectrum of the monophospho peptide F16Kp recorded using 4800 MALDI TOF TOF mass analyzer. Panel A shows the fragmentation pattern of the peptide. Δ indicates the corresponding bn or yn ion minus H3PO4. Panel B shows the MS/MS spectrum of F16Kp. Number next to bn or yn ion indicates loss of H3PO4 .The inset shows some expanded region of the spectrum showing y-type and b-type ions.
Table 1.
Characteristic daughter ions obtained from MS/MS of the phosphopeptide E8Gp.
| Residue* | b | Intensity | b-H3PO4 | Intensity | y | Intensity | Y-H3PO4 | Intensity |
|---|---|---|---|---|---|---|---|---|
| E | - | - | - | - | 928.19 | 157 | - | |
| G | - | - | - | - | 799.20 | 5243 | 701.25 | 569 |
| T | 330.11 | 169 | - | - | 742.20 | 1015 | - | - |
| H | 467.16 | 9200 | - | - | 641.16 | 5076 | 543.20 | 853 |
| [pS] | 634.13 | 4649 | 536.18 | 1053 | 504.14 | 77 | 406.15 | 286 |
| F | 781.18 | 1317 | 683.23 | 3271 | - | - | - | |
| D | 896.19 | 10000 | 798.24 | 1027 | - | - | - | |
| G | - | 855.26 | 2058 | - | - | - |
[pS] indicated the phosphoserine residue.
Table 2.
Characteristic daughter ions obtained from MS/MS of the phosphopeptide F16Kp.
| Residue* | b | Intensity | b-H3PO4 | Intensity | y | Intensity | y-H3PO4 | Intensity |
|---|---|---|---|---|---|---|---|---|
| F | - | - | - | - | - | - | 1963.52 | 76000 |
| Q | - | - | - | - | 1914.70 | 913 | 1817.90 | 982 |
| [pS] | - | - | - | - | 1786.81 | 1825 | 1688.48 | 2407 |
| E | - | - | 474.07 | 197 | 1619.80 | 3272 | - | - |
| E | 701.21 | 240 | 603.07 | 258 | 1490.72 | 3184 | - | - |
| Q | 829.35 | 506 | 731.34 | 358 | 1361.71 | 3930 | - | - |
| Q | 957.46 | 842 | 859.44 | 1443 | 1233.66 | 5914 | - | - |
| Q | 1085.50 | 932 | 987.51 | 1216 | 1105.60 | 6820 | - | - |
| T | 1186.57 | 618 | 1088.58 | 2033 | 977.53 | 8903 | - | - |
| E | 1315.59 | 732 | 1217.62 | 1716 | 876.48 | 3832 | - | - |
| D | 1430.62 | 1490 | 1332.64 | 1394 | 747.42 | 3670 | - | - |
| E | 1559.30 | 763 | 1461.72 | 985 | 632.39 | 3402 | - | - |
| L | 1673.38 | 111 | 1574.77 | 881 | 503.33 | 775 | - | - |
| Q | 1800.00 | 605 | - | - | 390.23 | 324 | - | - |
| D | 1915.39 | 913 | 1817.90 | 982 | - | - | - | - |
| K | - | - | 1945.99 | 3805 | - | - | - | - |
[pS] indicated the phosphoserine residue.
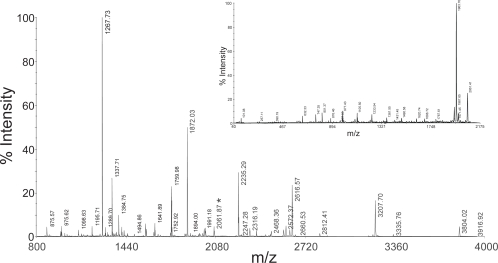
Trypsin digest of Casein with and with out spiking with the phosphopeptide (F16Kp) was also analyzed. Figure 6 shows the PMF of the casein digest spiked with the phosphopeptide. The protein could be identified upon searching with database and the CID mass spectrum of phosphorylated peptide was shown in the inset Figure 6, which was same as the MS/MS of the purified phosphopeptide. This shows that the phosphopeptides could be identified form the peptide mass fingure print of the protein.
Figure 6.
The trypsin digest of the protein casein spiked with the phosphopeptide. The inset shows the CID mass spectrum of the monophosphopeptide. The symbol (*) in the mass spectrum indicates the spiked peptide.
In conclusion, neutral loss of phosphate group was not observed in the mass spectrum of serine phosphorylated monophospho peptides in the reflector mode of analysis using either voyager DE STR MALDI TOF or 4800 MALDI TOF TOF mass spectrometers. The earlier analysis of phosphopeptides using MALDI TOF mass spectrometers contain single stage acceleration regions and have no control over the voltages that define the initial acceleration region and the fragmentation using different mass spectrometers might be different. However, introduction of delayed extraction (DE) in these mass spectrometers greatly helps in controlling the side chain fragmentation, improves mass accuracy and resolution (Juhasz et al. 1997; Vestal et al. 1995). The molecular ion of a tetra phosphate peptide could be detected in linear mode of analysis using Voyager MALDI TOF mass spectrometer. Low laser pulse rate (3 or 20 Hz), higher laser energy (337 nm) might have played a role in detecting the molecular ion of the tetra phosphopeptide in the Voyager DE STR MALDI TOF MS.
The phosphorylation sites could be detected with the help of CID MS spectra recorded with MALDI TOF TOF mass analyzer by direct observation of phosphorylated b and y ions in addition to their dephosphorylated counterparts. Thus, the instrumental design and the experimental conditions play an important role in the analysis of phosphopeptides.
Acknowledgments
We thank Mr. E. Bikshapathy, Ms. T. Lalita Prabha and Ms. Spardh Khera for their help in the synthesis and purification of the Peptides. Research grant to MVJ from Department of Biotechnology (DBT), Government of India, New Delhi is gratefully acknowledged.
References
- Annan RS, Carr SA. Phosphopeptide Analysis by Matrix-Assisted Laser Desorption Time-of-Flight Mass Spectrometry. Anal Chem. 1996;68:3413–21. doi: 10.1021/ac960221g. [DOI] [PubMed] [Google Scholar]
- Chaurand P, Luetzenkirchen F, Spengler B. Peptide and protein identification by matrix-assisted laser desorption ionization (MALDI) and MALDI-post-source decay time-of-flight mass spectrometry. J Am Soc Mass Spectrom. 1999;10:91–103. doi: 10.1016/S1044-0305(98)00145-7. [DOI] [PubMed] [Google Scholar]
- Domon B, Abersold R. Mass spectrometry and protein analysis. Science. 2006;312:212–17. doi: 10.1126/science.1124619. [DOI] [PubMed] [Google Scholar]
- Hardouin J, Hubere-Roux M, Delmas AF, et al. Identification of isoenzymes using matrix-assisted laser desorption/ionization time of flight mass spectrometry. Rapid Commun Mass spectrum. 2006;20:725–32. doi: 10.1002/rcm.2355. [DOI] [PubMed] [Google Scholar]
- Hoffmann R, Metzger S, Spengler B, et al. Sequencing of peptides phosphorylated on serines and threonines by post-source decay in matrix assisted laser desorption/Ionization time —of-flight mass spectrometry. J Mass Spectrom. 1999;34:1195–204. doi: 10.1002/(SICI)1096-9888(199911)34:11<1195::AID-JMS881>3.0.CO;2-C. [DOI] [PubMed] [Google Scholar]
- Hjerrild M, Gammeltoft S. Phosphoproteomics tool box: Computational biology, proteinchemistry and mass spectrometry. FEBS lett. 2006;580:4764–70. doi: 10.1016/j.febslet.2006.07.068. [DOI] [PubMed] [Google Scholar]
- Jonscher KR, Yates JR., III Matrix-assisted laser desorption ionization/quadrupole ion trap mass spectrometry of peptides. Application to the localization of phosphorylation sites on the P protein from Sendai virus. J Biol Chem. 1997;272:1735–41. doi: 10.1074/jbc.272.3.1735. [DOI] [PubMed] [Google Scholar]
- Juhasz P, Vestal ML, Martin SA. On the initial velocity of ions generated by matrix-assisted laser desorption Ionization and its effect on the calibration of delayed extraction time -of -flight mass spectra. J Amer Soc Mass spectrom. 1997;8:209–17. [Google Scholar]
- Kalume DE, Molina H, Pandey A. Tackling the phosphoproteome: tools and strategies. Curr Opin Chem Biol. 2003;7:64–9. doi: 10.1016/s1367-5931(02)00009-1. [DOI] [PubMed] [Google Scholar]
- Kinumi T, Niwa H, Matsumoto H. Phosphopeptide sequencing by in-source decay spectrum in delayed extraction matrix-assisted laser desorption ionization time-of -flight mass spectrometry. Anal Biochem. 2000;277:177–86. doi: 10.1006/abio.1999.4376. [DOI] [PubMed] [Google Scholar]
- Larsen MR, Sørensen GL, Stephen JF, Larsen PM, et al. Phospho-proteomics: Evaluation of the use of enzymatic dephosphorylation and differential mass spectrometric peptide mass mapping for site specific phosphorylation assignment in proteins separated by gel electrophoresis. Proteomics. 2001;1:223–38. doi: 10.1002/1615-9861(200102)1:2<223::AID-PROT223>3.0.CO;2-B. [DOI] [PubMed] [Google Scholar]
- Larsen MR, Roepstorff P. Mass spectrometric identification of proteins and Characterization of their post translational modifications in proteome analysis. Fresenius J Anal Chem. 2000;366:677–90. doi: 10.1007/s002160051562. [DOI] [PubMed] [Google Scholar]
- Lee CH, McComb ME, Bromirski M, et al. On-membrane digestion of beta-casein for determination of phosphrylation sites by matrix-assisted laserdesorption/ionizationquadrupole/time of flight mass spectrometry. Rapid Commun Mass Spectrom. 2001;15:191–202. doi: 10.1002/1097-0231(20010215)15:3<191::AID-RCM209>3.0.CO;2-N. [DOI] [PubMed] [Google Scholar]
- Lennon JJ, Walsh KA. Locating and identifying posttranslational modifications by in-source decay during MALDI-TOF mass spectrometry. Protein Sci. 1999;8:2487–93. doi: 10.1110/ps.8.11.2487. [DOI] [PMC free article] [PubMed] [Google Scholar]
- Liao PC, Leykam J, Andrews PC, et al. An Approach to Locate Phosphorylation Sites in a Phosphoprotein: Mass Mapping by Combining Specific Enzymatic Degradation with Matrix-Assisted Laser Desorption/Ionization Mass Spectrometry. Anal Biochem. 1994;219:9–20. doi: 10.1006/abio.1994.1224. [DOI] [PubMed] [Google Scholar]
- Loyet KM, Stult JT, Arnott D. Mass spectrometric contributions to the practice of phosphorylation site mapping through 2003: a literature review. Moll Cell Proteomics. 2005;4:235–45. doi: 10.1074/mcp.R400011-MCP200. [DOI] [PubMed] [Google Scholar]
- McLachilin DT, Chait BT. Analysis of phosphorylated proteins and peptides by mass spectrometry. Curr Opin Chem Biol. 2001;5:591–602. doi: 10.1016/s1367-5931(00)00250-7. [DOI] [PubMed] [Google Scholar]
- Molle V, Zanella-Cleon I, Robin JP, et al. Characterization of the Phosphorylation sites of Mycobacterium tuberculosis serine/threonine Protein kinases, PknA,PknD,PknE, and PknH by mass spectrometry. Proteomics. 2006;6:3754–66. doi: 10.1002/pmic.200500900. [DOI] [PubMed] [Google Scholar]
- Moran MF, Tong J, Taylor P, et al. Emerging applications for phosphoproteomics in cancer molecular therapeutics. Biochem Biophys Acta. 2006;1776:230–41. doi: 10.1016/j.bbcan.2006.06.002. [DOI] [PubMed] [Google Scholar]
- Morandell S, Stasyk T, Grosstessener-Hain K, et al. Phosphoproteomics strategies for the functional analysis of signal transduction. Proteomics. 2006;6:4047–56. doi: 10.1002/pmic.200600058. [DOI] [PubMed] [Google Scholar]
- Mumby M, Brekenn D. Phosphoproteomics: new insights in to cellular signaling. Genome boil. 2005;6:230. doi: 10.1186/gb-2005-6-9-230. [DOI] [PMC free article] [PubMed] [Google Scholar]
- Neubauer G, Mann M. Mapping of phosphorylation sites of gelisolated proteins by nanoelectrospray tandem mass spectrometry: potentials and limitations. Anal Chem. 1999;71:235–42. doi: 10.1021/ac9804902. [DOI] [PubMed] [Google Scholar]
- Papavinasasundaram KG, Chan B, Chung JHM, et al. Deletion of the Mycobacterium tuberculosis pknH Gene Confers a Higher Bacillary oad during the Chronic Phase of Infection in BALB/c Mice. J Bacteriol. 2005;87:5751–60. doi: 10.1128/JB.187.16.5751-5760.2005. [DOI] [PMC free article] [PubMed] [Google Scholar]
- Peirs P, Lefèvre P, Boarbi S, et al. Mycobacterium tuberculosis with Disruption in Genes Encoding the Binding Proteins PstS1 and PstS2 Is Deficient in Phosphate Uptake and Demonstrates Reduced In Vivo Virulence. Infect Immun. 2005;73:1898–902. doi: 10.1128/IAI.73.3.1898-1902.2005. [DOI] [PMC free article] [PubMed] [Google Scholar]
- Piazs B, Suhai S. Fragmentation pathways of protonated peptides. Mass Spectrom Rev. 2005;24:508–48. doi: 10.1002/mas.20024. [DOI] [PubMed] [Google Scholar]
- Ptacek J, Synder M. Charging it up: Global analysis of protein phosphorylation. Trends Genet. 2006;22:545–54. doi: 10.1016/j.tig.2006.08.005. [DOI] [PubMed] [Google Scholar]
- Qin J, Chait BT. Identification and Characterization of Post-translational Modifications of Proteins by MALDI Ion Trap Mass Spectrometry. Anal Chem. 1997;69:4002–9. doi: 10.1021/ac970489n. [DOI] [PubMed] [Google Scholar]
- Reinders J, Sickmann A. State of the art in phosphoproteomics. Proteomics. 2005;5:4052–61. doi: 10.1002/pmic.200401289. [DOI] [PubMed] [Google Scholar]
- Salih E. Phosphoproteomics by mass spectrometry and classical protein chemistry approaches. Mass Spectrom rev. 2005;24:828–46. doi: 10.1002/mas.20042. [DOI] [PubMed] [Google Scholar]
- Schlegel A, Arvan P, Lisanti MP. Caveolin-1 binding to endoplasmic reticulam membranes and entry in to regulated secretary pathway are regulated by serine phosphorylation Protein sorting at the level of the endoplasmic reticulam. J Biol Chem. 2001;276:4398–408. doi: 10.1074/jbc.M005448200. [DOI] [PubMed] [Google Scholar]
- Sickmann A, Meyer HE. Phosphoaminoacid analysis. Proteomics. 2001;1:200–06. doi: 10.1002/1615-9861(200102)1:2<200::AID-PROT200>3.0.CO;2-V. [DOI] [PubMed] [Google Scholar]
- Stock AM, Robinson VL, Goudreu PN. Two-component signal transduction. Ann Rev Biochem. 2000;69:183–215. doi: 10.1146/annurev.biochem.69.1.183. [DOI] [PubMed] [Google Scholar]
- Talbo GH, Suckau D, Malkoski M, et al. MALDI-PSD-MS analysis of the phosphorylation sites of caseinomacropeptides. Peptides. 2001;22:1093–8. doi: 10.1016/s0196-9781(01)00426-0. [DOI] [PubMed] [Google Scholar]
- Tholey A, Lindmann A, Kinzal V, et al. Direct effects of phosphorylation on the preferred backbone conformation of peptides: a nuclear magnetic resonance study. Biophys J. 1999a;76:76–87. doi: 10.1016/S0006-3495(99)77179-1. [DOI] [PMC free article] [PubMed] [Google Scholar]
- Tholey A, Reed J, Lehmann WD. Electrospray tandem mass spectrometric studies of phosphopeptides and phosphopeptides analogs. J mass spectrom. 1999b;34:117–23. doi: 10.1002/(SICI)1096-9888(199902)34:2<117::AID-JMS769>3.0.CO;2-V. [DOI] [PubMed] [Google Scholar]
- Vestal ML, Juhasz P, Martin SA. Delayed extraction matrix-assisted laser desorption time -of-flight mass spectrometry. Rapid Commun Mass Spectrom. 1995;9:1044–50. [Google Scholar]
- Walburger A, Koul A, Ferrari G, et al. Protein Kinase G from Pathogenic Mycobacteria Promotes Survival Within Macrophages. Science. 2004;304:1800–04. doi: 10.1126/science.1099384. [DOI] [PubMed] [Google Scholar]
- Wang YK, Liao PC, Allison J, et al. Phorbol 12-myristate 13-acetate-induced phosphorylation of Op18 in Jurkat T cells. Identification of phosphorylation sites by matrix-assisted laser desorption ionization mass spectrometry. J Biol Chem. 1993;268:14269–77. [PubMed] [Google Scholar]
- Wang J, Zhang Y, Jiang H, et al. Phosphopeptide detection using automated on line IMAC-capillary LC-ESI-MS/MS. Proteomics. 2006;6:404–11. doi: 10.1002/pmic.200500223. [DOI] [PubMed] [Google Scholar]
- Yan JX, Packer NH, Gooley AA, Williams KL. Protein phosphorylation: Technologies for the identification of phosphoamino acids. J Chromatogr A. 1998;808:23–41. doi: 10.1016/s0021-9673(98)00115-0. [DOI] [PubMed] [Google Scholar]
- Zhang W, Czernik AJ, Yungwirth T, et al. Matrix-assisted laser desorption mass spectrometric peptide mapping of proteins separated by two-dimensional gel electrophoresis: determination of phosphorylation in synapsin I. Protein Sci. 1994;3:677–86. doi: 10.1002/pro.5560030415. [DOI] [PMC free article] [PubMed] [Google Scholar]
- Zhang X, Herring CJ, Romano PR, et al. Identification of phosphorylation sites in proteins separated by polyacrylamide gel electrophoresis. Anal Chem. 1998;70:2050–9. doi: 10.1021/ac971207m. [DOI] [PubMed] [Google Scholar]


