Abstract
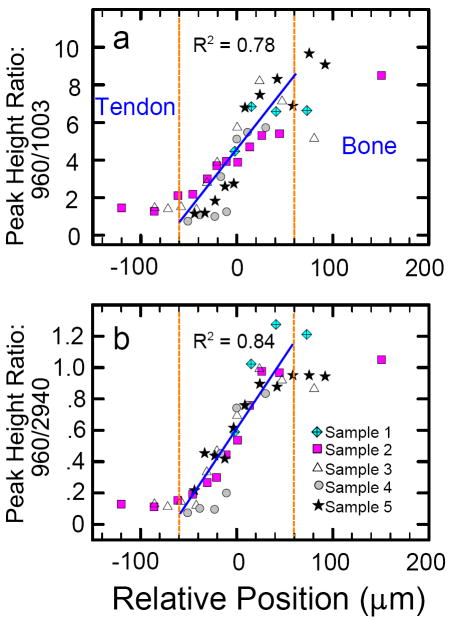
We applied Raman spectroscopy to monitor the distribution of minerals and the degree of mineralization across the tendon–bone insertion site in the shoulders of five rats. We acquired Raman spectra from 100 to 4000 Δcm-1 on individual 1 μm points across the 120 μm wide transition zone of each tissue sample and identified all the peaks detected in pure tendon and in pure bone, as well as in the transition zone. The intensity of the 960 Δcm-1 P–O stretch for apatite (normalized to either the 2940 Δcm-1 C–H stretch or the 1003 Δcm-1 C–C stretch for collagen) was used as an indicator of the abundance of mineral. We relate the observed histological morphology in the tissue thin section with the observed Raman peaks for both the organic component (mostly collagen) and the inorganic component (a carbonated form of the mineral apatite) and discuss spectroscopic issues related to peak deconvolution and quantification of overlapping Raman peaks. We show that the mineral-to-collagen ratio at the insertion site increases linearly (R2 = 0.8 for five samples) over the distance of 120 μm from tendon to bone, rather than abruptly, as previously inferred from histological observations. In addition, narrowing of the 960 Δcm-1 band across the traverse indicates that the crystalline ordering within the apatite increases concomitantly with the degree of mineralization. This finding of mineral gradation has important clinical implications and may explain why the uninjured tendon-to-bone connection of the rotator cuff can sustain very high stress concentrations without failure. Our finding is also consistent with recent mechanical models and calculations developed to better understand the materials properties of this unusually strong interface.
Index Headings: Raman spectroscopy, Rotator cuff, Bone, Tendon, Tendon-to-bone insertion, Apatite, Collagen
INTRODUCTION
This study was undertaken to gain critical information about the inorganic and organic components of the tissue that directly connects a tendon to a bone. The medical concern is that injuries to this part of the tendon are common and can lead to significant pain and loss of function at the affected joint.1,2 Injuries to the rotator-cuff tendons of the shoulder are particularly problematic, as they heal poorly even after surgical repair.3,4 The region including and surrounding the interface between tendon and bone is called the “insertion site” (Fig. 1). Whereas the tendon consists solely of organic components (primarily type I collagen) and is very flexible,5 bone is orders of magnitude stiffer and consists of both the inorganic phosphate mineral apatite and an organic component (also type I collagen).6,7
Fig. 1.
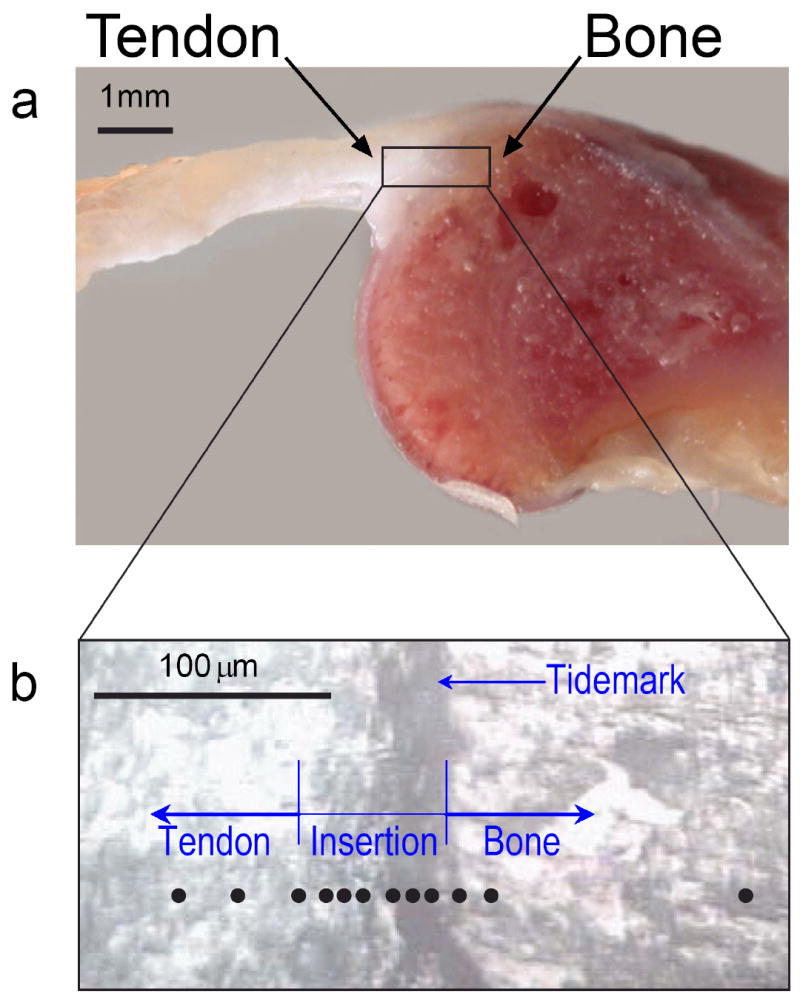
The anatomy of the shoulder of a rat, where the rotator-cuff tendon inserts into the upper arm bone. (a) A cross-section of the supraspinatus tendon-to-bone insertion, as prepared for Raman spectroscopic analysis. (b) A magnified view of the tendon-to-bone insertion site, as seen in reflected light, was used to track the position of the Raman microprobe traverse (black circles) in individual tissue samples. At the insertion, a vertical dark stripe can be seen, which is frequently referred to as the “tidemark”.
As traditionally described, the transitional tissue between tendon and bone exhibits four different zones that can be distinguished optically in stained histological sections: tendon, fibrocartilage, mineralized fibrocartilage, and bone.8,9 Between the uncalcified fibrocartilage and the calcified fibrocartilage, there is a basophilic line known as the “tidemark” that is at the approximate location of the dark stripe seen in an unstained tissue sample (see Fig. 1b). From the chemical perspective, the optically recognizable tidemark traditionally was thought to represent a “calcification” front, i.e., the location where mineralization with apatite abruptly starts. From the mechanical perspective, this tidemark was considered the boundary between soft and hard tissue.8,9 The validity of these interpretations, however, has not previously been tested with a spectroscopic microanalysis technique.
The present study applies Raman spectroscopy to investigate the composition of the uninjured tendon-to-bone transition in an attempt to better understand why the healing of this tissue is so difficult once it is injured. We analyzed the tendon-to-bone transitional tissue in five different rats and discuss in detail one single traverse of individual micrometer-sized points across the tendon-to-bone transition of a single tissue sample. The goal in this pilot study was to investigate whether Raman spectroscopy can be used to document quantitative changes in the degree of mineralization from point to point across the very narrow tendon-to-bone insertion zone. A further goal was to optimize the quantification algorithm that effectively can be applied in future clinically relevant investigations. Since clinical and medical studies need to be performed on a statistically significant number of tissue samples, it is imperative to know up-front whether band area ratios or band intensity ratios are the more reliable measure of mineral-to-matrix content and which of the collagen bands can be used to quantitatively represent the organic content within the excitation volume.
EXPERIMENTAL
Sample Preparation
Tendon-to-bone samples were removed from the shoulders of five skeletally mature (but not aged) Fisher rat cadavers. Specifically, the supraspinatus tendon (one of the rotator-cuff tendons of the shoulder) was isolated, taking care not to disrupt its insertion into the humeral head. The rat shoulder was chosen for this study due to its anatomic similarity to human shoulders.10 The samples were sliced in the coronal plane to ~1 mm thickness using a low-speed saw (Isomet). The tissue samples underwent no chemical treatment except for the use of phosphate-buffered saline solution to keep the sample hydrated. The unstained, unfixed section was placed on a glass slide for Raman analysis.
Instrumentation
Analysis was performed with a fiber-optically coupled Raman microprobe based on an axial spectrograph with volume holographic transmission gratings (HoloLab Series 5000 Raman Microscope, Kaiser Optical Systems, Inc.). The 532 nm excitation was delivered by a frequency-doubled diode-pumped solid-state Nd:YAG laser (Coherent) that was coupled to a Leica microscope (Germany) via an 8 μm, single-mode, optical fiber. An 80× ultra-long-working-distance objective (Olympus, Japan) with a numerical aperture of 0.75 and a working distance of 8 mm was used to focus the light onto the sample with a lateral resolution of ~1 μm and a power of ~ 5 mW at the sample surface. The same objective collected the scattered light in a 180-degree backscattering configuration. The Rayleigh scattered light was suppressed by 532 nm notch filters in the scattered beam path. The Raman scattered light was focused onto the core of a 100 μm, multi-mode collection fiber, which effectively acted as a pinhole. The output of the fiber was guided into the spectrometer through another 532 nm notch filter before it was intercepted by a holographic mirror, which split the beam into two spectral components. These two component beams were simultaneously imaged onto a thermoelectrically cooled charge-coupled device (CCD) array detector (Andor Technology, Ireland) with 2048 channels across. The wavenumber region 100-2500 Δcm-1 was imaged onto the top portion of the CCD, whereas the wavenumber region 2500-4400 Δcm-1 was imaged onto the bottom portion of the CCD. Thus, the spectral range from 100 to 4000 Δcm-1 used in this study was simultaneously detected with a spectral resolution of 2.5 cm-1.
The absolute wavenumber designation and the exact position of the laser line were calibrated with Ne and Ar calibration lamps. The relative wavenumber axis was calibrated with cyclohexane and monitored daily by analysis of a (100) Si wafer whose peak position is 520.6 ± 0.1 Δcm-1. The intensity scale was calibrated using a white-light spectrum of a temperature-calibrated tungsten lamp. All spectra were background-corrected for dark counts by obtaining a new background correction spectrum every 2 hours. Spectra were acquired using Kaiser Optical’s HologramsR software. Spectral acquisition time per analysis spot was 64 × 4 seconds (times two because of automated γ-ray filtering). The automated γ-ray filtering works such that pairs of spectra are collected and compared. If a γ-ray spike was detected in one spectrum of the pair, then this spectrum was eliminated by the software.
A tissue sample was placed on a glass microscope slide that sat on the platform of a computer-controlled x-y-z stage (Pro Scan, Prior Scientific), which allowed easy positioning of the sample spot in the focal plane. Controlled positioning (±0.5 μm) in the x-y plane via joystick facilitated analysis of individual, pre-selected, photo-documented micrometer-sized analysis spots (Fig. 1b) along a traverse across the tendon-to-bone insertion. Data acquisition, intensity, and wavelength calibration, as well as filtering, were controlled by the HologramsR software.
Interpretation of Spectra
The spectrum of bone consists of peaks from two components: (1) the inorganic mineral component, which is a calcium phosphate that is similar—but by no means identical—to hydroxylapatite,11,12 and (2) a macromolecular organic component that is dominated by type I collagen. Since the nanometer-sized mineral crystals are intimately associated with the organic collagen fibers, the spectra of these two components cannot be acquired separately. The size of the apatite crystals (platelets of about ~50 nm × ~50 nm that are only several nanometers thick13) is below the spatial resolution of visible light. Thus, the spatial resolution of the Raman microprobe technique (~1 μm) can only provide a “bulk” analysis of bone, and a spectrum obtained on bone will always include the peaks that are due to both the mineral component and the organic component.
Visible Raman spectroscopy on biological tissues, especially of cellular components, is often problematic due to intrinsic fluorescence.14 However, dense collagenous tissues such as tendon and bone can be examined successfully even with 532 nm excitation.15 In our minimally prepared samples, the Raman peaks for both the mineral and the organic components of bone were superimposed on a broad, featureless, steadily increasing fluorescence background (Fig. 2, top). Baseline correction for each individual spectrum was performed via an operator-chosen 10-to-15-point leveling operation with linear curve fits between neighboring points (see result in Fig. 2, bottom). This careful background correction allowed not only for a better comparison of individual spectra in figures but also permitted more precise quantitative interpretations of the spectra. Peaks were deconvolved with a mixed Gaussian–Lorentzian algorithm after individual spectra were baseline corrected. All spectral processing (i.e., baseline correction, deconvolutions, peak area calculations) was performed with the Grams/32R software (Galactic, Salem, NH).
Fig. 2.
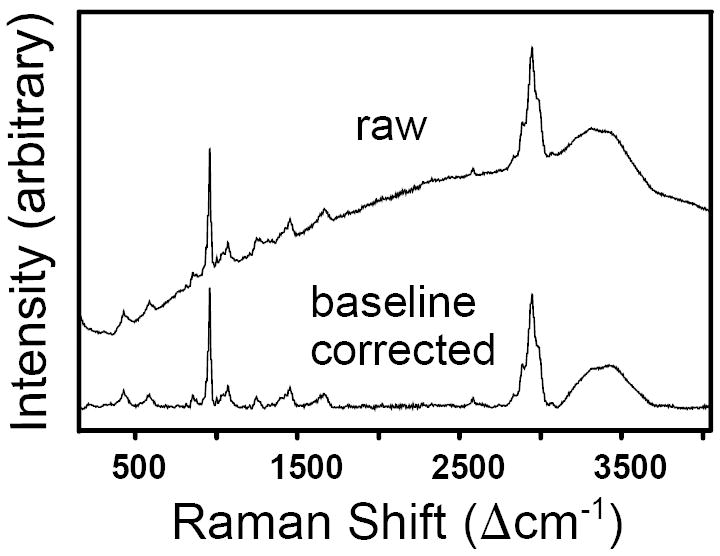
Raw and baseline-corrected Raman spectrum of rat bone obtained with 532 nm excitation.
RESULTS
Raman Spectra of Pure Tendon and Pure Bone
We first characterized pure bone and pure tendon (i.e., tissue away from the insertion site). Chemical and/or structural changes within the insertion site could then be monitored by comparison to these reference spectra. Figure 3 shows the overlaid spectra of pure tendon and pure bone (normalized to the intensity of the ~2940 Δcm-1 band), and Table I lists and assigns the individual peak positions. Because the Raman peaks arising from the organic materials in both tendon and bone are primarily due to contributions from the same organic molecule, i.e., type I collagen, the two materials are almost indistinguishable in the high-wavenumber region, i.e., their C–H, C–N, and O–H stretches in the 2800-3600 Δcm-1 range occur at the same positions. There is, however, a difference in relative peak intensities between tendon and bone, i.e., in spectra normalized to the intensity of the ~2940 Δcm-1 C–H mode, bone shows stronger C–N and O–H peaks compared to tendon (Fig. 3). In the lower wavenumber region, the peaks for apatite at ~428, ~589, ~960, and ~1072 Δcm-1 stand out in the bone spectrum (marked with the letter A in Fig. 3 and Table I), whereas most of the bands caused by the organic components appear at the same positions in both tendon and bone (Table I). There are two bands, however, at 750 and 1587 Δcm-1 that do not occur in bone and were only detected in tendon (indicated with the letter T in Fig. 3 and in Table I). Those two peaks are not caused by the collagen (i.e., protein) in tendon, but rather by the heme molecule of blood, whose Raman peaks are known to vary in relative peak intensities for different excitation wavelengths due to resonance effects between absorption and Raman scattering.18-20 For the 532 nm excitation used in our study, two of the Raman bands of hemoglobin are very strongly resonance enhanced (at ~750 and ~1587 Δcm-1) and appear as very characteristic narrow peaks in certain (blood-rich) areas of the tendon.
Fig. 3.
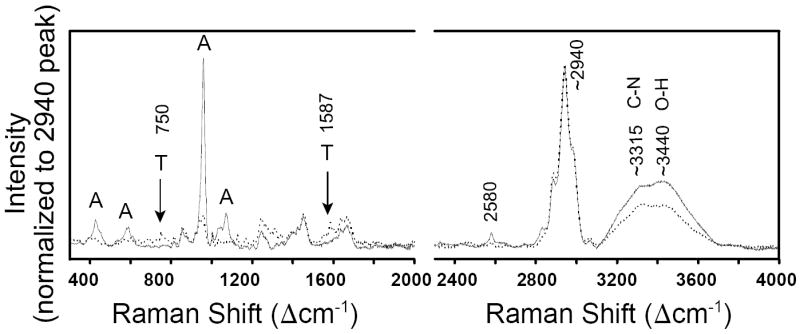
Raman spectra of rat tendon (dotted line) and bone (solid line). Spectra are from one single tissue sample and are normalized to an intensity of ~2940 Δcm-1 C–H stretch band and overlaid. Two peaks (labeled with ‘T’) are due to hemoglobin in blood and are only detected in tendon. Peaks that are characteristic of bioapatite are labeled with ‘A’.
TABLE I.
Raman peak positions in tissue.
| Collagen16 | Fish bone17 | Rat tendon | Rat bone | Assignments |
|---|---|---|---|---|
| 255 | ~264 | ~264 | ||
| 299 | 311 | ~310 | ||
| ~334 | ||||
| 391 | 387 | ~394 | δ(CCC) | |
| 418 | ||||
| 426 | ~428 | 428 A | ν2(PO43-) | |
| ~475 | ||||
| 533 | ~534 | δ(CCC) | ||
| 565 | ~572 | |||
| 589 | 589 A | ν4(PO43-) | ||
| 591 | 608 | 603 | 612 | ν4(PO43-) |
| 643 | ||||
| ~691 | ||||
| 725 | ~725 | |||
| 750 T | ν (pyrrole breathing of heme) | |||
| 760 | 769 | 763 | ~765 | ν(CCO) |
| 815 | 814 | 815 | 815 | ν(COC); ν(CC) of backbone |
| 855 | 856 | 854 | 854 | δ(CCH) aromatic |
| 873 | 876 | 872 | ~874 | ν(CC) of proline |
| 921 | 921 | 920 | 920 | ω(CH2) out-of-phase; ν(CC) of proline |
| 939 | 938 | 939 | 943 | ν(CC) of protein |
| 961 | 959 | 960 A | ν1(PO43-) | |
| 1004 | 1005 | 1003 | 1003 | ν(CC) aromatic ring |
| 1033 | 1034 | 1033 | ~1032 | ν(CC) of proline |
| 1042 | ~1040 A | ν3(PO43-) | ||
| 1057 | ||||
| 1071 | ~1085 | ~1072 A | ν3(PO43-) | |
| 1098 | 1101 | 1104 | ||
| 1124 | 1128 | ~1127 | δ(CH) | |
| 1171 | 1164 | 1169 | ~1167 | ν(CCC) out-of-phase |
| 1205 | 1202 | 1203 | 1204 | ω(CH2) in-phase |
| 1245 | 1245 | 1241 | 1243 | δ(NH2); δ(NH) |
| 1270 | 1267 | δ(NH) amide III | ||
| 1316 | 1317 | 1314 | 1321 | γ(CH2) |
| 1342 | ~1340 | 1341 | δ(CH2) | |
| 1378 | ||||
| 1391 | 1391 | ~1396 | ~1395 | δ(CH2) |
| 1425 | 1427 | 1426 | ~1425 | δ(CH2) |
| 1451 | 1451 | 1450 | ~1450 | δ(CH2, CH3) scissoring |
| 1561 | ~1560 | |||
| 1584 | 1587 T | ν(C=C) porphyrin in heme | ||
| 1611 | 1605 | ν(CCH) aromatic ring | ||
| 1638 | 1635 | 1637 | ν(C=C) | |
| 1667 | 1667 | 1666 | 1664 | ν(C=O) amide I |
| ~2462 | ||||
| 2578 | 2579 | |||
| 2829 | 2827 | S–H stretch | ||
| 2884 | 2885 | 2885 | ν(CH2) sym stretch | |
| 2940 | 2941 | 2940 | ν(CH3) sym, ν(CH2) asym stretch | |
| 2978 | 2990 | 2978 | ν(CH3) asym stretch | |
| 3059 | 3063 | 3066 | (C=C–H) aromatic stretch | |
| ~3320 | ~3316 | N–H stretch | ||
| ~3453 | ~3440 | O–H stretch |
(ν) Stretching; (δ) deformation; (A) bands assigned to apatite; (T) bands only found in tendon.
In principle, the integrated intensities of the ~960 Δcm-1 and ~1072 Δcm-1 bands can be used as quantitative indicators of the degree of mineralization of bone and the degree of carbonation of the apatite, respectively.21,22 In practice, however, accurate quantification in bone based on integrated peak intensities (i.e., peak areas) is very difficult due to the overlap of those mineral peaks with quite a few collagen bands (Fig. 4). Specifically, the organic bands at 920, ~940, and 1003 Δcm-1 appear not only in the spectrum for tendon, but also in the one for bone, and they overlap with the strongest band of apatite, i.e., the ν1 P–O symmetric stretch of phosphate at ~960 Δcm-1 in bioapatite. The quantification of the proportion of mineral in tissue samples is complicated further by the fact that even unmineralized tendon has a band at ~960 Δcm-1. Even though this band is small and only appears as a shoulder on the ~938 Δcm-1 band in the raw spectrum of pure tendon, it can be resolved unambiguously via peak deconvolution (see spectrum for point 1 in Fig. 5). In summary, the presence of several overlapping bands complicates the deconvolution of peaks and the accurate, reproducible calculation of band areas in the spectral region around 960 Δcm-1. Appropriate mineral–organic deconvolution is especially challenging at low degrees of mineralization, i.e., at the biological stage of intense interest. These overlaps are therefore the greatest challenge to the quantification of the mineral component relative to the organic component in such tissues.
Fig. 4.
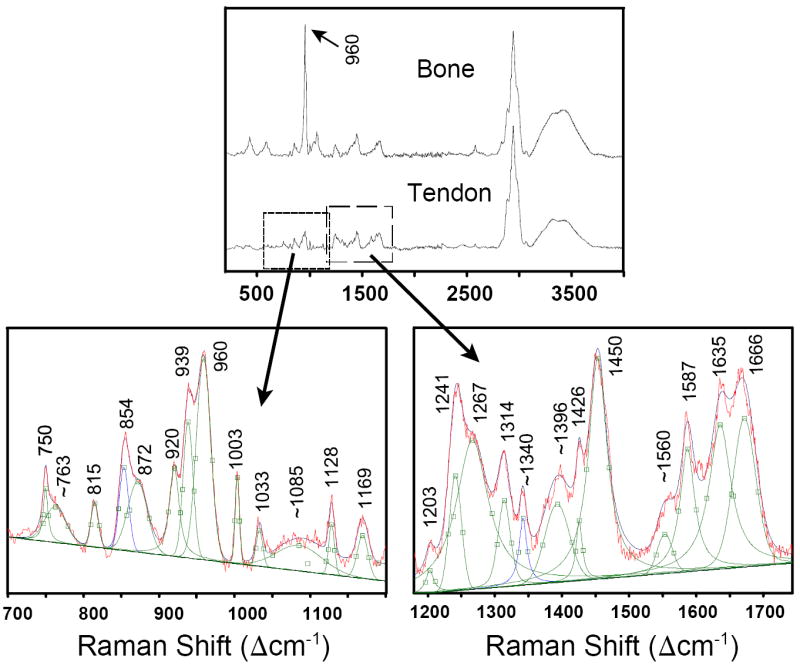
(Top) The P–O stretching mode for apatite at ~960 Δcm-1 in bone occurs in a spectral region that also has many peaks caused by the organic components. (Bottom) The enlarged areas show the deconvolution of the peaks in slightly mineralized tendon (position 3 of sample #2; see Fig. 5). Peaks at 750 and 1587 Δcm-1 only occur in tendon and are caused by hemoglobin in blood.
Fig. 5.
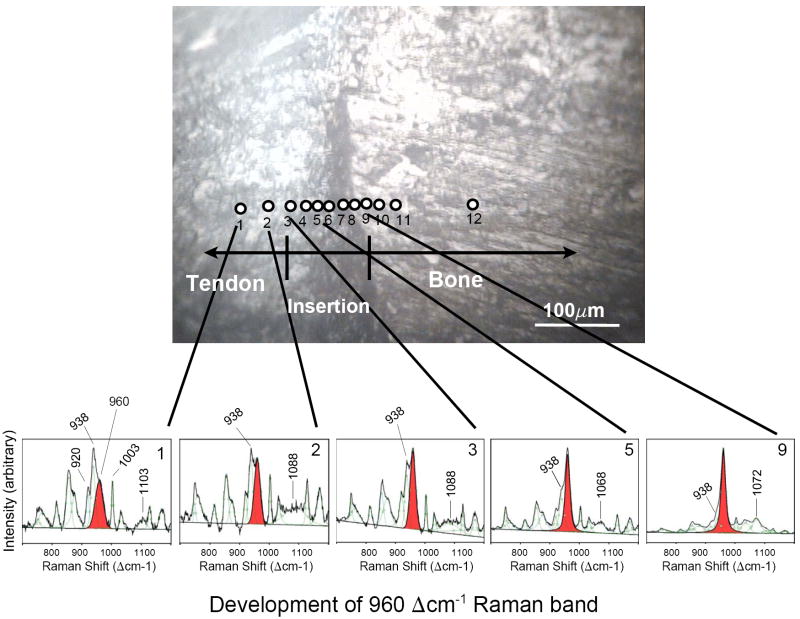
Raman spectra for individual 1 μm points (as indicated by numbered positions) examined across the tendon-to-bone insertion of sample #2, showing the development of the 960 Δcm-1 band that is indicative of the PO43- environment. Individual spectra are not normalized to one specific band, but rather each spectrum is expanded to full scale between 700 and 1200 Δcm-1. The band at 960 Δcm-1 (shaded) is present in the spectra of tendon (i.e., non-mineralized tissue) as well as in spectra of the insertion zone and bone (i.e., highly mineralized tissue). In pure tendon (positions 1 and 2), the 938 Δcm-1 band dominates the 960 Δcm-1 band. As the traverse enters the insertion zone (position 3), the 960 Δcm-1 band becomes stronger than the 938 Δcm-1 band, indicating the beginning of apatite mineralization. Farther along the insertion and into bone, the 960 Δcm-1 band becomes stronger, eventually dominating this spectral region.
Raman Spectra Across the Tendon-to-Bone Insertion Site
Our main focus in this study was to document changes in the organic and inorganic components from point to point across the 120 μm wide tendon-to-bone insertion zone and to interpret the mineral-to-collagen ratio in individual spectra. The intensities of the 960 Δcm-1 symmetric P–O stretch and the ~2940 Δcm-1 C–H stretch (or the 1003 Δcm-1 C–C stretch) were used to interpret the presence and relative concentration within the excitation volume of the mineral and collagen components, respectively.
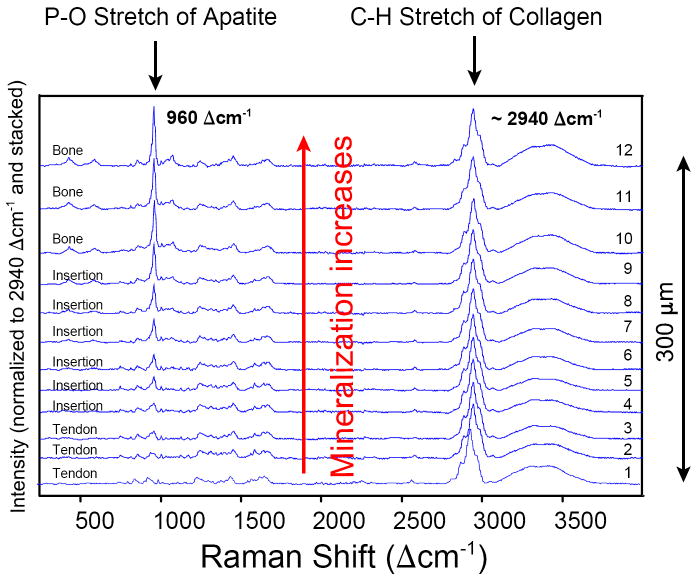
The degree of mineralization across the insertion zone can be readily demonstrated by visual comparison of individual spectra that are normalized to their ~2940 Δcm-1 C–H band (which is the most intense peak in our spectra) or to their 1003 Δcm-1 C–H band (which is the very characteristic C–C aromatic ring stretch associated with phenylalanine). Such intensity-normalized spectra from the same traverse in a given sample can be displayed either stacked (Fig. 6) or overlaid (Fig. 7) along the y-axis. Both methods of visual display make it obvious that the relative mineral content, represented by the intensity of the normalized P–O stretching mode at 960 Δcm-1, gradually increases across the insertion from pure tendon (position 1) to pure bone (position 12).
Fig. 6.
Spectra for individual points (numbered, see Fig. 5) examined across the 300 μm wide traverse in sample #2. All spectra are normalized to the intensity of the ~2940 Δcm-1 C–H symmetric stretching band (i.e., the strongest band in each spectrum is scaled to 100%) and then stacked along the y-axis for better comparison. The mineral content, represented by the P–O symmetric stretch at 960 Δcm-1, can be seen to gradually increase along the traverse from tendon to bone. The spectrum increasingly acquires the characteristics of an apatite spectrum starting at position 3 and barely changes between positions 10 and 12. The increase in mineral concentration is very obvious between positions 5 and 10.
Fig. 7.
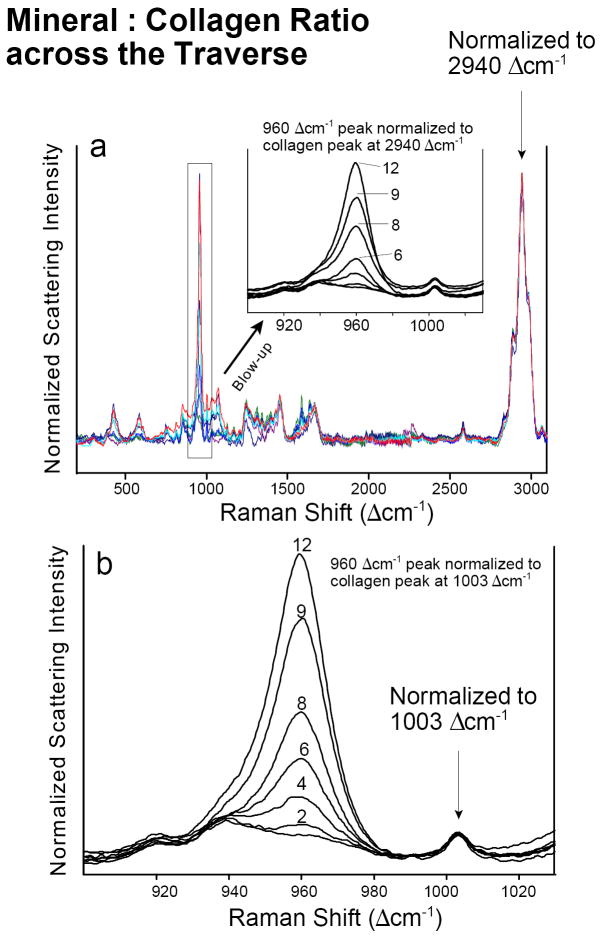
Intensity normalization of spectra from one traverse in tissue sample #2. (a) Normalization to the very intense “generic” 2940 Δcm-1 collagen band. (b) Normalization to the weak but very characteristic collagen band at 1003 Δcm-1 that is assigned to the aromatic ring vibrations in phenylalanine. Numbers indicate positions of individual points across the traverse in sample #2 (see Fig. 5).
Deconvolution of the individual spectra of the traverse (Fig. 5) shows that a band at ~960 Δcm-1 is present in all spectra, i.e., the spectra of the non-mineralized tendon, as well as of the insertion zone and bone. Note that the spectra shown in Fig. 5 are not normalized to one of the collagen bands, but rather each one is expanded to full scale between 700 and 1200 Δcm-1 to emphasize the gradual development of the 960 Δcm-1 peak with respect to its neighboring collagen bands at 938 and 1003 Δcm-1.
A peak at ~960 Δcm-1 indicates the presence of PO43- in a tetrahedral environment. In pure tendon (position 1, see Fig. 5) a 960 Δcm-1 component appears as a shoulder on the high-wavenumber side of the 938 Δcm-1 band. At position 2 in tendon, the 938 Δcm-1 band still dominates this spectral region. At position 3, the 960 Δcm-1 band has become more intense than the ~938 Δcm-1 band. This is a clear indication that an apatitic phosphate environment has been initiated. It is at this location that the other peaks for apatite also are detected (e.g., ν2 peak ~430 Δcm-1 and ν4 peak ~ 590 Δcm-1; not shown in Fig. 5), providing definitive identification of apatite mineralization in the tissue. The intensity of the 960 Δcm-1 peak continues to increase such that by position 5 the ~938 Δcm-1 component appears as only a shoulder on the 960 Δcm-1 P–O peak. In other words, starting at position 5, the peak that is indicative of a PO43- environment dominates this part of the spectrum, and apatitic mineralization is clearly present (see also Fig. 6). At position 9, the spectrum looks very much like a bone spectrum, except that the abundance of apatite in the excitation volume is still below that in pure bone, i.e., in positions 11 and 12. The latter relation can be seen best in the overlaid normalized spectra in Fig. 7.
In addition to the dramatic changes in the 960 Δcm-1 peak intensity, a number of subtle changes in the spectrum are evident in an individual traverse across the tendon-to-bone insertion site (see Fig. 5). For instance, a broad band is seen at 1103 Δcm-1 in the tendon (position 1) that becomes broader and downshifts upon entrance into the insertion (to 1088 Δcm-1 at point 2, 1085 Δcm-1 at point 3, and 1068 Δcm-1 at point 5). Starting at point 7 this organic band cannot be resolved anymore, and the spectral region is dominated by the 1072 Δcm-1 band that arises from the presence of carbonated apatite.
The increase in mineral content (relative to the matrix) at individual positions across an individual traverse can be easily seen in spectra that are normalized, but overlaid—rather than stacked—along their normalized y-axes (Fig. 7). One way of evaluating the increasing mineral-to-collagen ratio across a single insertion site is to normalize the spectra of a given tissue sample to the intensity of their ~2940 Δcm-1 bands. Another way is to normalize to the 1003 Δcm-1 aromatic C–C stretch of phenylalanine. The latter is a well-defined band specific to collagen, one that is close to the 960 Δcm-1 P–O band and that does not overlap with any other collagen band. The results of normalizing the 960 Δcm-1 band to the 1003 Δcm-1 band (Fig. 7b) are very similar to those obtained through normalization to the intensity of the “generic” C–H stretch at 2940 Δcm-1 (Fig. 7a).
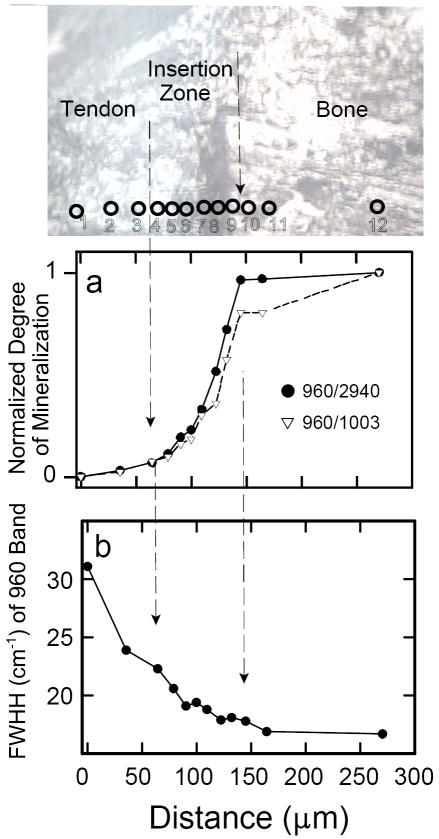
Figure 8 quantitatively shows the normalized intensity ratios (960Int/2940Int) and (960Int/1003Int) as a function of distance for tissue sample #2. The gradation in mineralization appears continuous and almost linear across the insertion zone of one single sample. Interestingly, the beginning of the change in degree of mineralization is not correlated with the leading edge of the visual dark “tidemark”. Deconvolution of all the spectra also permitted evaluation of (changes in) the width of the 960 Δcm-1 band (Fig. 8b shows the results from one single traverse). There is a well-defined trend of decreasing bandwidth upon approach to the bone; from point 3 to point 10 the range in width is about 6 cm-1.
Fig. 8.
Spectroscopic changes observed in one traverse of tissue sample #2. (a)Normalized degree of mineralization across tendon-to-bone insertion site: by definition, the degree of mineralization of pure bone = 1 and the degree of mineralization of pure tendon = 0. The y-axis shows the intensity ratios of the two peaks characteristic of the mineral and organic components of the tissue normalized to the respective values in pure bone. In other words, the y-axis shows [(960Int/2940Int)in sample divided by (960Int/2940Int)in bone], and [(960Int/1003Int)in sample divided by (960Int/1003Int)in bone], respectively. (b) The full width at half-intensity (FWHH) of the 960 Δcm-1 band in apatite, monitored across the insertion site, based on devonvolved spectra.
DISCUSSION
In our unstained thick tissue section, the supraspinatus tendon-to-bone insertion site appeared in visible reflected light as a poorly defined darkened ~50 μm wide transitional zone (Fig. 1b). This darkened zone appeared similar to what had been identified as the tidemark in histologic, stained thin sections.9 Before our study, it had been unclear whether this visually recognizable tidemark zone is correlated with the presence of mineral in the tissue, and if so, to what extent. Based on histologic examination alone, previous investigators had proposed a sharp, abrupt transition from unmineralized to mineralized tissue.9 We tested this proposal in the current pilot study by measuring the local mineral abundance across the tendon-to-bone insertion of the rotator cuffs of five different rats.
As is well recognized, true quantitative Raman information cannot be obtained on the absolute concentration of different components (e.g., mineral, collagen) or on ionic substitutions within a crystal (e.g., carbonate within apatite), because absolute peak intensities in Raman spectra are affected by Raman scattering efficiency, the volume excited by the laser beam, the orientation of the sample, the absorption by the sample, and several other optical effects, such as grain size, refractive index, and roughness of the sample. But even the relative quantification of Raman spectra of biological composites to determine, for instance, the degree of mineralization and the degree of atomic order of the mineral (relative to crystalline hydroxylapatite), can be challenging. Peak-fitting routines and chemometric methods, such as principal component analysis (PCA) applied to a large number of spectra, can be useful in determining the number of overlapping peaks.
However, there is some uncertainty associated with curve-fitting procedures, and our experience is that not all mathematically convergent solutions are spectroscopically meaningful. Indeed, in the case of the present study of individual point spectra of five tendon-to-bone transects, our attempts at quantification of the mineral component were more convincing when peak intensities (as shown in Figs. 8 and 9), rather than peak areas (i.e., integrated peak intensities), were interpreted. Plots of results based on normalized peak area ratios (analogous to Figs. 8 and 9, which are based on normalized peak intensity ratios) showed a much more irregular increase in mineral content from tendon to bone (not shown). The latter is due to the fact that the errors in determining individual peak areas (especially from complex, deconvolved peaks) are much larger than the ones in determining peak heights. The observation that peak heights can be more reliable than areas for the quantitative interpretation of Raman spectra of bone has also been made recently by Schulmerich et al.23 Large errors in peak area calculations can be triggered by large uncertainties in the software’s ability to assign correct band widths to weak spectral components. Thus, for samples in which the bands are weak, superimposed, and/or of variable width (see Fig. 8b), operator-imposed constraints on peak widths are advisable in order to obtain spectroscopically meaningful results.
Fig. 9.
Gradual change in degree of mineralization across the ~120 μm wide tendon-to-bone transition of the rat’s rotator cuff (n = 5) as evaluated by different peak height ratios: (a) (960Int/1003Int) versus distance; (b) (960Int/2940Int) versus distance. Peak heights were measured on spectra that were first background-corrected between 100 and 4000 Δcm-1. Over the short distance of 120 μm (from −60 μm to +60 μm) the relative change in mineralization is linear with a linear correlation coefficient R2 of ~0.8 for both methods of quantification.
Careful deconvolution of the current spectra, however, did permit assessment of the width of the 960 Δcm-1 band, which indicates the degree of atomic order in the crystal structure of the mineral, also called the crystallinity gradient. The wider the FWHH of the ν1 P–O stretch of the apatite is, the less atomically ordered is its crystal structure and the lower is the mineral’s degree of crystallinity. The peak-width variation shows that the apatite’s degree of crystalline order is low on the tendon side of the insertion and high on the bone side of the insertion. Thus, we established spectroscopically that not only does the proportion of mineral change across the insertion site, but so does an important structural attribute of the mineral, i.e., its degree of crystallinity. The reason for this observed change in crystallinity across the 120 μm wide tendon-to-bone insertion zone is unknown to date. Most likely, it cannot be explained by a temporal factor (i.e., different age of tissue in different locations) across the traverse, but rather by cellular or biological factors.
We also evaluated the use of two different peaks (at 1003 and 2940 Δcm-1) to represent the relative abundance of the organic content. Whereas the 2940 Δcm-1 peak is the strongest peak in the spectrum, it is not specific to any particular amino acid or its side chain. The 1003 Δcm-1 peak is weak, but spectrally isolated, and it is very specific for the presence of one side chain in one particular amino acid, i.e., the benzene ring in phenylalanine. Aromatic side chains in proteins have strong Raman scattering cross-sections and thus result in unusually strong bands that are characteristic for this particular amino acid.24 Although neither the 2940 Δcm-1 nor the 1003 Δcm-1 band is ideal for quantification, both bands yield similar results (Figs. 8a and 9). The 1003 Δcm-1 band has the added benefit that it is close to the P–O stretch at 960 Δcm-1 and it does not overlap with any other bands.
The linear gradation in mineral content within rat tissue sections (Fig. 9) is consistent with the gradations in biomechanical properties and fibrocartilage composition that have been described previously.8,9,25 Contrary to the proposed abrupt transition based on the observation of a tidemark in histologic stained sections, we confirmed with Raman spectroscopy that the mineral content indeed increases gradually, just as mechanical models would predict. The gradual increase in mineralization over a distance of only 120 μm may serve to minimize stress concentrations that otherwise would arise between two materials with vastly different mechanical properties, i.e., compliant tendon and stiff bone. This gradual mineralization can protect the attachment from rupture.8,9,25,26
As mentioned above, there is also a small peak at 960 Δcm-1 that is present in the non-mineralized tendon and that is seen as a shoulder (already at location 1, see Fig. 5) on the much stronger 938 Δcm-1 peak. This weak shoulder can be observed in the published spectra of previous Raman spectroscopy reports on tendon collagen27,28 and unmineralized ocular tissue.29,30 The band was not specifically mentioned or assigned, however, except by Frushour and Koenig,27 who assigned a peak at 966 Δcm-1 to an amide III vibration. We find it interesting that the band that develops into the P–O stretch of phosphate (i.e., the tetrahedral PO43- configuration) already appears as a spectral shoulder in unmineralized tendon. This feature appears equally strong in tendon soaked in phosphate-buffered saline (PBS) or only in de-ionized water. In future Raman studies across a tendon-to-bone insertion in an animal that is still developing (i.e., in a fetus or in the early period after birth), it will be possible to monitor the development of the 960 Δcm-1 P–O stretch both prior to and after mineralization has occurred. Such future work may help assign the cause of the ~960 Δcm-1 band in the non-mineralized side of the insertion site.
CONCLUSION
Over the last decade, Raman spectroscopy has established itself as a very useful technique to address clinical issues through the study of biological mineralized samples, both in vivo31,32 and in vitro.33,34 Many such studies address the quantification and spatial distribution of mineralization in tissue samples through use of sophisticated instrumental and mathematical protocols that include Raman imaging35,36 and chemometric methods such as factor analysis-based self-modeling curve resolution.37 One of the goals of our study was an analysis of the (mis)match between changes in spectral components and in physically recognizable features in tissue. Such analyses can help guide the development of best practices in spectral mapping and imaging. Our results indicate that peak intensity measurements can be very useful in capturing changes in relative abundances of components in biological tissue, which supports the use of Raman imaging (that is typically based on the interpretation of intensities rather than areas) for such purposes. On the other hand, only through careful, manual deconvolution of spectra (as typically is done to determine band areas) were changes in band width revealed, which implied a change in the character of one of the two components in the tissue. The latter, more spectrally nuanced change, is less likely to be captured in typical spectral imaging that relies on automated mathematical algorithms.
In our current study, we were able to gain valuable insight into an important clinical issue through interpretation of a limited number of actual spectra that were obtained individually from micrometer-sized spots across tissue samples of five animals. We showed that the mineral-to-collagen ratio at the insertion linearly increases from tendon to bone and that the atomic (i.e., crystalline) order in the existing mineral increases over the same interval. These phenomena have not been described previously. Raman microprobe spectroscopy demonstrated several advantages over other techniques commonly used for materials characterization: it has excellent spatial resolution for analyzing changes across the tendon-to-bone insertion, Raman signals are strong from both the mineral and organic components, and the technique requires almost no special sample preparation in contrast to many other methods used to analyze the composition of biological materials that require significant manipulation of the sample (e.g., drying, freezing, formalin fixation, staining).
The attachment of dissimilar materials is known to be a major challenge in materials science because of the high levels of localized stress that develop at their interface. An interesting biologic solution to this problem exists at the attachment of compliant tendon to stiff bone. The visually most prominent part of this attachment is recognized by histologists and biologists as a dark band of tissue that is called a tidemark.8,9,13 It was previously proposed that this tidemark indicated an abrupt change in the degree of mineralization from zero in the tendon to ~60 wt % in the bone.8,9 From an engineering point of view, however, such an abrupt change could not be explained, because it would be a source of stress concentration and would put the interface at risk for rupture. We were able to show here on the tissue samples from five healthy rats that that the transition from non-mineralized to mineralized tissue indeed occurs gradually at the insertion site (over a distance of ~120 μm), consistent with what would be expected from an engineering analysis. One can speculate that the change in character (i.e., crystalline order) of the mineral across this interval also might contribute to the gradational change in mechanical properties.
It is unknown whether the transition between tendon and bone in healing tissues (i.e., in tissues after injuries) recreates the mineral content gradation that we found in our study. When a tendon is surgically repaired to bone (as occurs in most rotator cuff repairs), the transitional features of the organic component are not recreated.38,39 It is therefore unlikely that the gradation in mineral concentration is regenerated during the healing process after surgery. This lack of gradation probably leads to a mechanically inferior interface and the clinically observed recurrent failures.3,4,40,41 Understanding the differences between the normal tissue and the tissue that heals after surgical repair will allow us to develop methods and materials to improve tendon-to-bone healing. Future studies, therefore, will not only be applied to healthy tissue but also to tissue that has healed after surgical repair.
Further refinement of the Raman microprobe spectroscopic methods described in this paper may lead to a tool for diagnosing clinically important problems (e.g., rotator-cuff degeneration, cartilage degradation). Raman spectroscopic techniques could provide a clinician with a description of the localized biochemical composition of the tissue of interest. This information can be acquired on a micrometer spatial scale and may be particularly relevant in tissues that change in composition over a short distance (e.g., the tendon-to-bone insertion site). Raman signatures for normal tissues would be compared to the Raman signatures of symptomatic tissues to diagnose tissue damage or deterioration.
Acknowledgments
We appreciate the helpful comments by two anonymous reviewers. This work was funded in part by the Center for Materials Innovation at Washington University in St. Louis and by the NIH through grant EB004347.
References
- 1.Praemer A, Furner S, Rice D. Musculoskeletal Conditions in the United States. American Academy of Orthopaedic Surgeons; Park Ridge, IL: 1992. [Google Scholar]
- 2.Kelsey JL. Upper Extremity Disorders: Frequency, Impact and Cost. 1 Churchill Livingstone; New York: 1997. [Google Scholar]
- 3.Harryman DT, Mack LA, Wang KY, Jackins SE, Richardson ML, Matsen FA. J Bone Joint Surg. 1991;73:982. [PubMed] [Google Scholar]
- 4.Galatz LM, Ball CM, Teefey SA, Middleton WD, Yamaguchi K. J Bone Joint Surg Am Part A. 2004;86:219. doi: 10.2106/00004623-200402000-00002. [DOI] [PubMed] [Google Scholar]
- 5.Woo SL, An K, Frank CB, Livesay GA, Ma CB, Zeminski JA, Wayne JS, Myers BS. Orthopaedic Basic Science. American Academy of Orthopaedic Surgeons; Rosemont, IL: 2000. Anatomy, Biology, and Biomechanics of Tendon and Ligament; p. 581. [Google Scholar]
- 6.Bostrom MPG, Boskey A, Kauffman JK, Einhorn TA. Form and Function of Bone. In: Buckwalter JA, Einhorn TA, Simon SR, editors. Orthopaedic Basic Science. American Academy of Orthopaedic Surgeons; Rosemont, IL: 2000. p. 319. [Google Scholar]
- 7.Boskey A. Bone Mineralization. In: Cowin SC, editor. Bone Mechanics Handbook. Vol. 5. CRC Press; Boca Raton, FL: 2001. pp. 1–33. [Google Scholar]
- 8.Woo SL, Maynard J, Butler D. Ligament, Tendon, and Joint Capsule Insertions to Bone. In: Woo SL, editor. Injury and Repair of the Musculoskeletal Soft Tissues. American Academy of Orthopaedic Surgeons; Savannah, GA: 1987. p. 129. [Google Scholar]
- 9.Benjamin M, Kumai T, Milz S, Boszczyk BM, Boszczyk AA, Ralphs JR. Comp Biochem Physiol Part A. 2002;133:931. doi: 10.1016/s1095-6433(02)00138-1. [DOI] [PubMed] [Google Scholar]
- 10.Soslowsky LJ, Carpenter JE, DeBano CM, Banerji I, Moalli MR. J Shoulder Elbow Surg. 1996;5:383. doi: 10.1016/s1058-2746(96)80070-x. [DOI] [PubMed] [Google Scholar]
- 11.Pasteris JD, Wopenka B, Freeman JJ, Rogers K, Valsami-Jones E, van der Houwen JAM, Silva MJ. Biomaterials. 2004;25:229. doi: 10.1016/s0142-9612(03)00487-3. [DOI] [PubMed] [Google Scholar]
- 12.Wopenka B, Pasteris JD. Mater Sci Eng, Part C: Biomimetic Supramol Syst. 2005;25:131. [Google Scholar]
- 13.Glimcher MJ. Rev Mineral Geochem. 2006;64:223. [Google Scholar]
- 14.Hanlon EB, Manoharan R, Koo TW, Shafer KE, Motz JT, Fitzmaurice M, Kramer JR, Itzkan I, Dasari RR, Feld MS. Phys Med Biol. 2000;45:R1. doi: 10.1088/0031-9155/45/2/201. [DOI] [PubMed] [Google Scholar]
- 15.Golcuk K, Mandair GS, Callender AC, Sahar N, Kohn DH, Morris MD. Biochim Biophys Acta. 2006;1758:868. doi: 10.1016/j.bbamem.2006.02.022. [DOI] [PubMed] [Google Scholar]
- 16.Edwards HMG, Farwell DW, Holder JM, Lawson EE. J Mol Struct. 1997;435:49. [Google Scholar]
- 17.Chen J, Burger C, Krishnan CV, Chu B, Hsiao BS, Glimscher MJ. Macromol Chem Phys. 2005;206:43. [Google Scholar]
- 18.Spiro TG, Strekas TC. J Am Chem Soc. 1974;96:338. doi: 10.1021/ja00809a004. [DOI] [PubMed] [Google Scholar]
- 19.Sato H, Chiba H, Tashiro H, Ozaki Y. J Biomed Opt. 2001;6:366. doi: 10.1117/1.1380668. [DOI] [PubMed] [Google Scholar]
- 20.Wood BR, McNaughton D. J Raman Spectrosc. 2002;33:517. [Google Scholar]
- 21.Awonusi A, Morris MD, Tecklenburg MJ. Calfic Tissue Int. 2007;81:46. doi: 10.1007/s00223-007-9034-0. [DOI] [PubMed] [Google Scholar]
- 22.Pasteris JD, Yoder CH, Rogers KD, Sternlieb M, Man S. Geol Soc Am Abstracts Programs. 2007;39:295. [Google Scholar]
- 23.Schulmerich MV, Dooley KA, Vanasse TM, Goldstein SA, Morris MD. Appl Spectrosc. 2007;61:671. doi: 10.1366/000370207781393307. [DOI] [PubMed] [Google Scholar]
- 24.Tuma R. J Raman Spectrosc. 2005;36:307. [Google Scholar]
- 25.Thomopoulos S, Williams GR, Gimbel JA, Favata M, Soslowsky LJ. J Orth Res. 2003;21:413. doi: 10.1016/S0736-0266(03)00057-3. [DOI] [PubMed] [Google Scholar]
- 26.Thomopoulos S, Marquez JP, Weinberger B, Birman V, Genin GM. J Biomech. 2006;39:1842. doi: 10.1016/j.jbiomech.2005.05.021. [DOI] [PubMed] [Google Scholar]
- 27.Frushour BG, Koenig JL. Biopolymers. 1975;14:379. doi: 10.1002/bip.1975.360140211. [DOI] [PubMed] [Google Scholar]
- 28.Wang YN, Galiotis C, Bader DL. J Biomechanics. 2000;33:483. doi: 10.1016/s0021-9290(99)00194-3. [DOI] [PubMed] [Google Scholar]
- 29.Goheen SC, Lis LJ, Kauffman JW. Biochim Biophys Acta. 1978;536:197. doi: 10.1016/0005-2795(78)90065-x. [DOI] [PubMed] [Google Scholar]
- 30.Mizuno A, Tsuji M, Fujii K, Kawauchi K, Ozaki Y. Jpn J Ophthalmol. 1994;38:44. [PubMed] [Google Scholar]
- 31.Bakker Schut TC, Witjes MJH, Sterenborg HJCM, Speelman OC, Roodenburg JLN, Marple ET, Bruining HA, Puppels GJ. Anal Chem. 2000;72:6010. doi: 10.1021/ac000780u. [DOI] [PubMed] [Google Scholar]
- 32.Matousek P, Draper ERC, Goodship AE, Clark IP, Ronayne KL, Parker AW. Appl Spectrosc. 2006;60:758. doi: 10.1366/000370206777886955. [DOI] [PubMed] [Google Scholar]
- 33.Jyothi Lakshmi R, Alexander M, Kurien J, Mahato KK, Kartha VB. Appl Spectrosc. 2003;57:1100. doi: 10.1366/00037020360695964. [DOI] [PubMed] [Google Scholar]
- 34.Dehring KA, Crane NJ, Smukler AR, McHugh JB, Roessler BJ, Morris MD. Appl Spectrosc. 2006;60:1134. doi: 10.1366/000370206778664743. [DOI] [PubMed] [Google Scholar]
- 35.Timlin JA, Carden A, Morris MD, Bonadino JF, Hoffler CE, II, Kozloff KM, Goldstein SA. J Biomed Opt. 1999;4:28. doi: 10.1117/1.429918. [DOI] [PubMed] [Google Scholar]
- 36.Tarnowski CP, Ignelzi MZ, Wang W, Taboas JM, Goldstein SA, Morris MD. J Bone Mineral Res. 2004;19:64. doi: 10.1359/JBMR.0301201. [DOI] [PubMed] [Google Scholar]
- 37.Levina E, Wagaman AS, Callender AF, Mandiar GS, Morris MD. J Chemom. 2007;21:24. [Google Scholar]
- 38.Thomopoulos S, Hattersley G, Rosen V, Mertens M, Galatz L, Williams GR, Soslowsky LJ. J Ortho Res. 2002;20:454. doi: 10.1016/S0736-0266(01)00144-9. [DOI] [PubMed] [Google Scholar]
- 39.Thomopoulos S, Williams GR, Soslowsky LJ. J Biomechan Eng. 2003;125:106. doi: 10.1115/1.1536660. [DOI] [PubMed] [Google Scholar]
- 40.Iannotti JP, Naranja RJ, Gartsman GM. Surgical Treatment of the Intact Cuff and Repairable Cuff Defect: Arthroscopic and Open Techniques. In: Norris TR, editor. Orthopaedic Knowledge Update: Shoulder and Elbow. American Academy of Orthopaedic Surgeons; Rosemont, IL: 1994. p. 151. [Google Scholar]
- 41.Naranja R, Iannotti JP, Gartsman GM. Complications in Rotator Cuff Surgery. In: Norris TR, editor. Orthopaedic Knowledge Update: Shoulder and Elbow. American Academy of Orthopaedic Surgeons; Rosemont, IL: 1994. p. 157. [Google Scholar]


