Abstract
Glycans are attractive targets for molecular imaging but have been inaccessible because of their incompatibility with genetically encoded reporters. We demonstrated the noninvasive imaging of glycans in live developing zebrafish, using a chemical reporter strategy. Zebrafish embryos were treated with an unnatural sugar to metabolically label their cell-surface glycans with azides. Subsequently, the embryos were reacted with fluorophore conjugates by means of copper-free click chemistry, enabling the visualization of glycans in vivo at subcellular resolution during development. At 60 hours after fertilization, we observed an increase in de novo glycan biosynthesis in the jaw region, pectoral fins, and olfactory organs. Using a multicolor detection strategy, we performed a spatiotemporal analysis of glycan expression and trafficking and identified patterns that would be undetectable with conventional molecular imaging approaches.
The cell-surface glycome is a rich source of information that reports on the cell’s physiological state. For example, changes in glycan structures serve as markers of altered gene expression during development (1) and disease progression (2). The dynamics of glycans at the plasma membrane reflect the activity of the cell’s secretory machinery (3), and their relative abundances report on flux in metabolic pathways inside the cell (4). Glycans are therefore attractive targets for in vivo imaging but have been inaccessible because of their incompatibility with genetically encoded reporters (5).
To image glycans in vivo, we employed a strategy in which an azide is introduced into target biomolecules, priming them for selective covalent reaction with fluorescent probes (5). The azide is small, stable in biological systems, and selectively reactive with phosphines or activated alkynes. Previously, the Staudinger ligation (6, 7) or copper-catalyzed click chemistry (8, 9) have been used to detect azide-labeled biomolecules on cells ex vivo. However, in vivo imaging of dynamic biological processes using these chemistries could be complicated by slow reaction kinetics or reagent toxicity. The copper-free click reaction of azides with difluorinated cyclooctyne (DIFO) reagents (10) overcomes these limitations, suggesting its potential application to in vivo imaging.
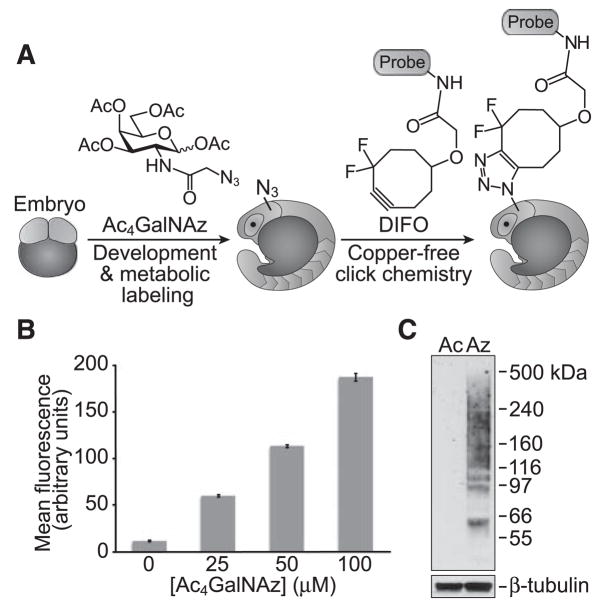
We chose zebrafish as a model organism because of their well-defined developmental program (11), emerging disease models (12), and amenability to optical imaging. The metabolic substrate peracetylated N-azidoacetylgalactosamine (Ac4GalNAz) was selected on the basis of its known incorporation into mucin-type O-linked glycoproteins in mammalian cells and mice via the N-acetylgalactosamine (GalNAc) salvage pathway (13, 14) (fig. S1). We envisioned an imaging experiment (Fig. 1A) in which zebrafish embryos are incubated with Ac4GalNAz and their glycans are visualized by reaction with DIFO-fluorophore conjugates (fig. S2).
Fig. 1.
Ac4GalNAz is metabolically incorporated into zebrafish glycans. (A) Schematic depicting the use of metabolic labeling with Ac4GalNAz and copper-free click chemistry using DIFO probes for the noninvasive imaging of glycans during zebrafish development. (B) Flow cytometry analysis of ZF4 cells metabolically labeled with Ac4GalNAz. ZF4 cells were incubated with Ac4GalNAz (0 to 100 μM, 3 days) and subsequently reacted with DIFO-488 (10 μM, 1 hour). Error bars represent the standard deviation from three replicate samples. (C) Immuno-blot analysis of lysates from zebrafish embryos at 120 hpf incubated with Ac4GalNAc (Ac) or Ac4GalNAz (Az), probed with horseradish peroxidase–conjugated antibody to Flag (top panel) or antibody to β-tubulin (bottom panel).
Before performing imaging experiments, we confirmed that the zebrafish glycan biosynthetic enzymes are permissive of the unnatural sugar. The zebrafish cell line ZF4 (15) was incubated with various doses of Ac4GalNAz, reacted with a DIFO–Alexa Fluor 488 conjugate (DIFO-488, fig. S2), and analyzed by flow cytometry (Fig. 1B). Robust dose-dependent metabolic labeling was observed, similar to that of mammalian cells (13, 14). We further characterized the azide-labeled cell lysates by treatment with a DIFO–Flag peptide conjugate (10). The observed high-molecular-weight species were consistent with labeled glycoproteins (fig. S3). We then purified the Flag-containing species (16) and identified several glycoproteins (β-hexosaminidase, β-integrin 1b, lysosome-associated membrane protein, nicastrin, scavenger receptor B, and Thy1) with known (17–19) or predicted (20) sites of mucin-type O-linked glycosylation (fig. S4). We concluded that Ac4GalNAz was metabolically incorporated into glycoproteins in zebrafish-derived cells.
We next evaluated Ac4GalNAz labeling in vivo. Zebrafish embryos were incubated in media containing either Ac4GalNAz or, as a control, peracetylated GalNAc (Ac4GalNAc) from 3 to 120 hours post-fertilization (hpf). Whole-animal lysates were then reacted with a phosphine-Flag probe (21) (fig. S2) and analyzed (Fig. 1C). The labeled glycoproteins were refractory to digestion with peptide N-glycosidase F or chon-droitinase ABC (fig. S5), which suggests that GalNAz is primarily incorporated into mucin-type O-linked glycoproteins.
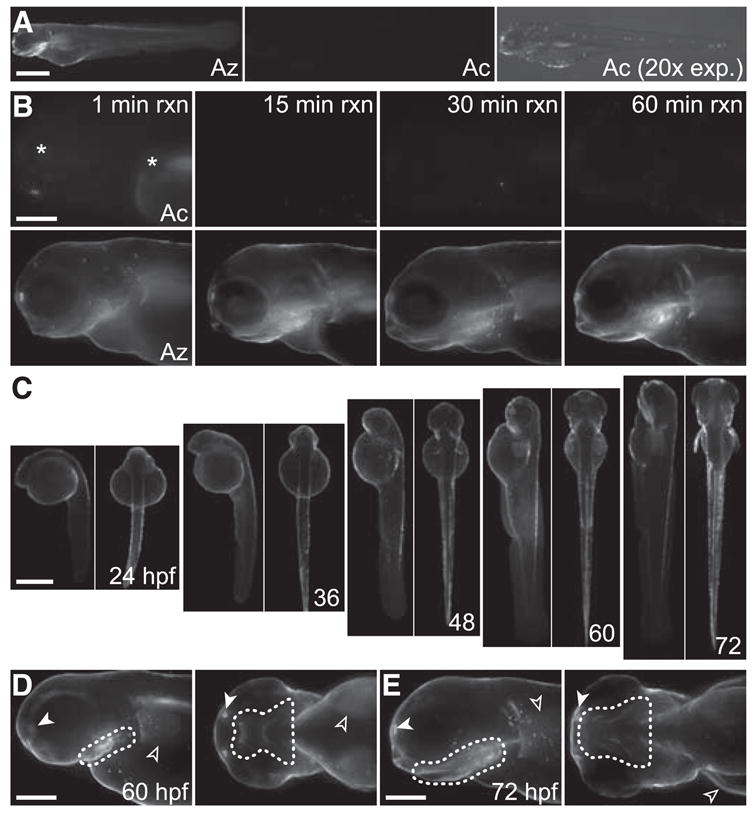
To image azide-labeled glycans in vivo, we incubated zebrafish embryos with either Ac4GalNAz or Ac4GalNAc from 3 to 72 hpf and then reacted the embryos with a DIFO–Alexa Fluor 647 conjugate (DIFO-647, fig. S2). Robust fluorescence was observed with virtually no background (Fig. 2A). Even after a 1-min reaction with DIFO-647, the Ac4GalNAz-treated embryos displayed substantial fluorescence that increased in a time-dependent manner (Fig. 2B). We observed no toxicity or developmental abnor-malities resulting from treatment with Ac4GalNAz or any DIFO reagents (fig. S6 and supporting online material text).
Fig. 2.

In vivo imaging of glycans during zebrafish development. (A and B) Zebrafish embryos were metabolically labeled with Ac4GalNAz (Az) or Ac4GalNAc (Ac) starting at 3 hpf. (A) Embryos were reacted at 72 hpf with DIFO-647 for 1 hour. The right panel indicates an exposure time that is 20 times longer than that in the other two panels. (B) Embryos were reacted at 72 hpf with DIFO-647 for 1 to 60 min. Asterisks denote autofluorescence. (C) Zebrafish embryos incu- bated with Ac4GalNAz or Ac4GalNAc (fig. S6) starting at 3 hpf were reacted with DIFO-647 at 24 hpf and subsequently at 12-hour intervals, viewed laterally and ventrally (alternating panels). (D and E) Zebrafish from (C) imaged at higher magnification at 60 hpf (D) or 72 hpf (E), viewed laterally (left panels) and ventrally (right panels). Solid arrowhead, olfactory organ; open arrowhead, pectoral fin. Dotted line indicates the pharyngeal epidermis in the jaw region. Scale bars in (A) and (C), 500 μm; in (B), (D), and (E), 200 μm.
We then assessed global patterns of glycosylation by incubating embryos with Ac4GalNAz starting at 3 hpf, followed by reaction with DIFO-647 at 12-hour intervals over a 5-day period. We observed azide-labeled glycans as early as 24 hpf (Fig. 2C and fig. S6). Starting at 60 hpf and continuing until at least 72 hpf, we observed a burst in fluorescence intensity in the jaw region, pectoral fins, and olfactory organs (Fig. 2, D and E). Thus, we focused on 60 to 72 hpf for more detailed studies of glycan expression and dynamics in these structures.
We sought to resolve temporally distinct populations of glycans using two- and three-color detection experiments (fig. S7). Embryos labeled with Ac4GalNAz were reacted with DIFO-647 at 60 hpf to visualize the cell-surface glycans exposed at that time point. Because the fluorophore cannot penetrate cells (10), nascent azide-labeled glycans trafficking through the secretory pathway remained unreacted. In order to distinguish these newly synthesized glycans from the previously reacted population, we treated the embryos with tris-(2-carboxyethyl)phosphine (TCEP) to quench unreacted cell-surface azides and then reacted the embryos with a second fluorophore, DIFO-488 (fig. S8). After the procedure, the “old” glycans could be visualized by DIFO-647 fluorescence and the “new” glycans by DIFO-488 fluorescence (fig. S7).
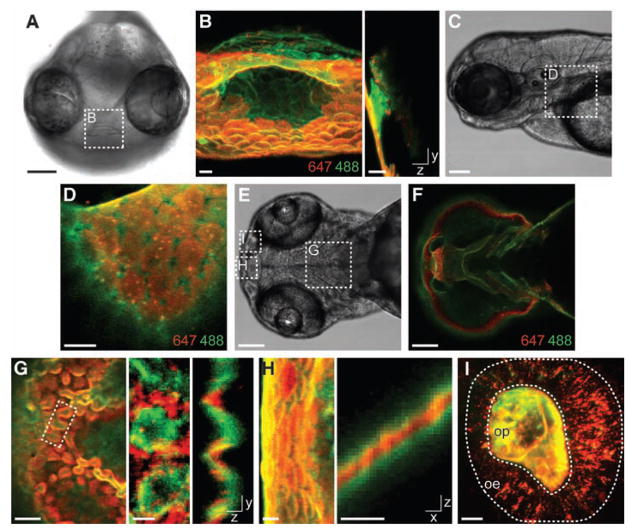
Throughout the organism, we observed zones of de novo glycan biosynthesis (Fig. 3, A to D, and fig. S9). For example, the invagination of the mouth was labeled minimally by the first reaction but prominently by the second (Fig. 3, A and B, and movie S1), suggesting that although this structure was present at 60 hpf, its cells had only recently synthesized large amounts of GalNAz-labeled glycans. Further, we could readily distinguish plasma membrane–associated glycans from those that had been internalized by the cells. We noticed differential rates of endocytosis among cells throughout the embryo. In the eye and dorsal epithelium regions, prominent cell-surface fluorescence was apparent from both DIFO reagents, suggesting a slow rate of glycan internalization (movie S2). However, in the pectoral fin, the old glycans detected with DIFO-647 (at 60 hpf) had been almost entirely internalized by the time the embryos were imaged, whereas the new glycans detected with DIFO-488 (at 62 hpf) were predominantly cell-surface–bound (Fig. 3, C and D).
Fig. 3.
Identification of temporally distinct glycan populations during zebrafish development using two-color labeling. Zebrafish embryos metabolically labeled with Ac4GalNAz from 3 to 60 hpf were reacted with DIFO-647 between 60 and 61 hpf and then reacted with DIFO-488 either between 61 and 62 hpf [(A) to (D)] or, after an additional 1 hour of metabolic labeling with Ac4GalNAz, between 62 and 63 hpf [(E) to (I)]. Control embryos incubated with Ac4GalNAc and otherwise reacted with the same DIFO-fluorophore probes are shown in figs. S9 and S10. (A) Brightfield image of a frontal view. (B) z-projection (left panel) and x-projection (right panel) fluorescence images of the mouth region. (C) Brightfield image of a lateral view. (D) Single z-plane fluorescence image of the pectoral fin region. (E) Brightfield image of a ventral view of an embryo at 63 hpf. (F) Single z-plane fluorescence image of (E) displaying intense DIFO-488 fluorescence but not DIFO-647 fluorescence. (G) Left panel, single z-plane fluorescence image of the jaw region; middle and right panels, z-projection (middle panel) and x-projection (right panel) fluorescence images of the region highlighted in the left panel. (H) z-projection (left panel) and y-projection (right panel) fluorescence images of the mouth. (I) z-projection fluorescence image of the olfactory organ. Highlighted are the olfactory epithelium (oe) and olfactory pit (op) regions. In (B), (D), and (F) to (I), red is DIFO-647 (60 to 61 hpf) and green is DIFO-488 [61 to 62 hpf in (B) and (D) and 62 to 63 hpf in (F) to (I)]. Scale bars in (A), (C), (E), and (F), 100 μm; in (B), (D), (G) (left panel), (H), and (I), 10 μm; in (G) (middle and right panels), 5 μm.
To capture a broader spectrum of newly synthesized glycans, we expanded the period between the two DIFO-fluorophore reactions to 2 hours. Using this protocol, we observed intense labeling of the pharyngeal epidermis in the jaw region that was derived from the second reaction (DIFO-488) but not from the first (DIFO-647) (Fig. 3, E and F; fig. S10; and movie S3). In caudal regions of the pharyngeal epidermis that were labeled during both reactions, we noticed a corrugated distribution of glycans in which old glycans were restricted to peaks at the extreme ventral surface and new glycans were produced in troughs projecting dorsally (Fig. 3G and movie S4). This corrugated pattern was not observed in other regions of the animal (for example, Fig. 3H and fig. S11). Analysis of the olfactory organ also revealed a clear spatial distinction between the old and new glycans. The more recently produced glycans were predominantly localized in the olfactory pit, whereas older glycans were present in both the olfactory pit and epithelium (Fig. 3I and movie S5). The order of treatment with the two DIFO-fluorophores had no effect on the observed patterns (fig. S12).
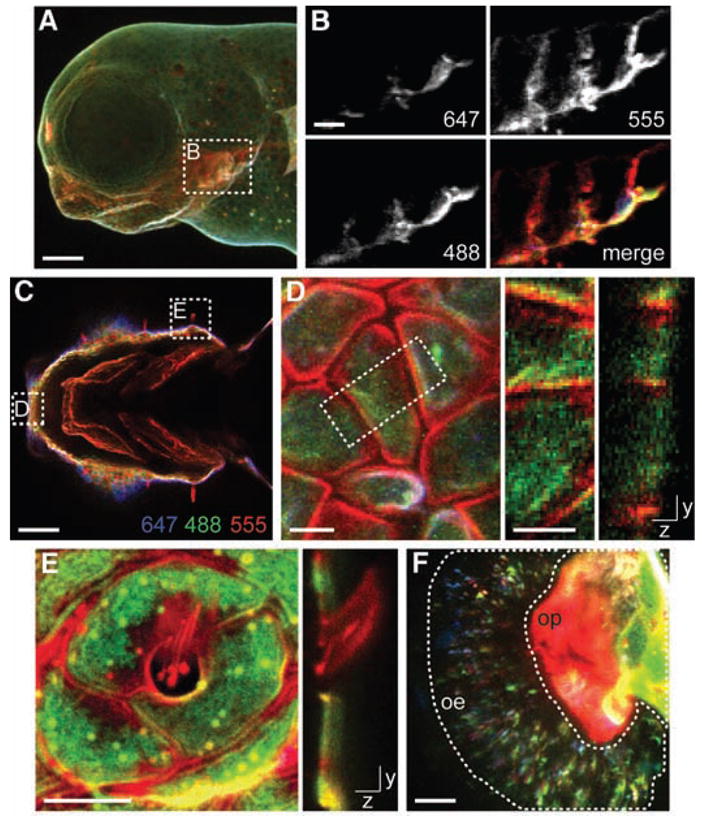
Finally, we expanded our analysis to encompass the period from 60 to 72 hpf using three DIFO-fluorophore conjugates (DIFO-647, DIFO-488, and DIFO-555; fig. S2). A population of doubly reacted embryos was generated as before but then quenched with TCEP a second time, allowed to develop for 9 hours in Ac4GalNAz, and finally labeled with DIFO-555 (fig. S7). Glycan production between 63 and 72 hpf was evident throughout the jaw region (Fig. 4, A to C, and movies S6 and S7), which was labeled robustly with DIFO-555 but minimally with DIFO-647 and -488. In contrast, cells analyzed from the extreme rostral region displayed DIFO-555 fluorescence on the cell membrane as well as intracellular DIFO-647 and -488 fluorescence derived from internalized older glycans (Fig. 4D). Additionally, the kinocilia of mechanosensory hair cells surrounding the head of the embryo displayed fluorescence from DIFO-555 but not from DIFO-647 or -488 (Fig. 4E and movie S8). In contrast, adjacent epithelial cells displayed fluorescence from all three DIFO reagents, indicating their maturation during an earlier period in development. We also observed newer, DIFO-555–labeled glycans on cilia in the olfactory pit, whereas the majority of the DIFO-647 and -488 fluorescence was localized in the olfactory epithelium (Fig. 4F, fig. S13, and movie S9). Thus, olfactory pit glycans may be rapidly degraded or released from the embryo; alternatively, glycans produced in the olfactory pit may migrate to the olfactory epithelium.
Fig. 4.

Spatiotemporal analysis of de novo glycan biosynthesis during zebra-fish development between 60 and 72 hpf. Zebrafish embryos metabolically la- beled with Ac4GalNAz from 3 to 60 hpf were reacted with DIFO-647 between 60 and 61 hpf, metabolically labeled with Ac4GalNAz for 1 hour, and reacted with DIFO-488 between 62 and 63 hpf. The embryos were metabolically labeled with Ac4GalNAz for an additional 9 hours and then reacted with DIFO-555 between 72 and 73 hpf. (A) z-projection fluorescence image of a lateral view. (B) Single z-plane fluorescence images of the region highlighted in (A). (C) Single z-planefluorescenceimage of a ventral view of the jaw region. (D) Left panel, z-projection fluorescence image of cells in the region highlighted in (C); middle and right panels, z-projection (middle panel) and x-projection (right panel) fluorescence images of the cells highlighted in the left panel (white dashed rectangle). (E) z-projection (left panel) and x-projection (right panel) fluorescence images of kinocilia. (F) z-projection fluorescence image of the olfactory organ. Highlighted are the olfactory epithelium (oe) and olfactory pit (op) regions. Blue, DIFO-647 (60 to 61 hpf); green, DIFO-488 (62 to 63 hpf); red, DIFO-555 (72 to 73 hpf). Scale bars in (A), and (C), 100 μm; in (B), 25 μm; in (D) and (F), 10 μm; in (E), 5 μm.
Metabolic labeling with Ac4GalNAz followed by detection via copper-free click chemistry revealed differences in the cell-surface expression, intracellular trafficking, and tissue distribution of glycans throughout zebrafish embryogenesis. This approach may be generalized to alternative imaging modalities and to other biomolecules (5) [for example, sialic acids can be imaged with N-azidoacetylmannosamine (fig. S14)].
Supplementary Material
Acknowledgments
We thank K. Blum, J. Codelli, E. Janus, and J. St. Hilaire for technical assistance and N. Agard, M. Boyce, P. Chang, J. Ngai, D. Raible, T. Schilling, and J. Seeliger for helpful discussions. This work was funded by grants to C.R.B. (GM058867) and S.L.A. (GM061952) from the NIH. J.M.B. was supported by NSF and National Defense Science and Engineering predoctoral fellowships.
Footnotes
Supporting Online Material
www.sciencemag.org/cgi/content/full/320/5876/664/DC1
Materials and Methods
SOM Text
References
References and Notes
- 1.Haltiwanger RS, Lowe JB. Annu Rev Biochem. 2004;73:491. doi: 10.1146/annurev.biochem.73.011303.074043. [DOI] [PubMed] [Google Scholar]
- 2.Ohtsubo K, Marth JD. Cell. 2006;126:855. doi: 10.1016/j.cell.2006.08.019. [DOI] [PubMed] [Google Scholar]
- 3.Hebert DN, Garman SC, Molinari M. Trends Cell Biol. 2005;15:364. doi: 10.1016/j.tcb.2005.05.007. [DOI] [PubMed] [Google Scholar]
- 4.Wopereis S, Lefeber DJ, Morava E, Wevers RA. Clin Chem. 2006;52:574. doi: 10.1373/clinchem.2005.063040. [DOI] [PubMed] [Google Scholar]
- 5.Prescher JA, Bertozzi CR. Nat Chem Biol. 2005;1:13. doi: 10.1038/nchembio0605-13. [DOI] [PubMed] [Google Scholar]
- 6.Prescher JA, Dube DH, Bertozzi CR. Nature. 2004;430:873. doi: 10.1038/nature02791. [DOI] [PubMed] [Google Scholar]
- 7.Chang PV, Prescher JA, Hangauer MJ, Bertozzi CR. J Am Chem Soc. 2007;129:8400. doi: 10.1021/ja070238o. [DOI] [PMC free article] [PubMed] [Google Scholar]
- 8.Beatty KE, et al. Angew Chem Int Ed. 2006;45:7364. doi: 10.1002/anie.200602114. [DOI] [PubMed] [Google Scholar]
- 9.Sawa M, et al. Proc Natl Acad Sci USA. 2006;103:12371. doi: 10.1073/pnas.0605418103. [DOI] [PMC free article] [PubMed] [Google Scholar]
- 10.Baskin JM, et al. Proc Natl Acad Sci USA. 2007;104:16793. [Google Scholar]
- 11.Kimmel CB, Ballard WW, Kimmel SR, Ullmann B, Schilling TF. Dev Dyn. 1995;203:253. doi: 10.1002/aja.1002030302. [DOI] [PubMed] [Google Scholar]
- 12.Lieschke GJ, Currie PD. Nat Rev Genet. 2007;8:353. doi: 10.1038/nrg2091. [DOI] [PubMed] [Google Scholar]
- 13.Hang HC, Yu C, Kato DL, Bertozzi CR. Proc Natl Acad Sci USA. 2003;100:14846. doi: 10.1073/pnas.2335201100. [DOI] [PMC free article] [PubMed] [Google Scholar]
- 14.Dube DH, Prescher JA, Quang CN, Bertozzi CR. Proc Natl Acad Sci USA. 2006;103:4819. doi: 10.1073/pnas.0506855103. [DOI] [PMC free article] [PubMed] [Google Scholar]
- 15.Driever W, Rangini Z. In Vitro Cell Dev Biol Anim. 1993;29:749. doi: 10.1007/BF02631432. [DOI] [PubMed] [Google Scholar]
- 16.Laughlin ST, et al. Methods Enzymol. 2006;415:230. doi: 10.1016/S0076-6879(06)15015-6. [DOI] [PubMed] [Google Scholar]
- 17.Carlsson SR, Lycksell PO, Fukuda M. Arch Biochem Biophys. 1993;304:65. doi: 10.1006/abbi.1993.1322. [DOI] [PubMed] [Google Scholar]
- 18.Yabe U, Sato C, Matsuda T, Kitajima K. J Biol Chem. 2003;278:13875. doi: 10.1074/jbc.M300458200. [DOI] [PubMed] [Google Scholar]
- 19.Clement M, Rocher J, Loirand G, Le Pendu J. J Cell Sci. 2004;117:5059. doi: 10.1242/jcs.01350. [DOI] [PubMed] [Google Scholar]
- 20.Hansen JE, et al. Glycoconj J. 1998;15:115. doi: 10.1023/a:1006960004440. [DOI] [PubMed] [Google Scholar]
- 21.Kiick KL, Saxon E, Tirrell DA, Bertozzi CR. Proc Natl Acad Sci USA. 2002;99:19. doi: 10.1073/pnas.012583299. [DOI] [PMC free article] [PubMed] [Google Scholar]
Associated Data
This section collects any data citations, data availability statements, or supplementary materials included in this article.


