Abstract
Background and Objectives
The purpose of this study was to assess the potential of polarization sensitive optical coherence tomography (PS-OCT) to non-destructively measure the depth and severity of artificial demineralization on exposed root surfaces and measure the degree of inhibition by topical fluoride. Although PS-OCT imaging studies have demonstrated the utility of PS-OCT for imaging carious lesions on enamel and dentin surfaces the influence of the cementum layer that is present on intact root surfaces has not been investigated.
Materials and Methods
In this study, extracted human tooth roots were partitioned into three sections with one partition treated with topical fluoride, one partition protected from demineralization with acid resistant varnish, and one partition exposed to a demineralization solution, producing artificial lesions approximately 200-µm deep in root dentin. The lesion depth, remaining cementum thickness and the integrated reflectivity for lesion areas was measured with PS-OCT. These measurements were also compared with more established methods of measuring demineralization, namely transverse microradiography (TMR) and polarized light microscopy (PLM)
Results
PS-OCT was able to measure a significant increase in the reflectivity between lesion areas and sound root surfaces. In contrast to dentin, the cementum layer manifests minimal reflectivity in the PS-OCT images allowing nondestructive measurement of the remaining cementum thickness. The reflectivity of the cementum layer did not increase significantly after substantial demineralization, however it did manifest considerable shrinkage in a fashion similar to dentin and that shrinkage could be measured with OCT.
Significance
This study demonstrates that PS-OCT can be used to measure demineralization non-destructively on root surfaces and assess inhibition of demineralization by anticaries agents.
Keywords: optical coherence tomography, polarization, root dentin, cementum, artificial lesions, caries inhibition, microradiography, topical fluoride
1. Introduction
Root caries is an increasing problem with our aging population1,2. It has been well established that root caries can be arrested by fluoride or chemical treatment in a similar fashion to enamel caries3. Even though lesions may cover a fairly extensive area on the root surface, they are seldom more than 0.5 to 1 mm deep3. In order to treat such lesions effectively with non-surgical approaches such as fluoride application, it is essential to have non-destructive imaging tools that are capable of assessing the severity of demineralization on root surfaces to determine if the lesion is active and progressing or if it has undergone some remineralization and has been arrested. Current (non-destructive) assessment of lesion activity is based on lesion color and texture that are difficult to quantify3. Standard quantitative methods for determining the efficacy of anti-caries agents on root surfaces are destructive and require teeth scheduled for extraction and entail partial destruction of the tooth through sectioning. These methods include microradiography, microhardness and polarized light microscopy.
Studies have shown that the outer cementum layer is significantly more acid resistant than the underlying dentin4,5. Therefore, the cementum layer is an important layer for protection against root surface caries. The loss of the cementum layer cannot easily be determined from microradiographs since cementum has a similar mineral content to dentin. Polarized light microscopy is typically used to measure the thickness of the cementum layer due to differences in birefringence however this also requires thin sectioning and destruction of the tooth.
Optical coherence tomography (OCT) is a high resolution non-destructive optical imaging technique for creating cross-sectional images of internal biological structure 6–8. OCT is an interferometric technique employing near-IR low-coherence light that is capable of imaging to depths in excess of 1–2 mm in highly scattering tissues such as human dentin and deeper in the more transparent enamel. Several studies have demonstrated the utility of using OCT to image caries lesions and subsurface defects in the tooth. Since it is non-destructive, images of subsurface lesions on intact teeth can be acquired “in vivo”. In contrast to sound enamel that is highly transparent in the near-IR, sound dentin strongly scatters light in the near-IR and is also highly birefringent which can interfere with polarization resolved imaging 21,22. Even though the penetration depth is more limited in dentin due to the higher scattering, one can still acquire images of early root caries lesions to depths greater than a mm 17,18. Demineralized dentin can be discriminated from sound dentin and cementum 16 and root fractures can be imaged from within the root canal 19,20. In OCT images, the outer cementum can be discriminated from dentin since the cementum manifests a lower reflectivity 16.
There have only been a couple of attempts to quantify the degree of demineralization on dentin and root surfaces. Amaechi et al.23 measured the % reflectivity loss due to demineralization on root surfaces and showed that this correlated well with mineral loss from microradiography. However, the validity of an approach that relies on the measurement of reflectivity loss is questionable since the reflectivity from the lesion area increases with demineralization for both enamel and dentin producing a overall net increase in reflectivity from the area of the lesion, not a decrease in reflectivity. In a more recent study 24, we demonstrated that polarization sensitive-OCT (PS-OCT) can be used to measure the depth and severity of artificially produced lesions on dentin surfaces and assess the inhibition of demineralization by topical fluoride. PS-OCT is a form of OCT that is sensitive to changes in the polarization of the reflected light 9. In PS-OCT, light is typically delivered to the tooth in one polarization and the reflected light from the tooth is measured in both polarization states. PS-OCT has been successfully used to acquire images of both artificial and natural caries lesions, assess their severity in depth, assess the remineralization of such lesions3 and determine the efficacy of chemical agents in inhibiting demineralization10. Polarization-sensitive depth-resolved reflectivity measurements can provide a measure of the severity of natural and artificial caries lesions on smooth surfaces and in the occlusal pits and fissures 11–15. The high reflectivity at the tooth surface produces a very strong reflection that can interfere with the measurement of early demineralization that is located on that surface. The magnitude of this strong reflection can be reduced using polarized light. Moreover, demineralized areas on the tooth depolarize the incident linearly polarized light and the reflectivity in the orthogonal or perpendicular polarization state to the incident polarization can be directly integrated to provide a measure of the lesion severity 13,16. We have demonstrated that there was a positive correlation between (ΔR) and (ΔZ) for lesion areas on dentin surfaces 24. In our approach the reflectivity from each layer of the lesion was measured and those values were subsequently integrated over a specific depth to yield the integrated reflectivity (ΔR) in units of dB x µm for direct comparison with the “gold standard”, the integrated mineral loss (ΔZ) that is calculated in a similar fashion by integrating the mineral loss over a given depth.
In summary, the principal objective of this study was to demonstrate that PS-OCT can be used to nondestructively measure the thickness of the cementum layer and provide a non-destructive means for quantifying the severity of artificial demineralization on tooth root surfaces and show the inhibition potential of anti-caries agents such as fluoride. The integrated reflectivity in artificial lesion areas on the root surfaces of extracted teeth that were measured with PS-OCT was compared with the well established methods of transverse microradiography and polarized light microscopy that require tooth extraction and thin sectioning.
2. Materials and methods
2.1 Sample preparation
Teeth extracted from patients in the San Francisco Bay area were collected with CHR approval, cleaned, sterilized with gamma radiation, and stored in a moist environment to preserve tissue hydration with 0.1% thymol added to prevent bacterial growth. The teeth were inspected and the roots of seventeen sound human posterior teeth were cut in half and mounted on delrin blocks with the cementum layer facing up to facilitate matching the position of the OCT scans and the sections to be cut for histology.
2.2 Simulated-caries lesions
Each sample was partitioned into three regions as shown in Fig.1. The middle partition of each sample was covered with a thin layer of acid resistant varnish, red nail polish (Revlon, New York, New York), that served to protect the sound root as the control area before exposure to the demineralization solution. The central partition served as the negative control group, protected surface, region (S). A 1.23% acidulated phosphate fluoride foam, Oral B Minute Foam (Gillette, South Boston, MA) was applied only to the left side of the sample in region (F). After allowing exposure for one minute, the samples were rinsed with deionized water, taking care not to rinse fluoride onto the untreated side of the sample. The right side served as the unprotected group, region (D). Sides of the samples were coated with varnish prior to demineralization. Samples were immersed in a demineralization solution, “surface softening model”, for seven days consisting of 45-mL aliquots of a solution composed of 2.0mmol/L calcium, 2.0mmol/L phosphate, and 0.075 mol/L acetate at pH 5.0 25,26. The samples were maintained at a constant temperature of 37°C during demineralization.
Fig. 1.
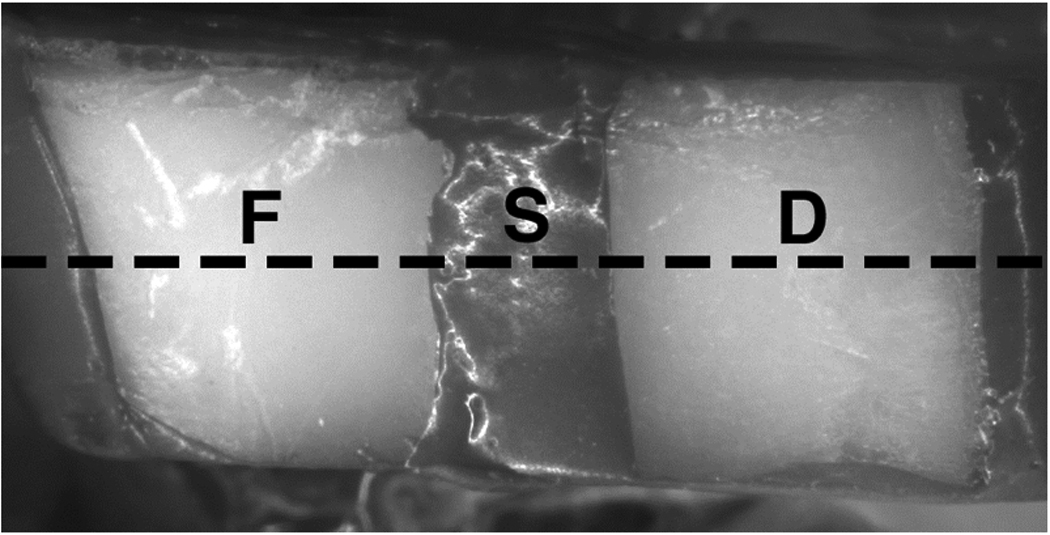
Image of sample before demineralization showing the position of the three treatment areas: topical fluoride (F), protected with varnish (S), and unprotected (D). The black dotted line marks approximate location of OCT scan, and position of sectioning for TMR and PLM.
2.3 Polarization-Sensitive Optical Coherence Tomography (PS-OCT)
A single-mode fiber autocorrelator-based Optical Coherence Domain Reflectometer (OCDR), HSR-3000-P, custom designed and fabricated by Optiphase, Inc., (Van Nuys, CA) with a polarization switching probe, high efficiency piezoelectric fiber-stretchers and two balanced InGaAs receivers was used for these studies. This OCDR was integrated with a broadband high power superluminescent diode (SLD) (Denselight, Jessup, MD) with a center wavelength of 1314-nm, an output power of 48-mW and a bandwidth of 33-nm. A high-speed XY-scanning system, ESP 300 controller & 850-HS stages, Newport (Irvine, CA) was used for lateral movement of the tooth samples at the focus of the optical probe for in vitro optical tomography. The autocorrelator-based OCDR system is described in more detail by Bush et al.28. A pair of Faraday rotators built into the probe assembly were used to switch the polarization with the sweep rate of 50-Hz. The system was configured to provide a lateral resolution of approximately 50-µm over a depth of focus of 10-mm and an axial resolution of 16–µm in dentin and cementum 27. The interferometric signal was electronically demodulated and filtered and processed using LabVIEW™ software (National Instruments, Austin TX). PS-OCT images were post-processed with a 10×10 Median filter to reduce the effect of speckle noise using image processing software, Igor Pro, (Wavemetrics, Lake Oswego, OR).
2.4 Polarized Light Microscopy (PLM)
After the samples were imaged with PS-OCT, they were cut into sections approximately 230-µm thick using an Isomet 5000 saw (Buehler, Lake Bluff, IL), for polarized light microscopy (PLM). PLM was carried out using a Meiji Techno RZT microscope (Meiji Techno Co., LTD, Saitama, Japan) with an integrated digital camera, Canon EOS Digital Rebel XT (Canon Inc., Tokyo, Japan). The sample sections were imbibed in water and examined in the brightfield mode with crossed polarizers and a red I plate with 500-nm retardation.
2.5 Transverse Microradiography (TMR)
Thin sections used in PLM were also imaged using transverse microradiography (TMR). A custom-built digital TMR system was used to measure mineral loss in the different partitions of the sample. A high-speed motion control system with Newport UTM150 and 850G stages and an ESP300 controller coupled to a video microscopy and laser targeting system was used for precise positioning of the tooth samples in the field of view of the imaging system. The volume percent mineral for each sample thin section was determined by comparison with a calibration curve of x-ray intensity versus sample thickness created using sound enamel sections of 86.3 ± 1.9% volume percent mineral varying from 50 to 300 µm in thickness. The calibration curve was validated via comparison with cross sectional microhardness measurements. The volume percent mineral determined using microradiography for section thickness ranging from 50 to 300 µm highly correlated with the volume percent mineral determined using microhardness r2 = 0.99.
2.6 Integrated reflectivity measurements with PS-OCT
The integrated reflectivity and integrated mineral loss were calculated in each area of interest on the samples. Root surfaces are curved which poses an additional challenge for matching the PS-OCT scans to the PLM and TMR thin sections. The PS-OCT images were superimposed over the PLM images using Adobe Photoshop 7.0 (Adobe, San Jose, CA) in order to match position. Line profiles of reflectivity vs. depth that were extracted from the PS-OCT images for analysis, were estimated from lines taken from the PLM images that were drawn perpendicular to the surface of the area of interest which was not effected by shrinkage.
Line profiles were taken from the orthogonal polarization (┴-axis) PS-OCT images and integrated to a real depth of 400-µm, yielding the unmodified integrated reflectivity, ΔR, of the regions in units of (dB•µm). The real depth was calculated by dividing the optical depth by the refractive index of dentin, 1.5 29. Shrinkage was significant for the TMR and PS-OCT images in the zones of demineralization. PS-OCT images showed extensive shrinkage compared to PLM images due to exposure to air. Therefore we developed an approach to adjust for shrinkage in the integrated reflectivity measurements. This correction is predicated on the assumption that the additional mineral present in the dentin lesion area due to contraction from shrinkage causes no net change in the reflectivity. This is a reasonable assumption since initial demineralization causes pores to be formed in the tissue that produce an increase in light scattering as the demineralization becomes more severe. The increase in light scattering reaches a plateau since pores merge and further demineralization does not increase the number or density of scattering sites. Therefore above a certain level of mineral loss we do not anticipate a further change in scattering/reflectivity. Shrinkage causes an overall loss in the integrated reflectivity from the lesion, since there is no reflectivity from the area lost due to shrinkage. Therefore, to correct for shrinkage we employed the following correction to ΔR: (the depth of shrinkage divided by 200-µm) multiplied by the mean reflectivity from the outer 200-µm of the lesion to yield ΔR*.
2.7 Estimated shrinkage and integrated mineral loss
We recently found that there is a positive correlation between the integrated reflectivity, ΔR, measured with PS-OCT and the integrated mineral loss, ΔZ, for dentin 24. In this study ΔZ values were calculated to a depth of 400-µm for comparison with the ΔR values calculated from PS-OCT scans. Line profile positions were estimated from predrawn lines from PLM images and those line profiles were taken from the TMR images of the thin sections cut along the same position scanned by PS-OCT. Shrinkage was calculated via comparison with the PLM images that did not manifest shrinkage using overlays of the images and image analysis software. Shrinkage also confounds measurement of the integrated mineral loss. The effect of shrinkage can be compensated for in TMR by equating the depth of shrinkage with an equivalent loss of sound dentin. Line profiles were integrated from the start of estimated shrinkage to a depth of 400-µm minus the depth of the shrinkage to ensure that the effective integrated volume was the same between zones that exhibited shrinkage and those zones that did not. This yielded the integrated mineral loss with estimated shrinkage, ΔZ*, of the regions in units of (vol.%•µm). The integrated mineral loss without estimated shrinkage, ΔZ, was also calculated.
2.8 Lesion depth and cementum thickness measurements
Lesion depths and the thickness of the cementum layer were determined from the PLM and PS-OCT images. Lesion depths were measured using the calibrated image analysis package incorporated in the Igor Pro software. It is extremely difficult to resolve subtle changes in mineral content with TMR and lesion depths tend to be much lower than lesions depths measured with PLM, which is more sensitive to small changes in mineral content. Therefore we did not attempt to estimate lesion depths from TMR. Lesion depths in PS-OCT images were taken by measuring the distance between the (1/e2) point in the lesion line profile to the point corresponding to the peak intensity30. An algorithm was used to calculate the cementum layer thickness from the PS-OCT images based on the lower reflectivity of the cementum layer vs. the underlying dentin that causes a rapid change in reflectivity at the interface. The strong reflections from the root surface and the underlying cementum-dentin junction were used to calculate the cementum thickness.
3. Results
Figure 2 shows (A) polarized light microscopy (PLM) and (B) transverse microradiography (TMR) images for a 230-µm thick section cut along the long axis (dotted line Fig. 1) of one of the samples matching the position of the (C) (┴-axis) PS-OCT image or b-scan. A transparent layer of cementum is shown on top of dentin, and it is clearly visible in all regions. The lesions are clearly visible in the untreated (D) and the fluoride (F) areas. Lesions also had pronounced dark zones at the boundaries due to “edge effects” and the non-uniform advancing front of the lesion on the 230-µm thick sample. The demineralization was most severe in the untreated areas where topical fluoride was not applied (D). PLM images show that the depth of demineralization in the fluoride treated area (F) is less than the untreated area (D) (Table I & Fig. 3).
Fig. 2.
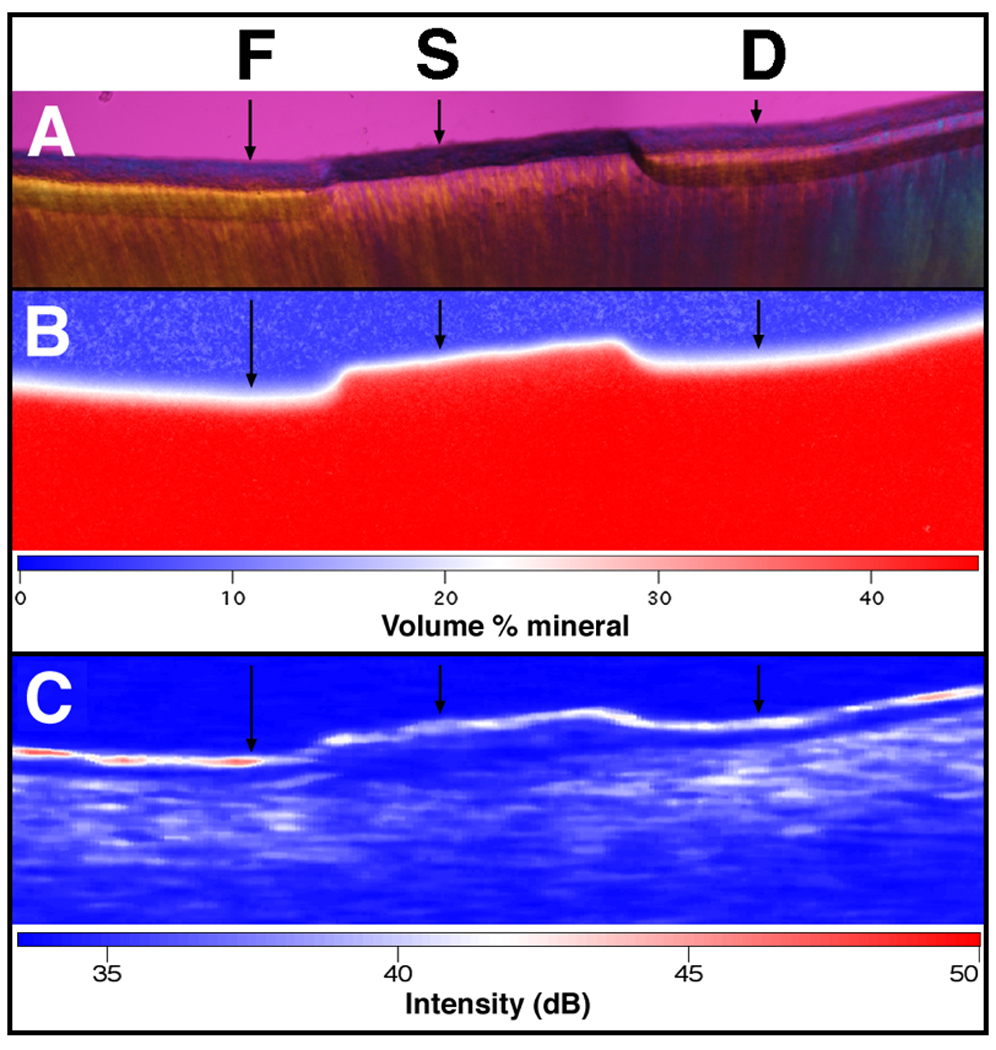
PLM, TMR, and OCT images of one of the samples after demineralization. The black arrows indicate where the analyses were performed. PLM (A) shows the lesion depth on both sides (F and D) of the sound protected area. TMR (B) and PS-OCT (┴-axis) (C) images are also shown along with the false color intensity scales. Note the shrinkage in the TMR and PS-OCT images.
Table I.
Lesion assessment from PLM, TMR, and PS-OCT analysis
| S | F | D | |
|---|---|---|---|
| PLM Lesion Depth (µm) | - | 232.0 ± 73.83 | 288.8 ±87.19 |
| PLM Cementum Thickness (µm) | 98.4 ± 35.5 | 101.1 ±40.5 | 109.1 ±62.1 |
| TMR ΔZ* (vol%•µm) | - | 2140 ±1383 | 3831 ±1521 |
| TMR ΔZ (vol%•µm) | - | 423.7 ± 909.0 | 1010 ±679.5 |
| TMR Estimated Shrinkage (µm) | - | 36.34 ± 24.58 | 65.43 ± 30.09 |
| PS-OCT ΔR* (dB•µm) | 685.6 ± 326.6 | 1176 ±473.3 | 1446 ±417.2 |
| PS-OCT ΔR (dB•µm) | 685.6 ± 326.6 | 1050 ±431.6 | 1189 ±351.9 |
| PS-OCT Lesion Depth (µm) | - | 344.2 ± 78.79 | 348.2 ± 80.50 |
| PS-OCT Cementum Thickness (µm) | - | 108.2 ±20.5 | 129.5 ±23.7 |
| PS-OCT Estimated Shrinkage (µm) | - | 42.78 ±27.19 | 71.39 ±23.04 |
With estimated shrinkage
Fig. 3.
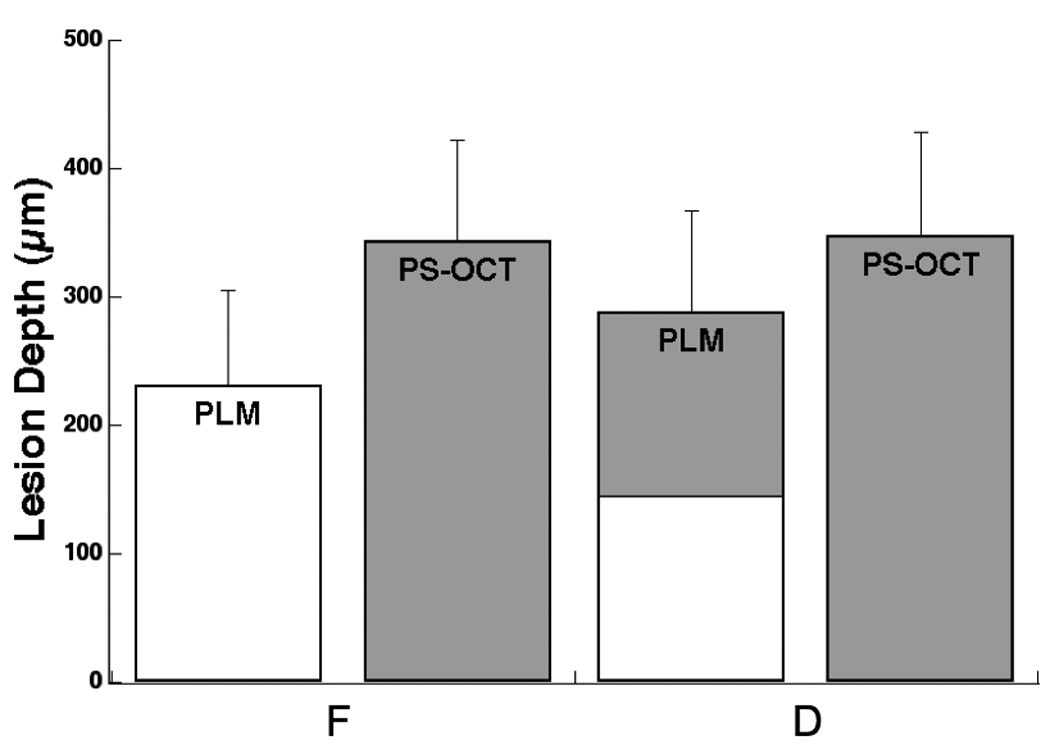
Comparison and lesion depths measured using PLM and PS-OCT (n=17). OCT lesion depth was measured by taking the point in lesion where the intensity is decreased to value of (1/e2) from the peak intensity in the lesion using Igor Pro. Bars not sharing any colors were significantly different with p<0.05.
The most notable feature in the corresponding TMR image of the same sample (Fig. 2b) is the large degree of shrinkage that is apparent in the lesion areas. Since cementum and dentin contain a high percentage of collagen, demineralized areas exhibited considerable shrinkage if not immersed in water. PS-OCT and TMR were carried out with the root samples exposed to air whereas the samples are immersed in water during PLM. As a result, there is considerable shrinkage in F and D regions in the PS-OCT and TMR images (Figure 2b & 2c) while the PLM images show minimal or no shrinkage in those regions (Figure 2a). The shrinkage from each region, fluoride treated area (F) and untreated area (D) was estimated in order to avoid underestimation of ΔZ and ΔR as described in sections 2.6 and 2.7. The shrinkage measured for the untreated area (D) was significantly higher than the fluoride treated area (F) (p<0.05) measured using both TMR and PS-OCT.
The degree of shrinkage between the fluoride (F) and unprotected (D) groups was 44% measured with TMR and 39% measured with OCT. This difference also matches the difference in the integrated mineral loss, ΔZ*, between the two groups 44%. This suggests that the amount of shrinkage is proportional to the integrated mineral loss, ΔZ*, and a plot of the shrinkage vs. ΔZ* shows a high correlation (r=0.82) between the shrinkage and the integrated mineral loss as can be seen in Fig. 4.
Fig. 4.
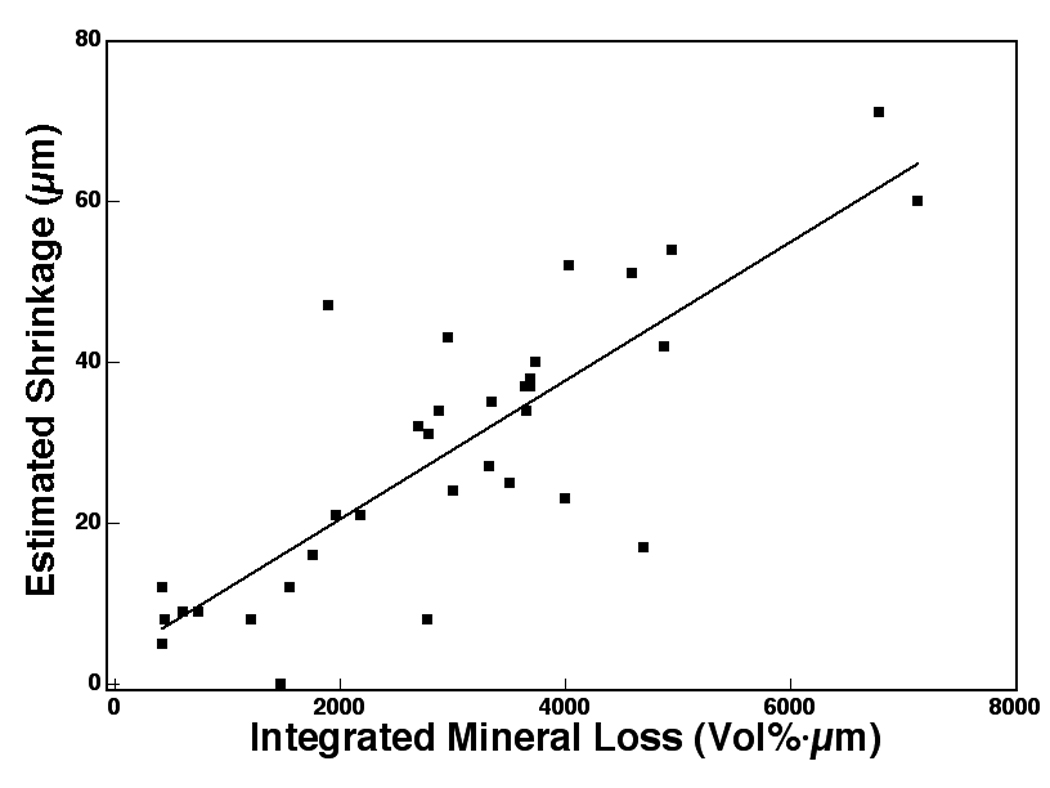
A plot of the estimated shrinkage and mineral loss measured with TMR integrated to a depth of 400µm (n=34). The corresponding linear correlation coefficient (Pearson) is 0.82.
After compensating for shrinkage, the ΔZ* of the fluoride treated area (F) was significantly lower than the ΔZ* of the untreated area (D) (p<0.05) (Fig. 5 & Table I). The integrated mineral loss without estimated shrinkage, ΔZ, was also measured and is shown in Fig. 5 & Table I. The ΔZ of fluoride treated areas (F) and of untreated areas (D) were not statistically different due to shrinkage. Shrinkage causes a dramatic reduction in ΔZ because it raises the volume% mineral in the lesion area while the zone devoid of mineral is not counted. As a result, some (ΔZ) values in the (F) regions were negative when shrinkage was not taken into account. TMR was not employed to measure the thickness of the cementum layer because it was unable to detect any differences between cementum and dentin due to the similar mineral content.
Fig. 5.
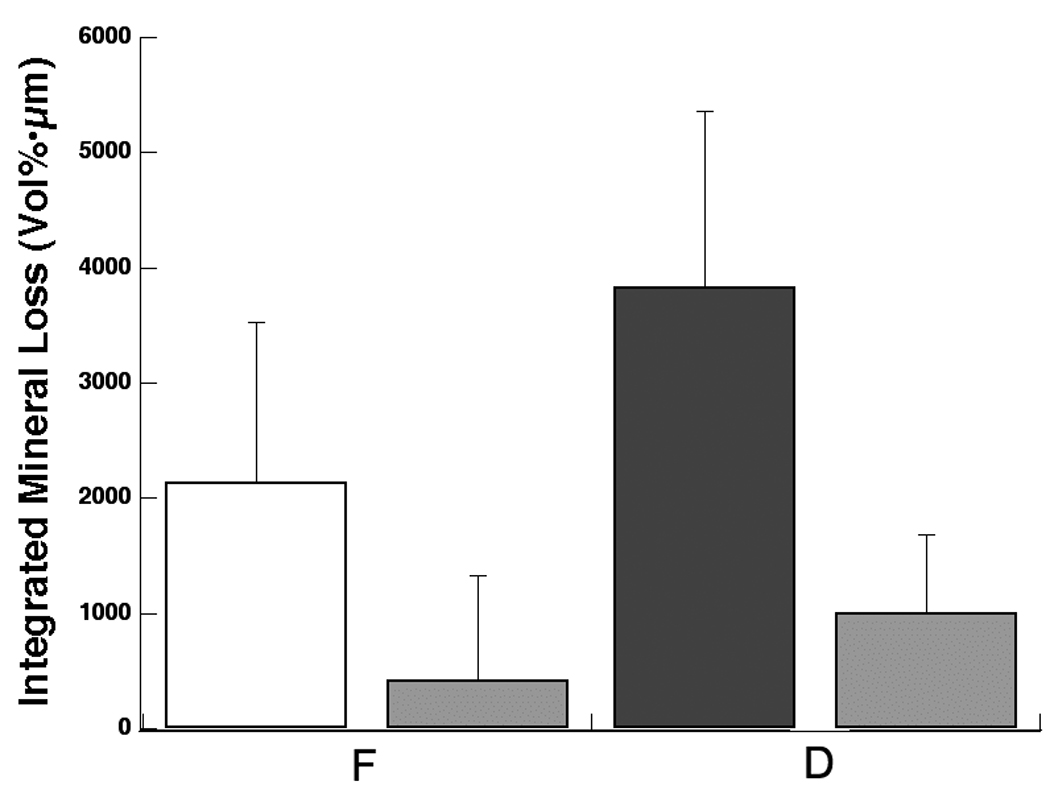
Mean ± s.d. of the integrated mineral loss integrated to a depth of 400-µm measured with TMR (n=17). Left bar in each group represents data with estimated shrinkage, ΔZ*, and the right bar in each group represents data without estimated shrinkage, ΔZ. Bars not sharing any colors were significantly different with p<0.05.
Figure 2c shows a (┴-axis) PS-OCT image or b-scan matching the corresponding section imaged through PLM. Strong areas of scattering/reflectivity, namely lesion areas appear red/white. The cementum layer is clearly visible as a transparent zone above the highly scattering dentin layer. The cementum layer was easier to distinguish from the underlying dentin in lesion areas due to the higher reflectivity of the demineralized dentin. The mean integrated reflectivity measured with PS-OCT (depth 400-µm) is tabulated in Table I. Sample groups were compared using repeated measures analysis of variance (ANOVA) with a Tukey-Kramer post hoc multiple comparison test. Having the three study groups within each sample, untreated lesion (D), sound (S), fluoride treated (F) allowed us to decrease intersample variability. InStat™ from GraphPad software (San Diego, CA) was used for statistical calculations.
The mean integrated reflectivity measured with PS-OCT for all human root samples is plotted in Fig. 6a after adjustment for shrinkage, ΔR*, and in Fig. 6b without the shrinkage adjustment, ΔR. The three groups broke statistically with the correction for shrinkage in a similar manner to the ΔZ values of Fig. 5. If the shrinkage correction was not applied only the demineralized regions (F & D) had significantly higher values of integrated reflectivity compared to the sound (S) regions (p<0.05). PS-OCT was unable to detect a significant difference between the fluoride treated regions (F) and untreated regions (D) without the shrinkage correction.
Fig. 6.
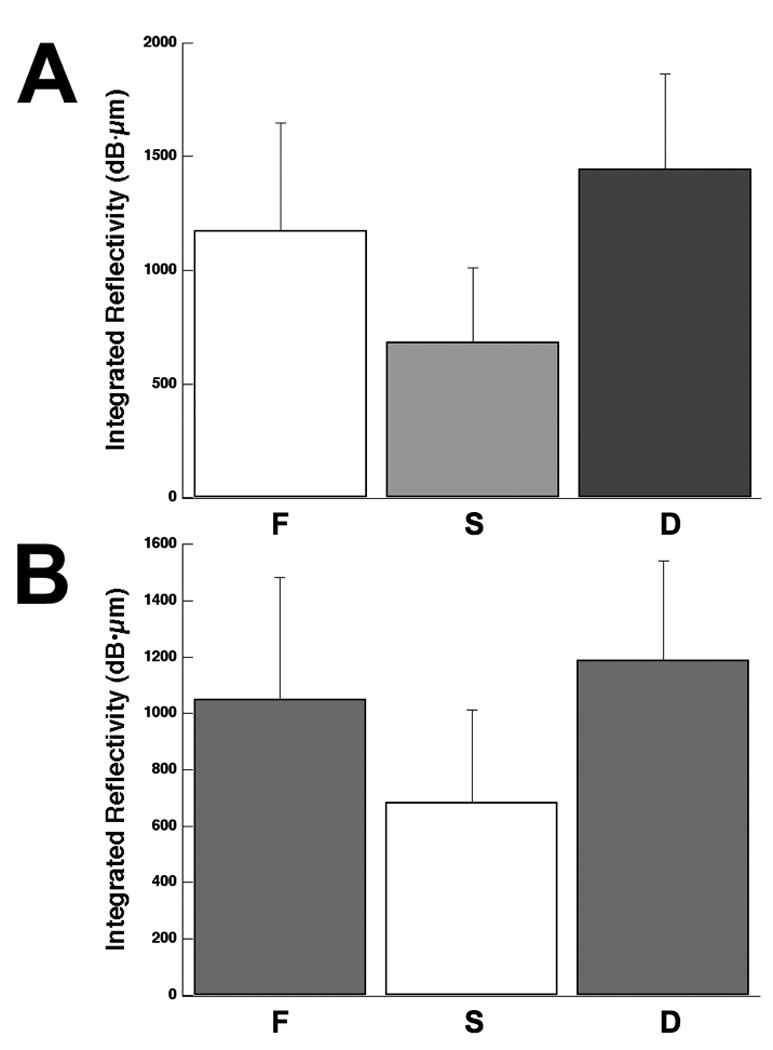
Mean ± s.d. reflectivity integrated to a depth of 400-µm measured with PS-OCT (n=17) with (A) ΔR*, and without estimated shrinkage (B) ΔR. Bars not sharing any common color were significantly different, p<0.05 (n=17).
PS-OCT lesion depths were estimated by measuring the distance between the points in OCT line profiles where the intensity has fallen to a value of (1/e2) of the peak intensity, similar to what was done in previous studies 30 and those values are shown in Fig. 3 and Table I. There was no significant difference in the lesion depth between the fluoride treated (F) and the untreated (D) areas measured using PLM and PS-OCT. The remaining thickness of the cementum layer was measured for the (F) and (D) groups using PS-OCT and PLM and they were of a statistically similar magnitude, see Table I. TMR is incapable of measuring the cementum layer thickness since the dentin and cementum have similar mineral content.
4. Discussion
The purpose of this study was to determine whether PS-OCT could be used to non-destructively assess artificial demineralization on root surfaces and image the remaining thickness of the cementum layer. Another aim was to demonstrate that PS-OCT could be used to measure the inhibition of demineralization on the surfaces of tooth roots by fluoride.
Shrinkage and the lack of optical changes in the outer transparent cementum layers after demineralization confounded analysis of lesion depth and severity. PS-OCT was capable of measuring the differences in integrated reflectivity between protected sound (S) and unprotected root regions (F & D) if adjusted for shrinkage. However, without adjusting for shrinkage, PS-OCT was not able to measure a significant difference in the integrated reflectivity between the fluoride and unprotected areas. A similar shrinkage adjustment was required for TMR in order to observe significant differences between the two groups.
The most surprising discovery in this study was the lack of optical changes in cementum as a result of demineralization. However, it has been known for some time that cementum manifests weaker birefringence than enamel and dentin and that it behaves more like a isotropic transparent material under examination with polarized light 31. The apatite crystallites are very small on the order of tens of nm and are too small to effect visible light or near-IR light and upon demineralization may not produce as dramatic a change in light scattering as is observed for dentin and enamel.
It is quite interesting how well shrinkage correlates with the integrated mineral loss, ΔZ. It may be feasible to estimate the severity of early non-cavitated root caries lesions by measuring the shrinkage in the lesion area using PS-OCT. This is easy to accomplish for in vitro studies where a stable level of hydration can be maintained, however stable hydration of the lesion may be more difficult for in vivo measurements. One approach could be to measure shrinkage before and after air drying the lesion for a fixed time period as is done for fluorescence measurements on early white spot lesions on enamel surfaces 32,33.
PS-OCT lesion depth values were slightly higher than PLM lesion depth values. These results are contradictory to expectations if one is to consider the fact that OCT images contain shrinkage whereas PLM images do not. One possible explanation is that the reflectivity of sound dentin is higher than the chosen cut-off point of (1/e2) and measurements of lesion depth using the method described above inadvertently included sound regions, resulting in an overestimate of the lesion depth.
It is interesting that PS-OCT was able to distinguish the cementum layer from dentin as well as measure the thickness of the cementum layer. The cementum layer exhibited minimal reflectivity in both orthogonal (┴) and parallel (||) axis images. Although TMR is currently the gold standard for assessing lesion severity, the similar mineral content levels of cementum and dentin made the cementum layers all but indistinguishable in TMR images. PLM and PS-OCT was superior to TMR as a tool for measuring lesion depth and cementum layer thicknesses due to the much higher sensitivity to mineral loss, however it is very difficult to get a quantitative estimate of the mineral loss from PLM.
5. Conclusion
In conclusion, PS-OCT was able to measure the differences in the integrated reflectivity between the sound and demineralized areas on root surfaces. Moreover, PS-OCT can be used to non-destructively measure the thickness of the cementum layer. This is clinically significant because the cementum layer is the first line of protection against root caries. Future studies will further investigate the influence of hydration on the reflectivity from root surfaces and dentin and will investigate improved algorithms for estimating the lesion depth in the PS-OCT images. Since PS-OCT is not destructive, and is straightforward to apply clinically, we hope to soon acquire in vivo images of natural root caries lesions to determine if the structural differences in the lesions can reveal whether those lesions are active or arrested.
Acknowledgements
The authors would like to acknowledge the support of NIH R01 grants R01-DE017869 and R01-DE14698 and the help of Saman Manesh, Dennis Hsu, Michal Staninec and John Featherstone.
Footnotes
Publisher's Disclaimer: This is a PDF file of an unedited manuscript that has been accepted for publication. As a service to our customers we are providing this early version of the manuscript. The manuscript will undergo copyediting, typesetting, and review of the resulting proof before it is published in its final citable form. Please note that during the production process errors may be discovered which could affect the content, and all legal disclaimers that apply to the journal pertain.
References
- 1.Ettinger RL. Oral Health and the Aging Population. J Am Dent Assoc. 2007;138 suppl_l:5S–6S. doi: 10.14219/jada.archive.2007.0357. [DOI] [PubMed] [Google Scholar]
- 2.Winn DM, Brunelle JA, Selwitz RH, Kaste LM, Oldakowski RJ, Kingman A, Brown LJ. Coronal and root caries in the dentition of adults in the United States, 1988–1991. J Dent Res. 1996;75:642–651. doi: 10.1177/002203459607502S04. [DOI] [PubMed] [Google Scholar]
- 3.Fejerskov O, Kidd E, editors. Dental Caries: The Disease and its Clinical Management. Oxford: Blackwell; 2003. [Google Scholar]
- 4.McIntyre JM, Featherstone JD, Fu J. Studies of dental root surface caries 2: The role of cementum in root surface caries. Aust Dent J. 2000;45(2):97–102. doi: 10.1111/j.1834-7819.2000.tb00248.x. [DOI] [PubMed] [Google Scholar]
- 5.McIntyre JM, Featherstone JD, Fu J. Studies of dental root surface caries. 1: Comparison of natural and artificial root caries lesions. Aust Dent J. 2000;45(1):24–30. doi: 10.1111/j.1834-7819.2000.tb00238.x. [DOI] [PubMed] [Google Scholar]
- 6.Huang D, Swanson EA, Lin CP, Schuman JS, Stinson WG, Chang W, Hee MR, Flotte T, Gregory K, Puliafito CA others. Optical Coherence Tomography. Science. 1991;254:1178–1181. doi: 10.1126/science.1957169. [DOI] [PMC free article] [PubMed] [Google Scholar]
- 7.Bouma BE, Tearney GJ, editors. Handbook of Optical Coherence Tomography. New York: Marcel Dekker; 2002. [Google Scholar]
- 8.Brezinski M. London: Elsevier; 2006. Optical Coherence Tomography: Principles and Applications. [Google Scholar]
- 9.Hee MR, Huang D, Swanson EA, Fujimoto JG. Polarization-sensitive low-coherence reflectometer for birefringence characterization and imaging. J. Opt. Soc. Am. B. 1992;9:903–908. [Google Scholar]
- 10.Chong SL, Darling CL, Fried D. Nondestructive measurement of the inhibition of demineralization on smooth surfaces using polarization-sensitive optical coherence tomography. Lasers Surg Med. 2007;39(5):422–427. doi: 10.1002/lsm.20506. [DOI] [PubMed] [Google Scholar]
- 11.Fried D, Xie J, Shafi S, Featherstone J, Breunig TM, Le CQ. Imaging Caries Lesions and lesion progression with Polarization Optical Coherence Tomography, Lasers in Dentistry VIII. SPIE. 2002;Vol. 4610:113–124. doi: 10.1117/1.1509752. [DOI] [PubMed] [Google Scholar]
- 12.Jones RS, Staninec M, Fried D. Imaging artificial caries under composite sealants and restorations. Journal of Biomedical Optics. 2004;9(6):1297–1304. doi: 10.1117/1.1805562. [DOI] [PubMed] [Google Scholar]
- 13.Jones RS, Darling CL, Featherstone JDB, Fried D. Imaging artificial caries on occlusal surfaces with Polarization Sensitive Optical Coherence Tomography. Caries Res. 2004;40(2):81–89. doi: 10.1159/000091052. [DOI] [PubMed] [Google Scholar]
- 14.Jones RS, Fried D. The Effect of High Index Liquids on PS-OCT Imaging of Dental Caries, Lasers in Dentistry XI. SPIE. 2005;Vol. 5687:34–41. [Google Scholar]
- 15.Ngaotheppitak P, Darling CL, Fried D. Polarization Optical Coherence Tomography for the Measuring the Severity of Caries Lesion. Lasers Surg Med. 2005;37(1):78–88. doi: 10.1002/lsm.20169. [DOI] [PubMed] [Google Scholar]
- 16.Fried D, Xie J, Shafi S, Featherstone JDB, Breunig T, Lee CQ. Early detection of dental caries and lesion progression with polarization sensitive optical coherencev tomography. J Biomed Optics. 2002;7(4):618–627. doi: 10.1117/1.1509752. [DOI] [PubMed] [Google Scholar]
- 17.Fan K, Fried D. Scanning ablation of root caries with acoustic feedback control, Lasers in Dentistry XIII. SPIE. 2007;Vol. 6425 64250J–7. [Google Scholar]
- 18.Manesh SK, Darling CL, Fried D. Imaging natural and artificial demineralization on dentin surfaces with polarization sensitive optical coherence tomography, Lasers in Dentistry XIV. SPIE. 2008;Vol. 6843 doi: 10.1117/12.778788. 68430M–7. [DOI] [PMC free article] [PubMed] [Google Scholar]
- 19.Shemesh H, van Soest G, Wu MK, van der Sluis LW, Wesselink PR. The ability of optical coherence tomography to characterize the root canal walls. J Endod. 2007;33(11):1369–1373. doi: 10.1016/j.joen.2007.06.022. [DOI] [PubMed] [Google Scholar]
- 20.Shemesh H, van Soest G, Wu MK, Wesselink PR. Diagnosis of vertical root fractures with optical coherence tomography. J Endod. 2008;34(6):739–742. doi: 10.1016/j.joen.2008.03.013. [DOI] [PubMed] [Google Scholar]
- 21.Fried D, Featherstone JDB, Glena RE, Seka W. The nature of light scattering in dental enamel and dentin at visible near-IR wave lengths. Appl. Optics. 1995;34(7):1278–1285. doi: 10.1364/AO.34.001278. [DOI] [PubMed] [Google Scholar]
- 22.Darling CL, Huynh GD, Fried D. Light Scattering Properties of Natural Artificially Demineralized Dental Enamel at 1310-nm. J Biomed. Optics. 2006;11(3):1–11. doi: 10.1117/1.2204603. 034023. [DOI] [PubMed] [Google Scholar]
- 23.Amaechi BT, Podoleanu A, Komarov G, Higham SM, Jackson DA. Optical coherence tomography for dental caries detection and analysis, Lasers in Dentistry VI. SPIE. 2002;Vol. 4610:100–108. [Google Scholar]
- 24.Manesh SK, Darling CL, Fried D. Nondestructive assessment of dentin demineralization using polarization sensitive optical coherence tomography. J Biomed Mater Res. 2008 doi: 10.1002/jbm.b.31349. submitted for publication. [DOI] [PMC free article] [PubMed] [Google Scholar]
- 25.White DJ. Use of synthetic polymer gels for artificial carious lesion preparation. Caries Res. 1987;21:228–242. doi: 10.1159/000261026. [DOI] [PubMed] [Google Scholar]
- 26.Featherstone JDB, ten Cate JM, Shariati M, Arends J. Comparison of artificial caries-like lesions by quantitative microradiography and microhardness profiles. Caries Res. 1983;17:385–391. doi: 10.1159/000260692. [DOI] [PubMed] [Google Scholar]
- 27.Ngaotheppitak P, Darling CL, Fried D, Bush J, Bell S. PS-OCT of occlusal and interproximal caries lesions viewed from occlusal surfaces, Lasers in Dentistry X. SPIE. 2006;Vol. 6137 61370L. [Google Scholar]
- 28.Bush J, Davis P, Marcus MA. All-Fiber Optic Coherence Domain Interferometric Techniques, Fiber Optic Sensor Technology II. SPIE. 2000;Vol. 4204:71–80. [Google Scholar]
- 29.Wang XJ, Milner TE, de Boer JF, Zhang Y, Pashley DH, Nelson JS. Characterization of dentin and enamel by use of optical coherence tomography. Applied Optics. 1999;38(10):2092–2096. doi: 10.1364/ao.38.002092. [DOI] [PubMed] [Google Scholar]
- 30.Can AM, Darling CL, Ho CM, Fried D. Non-destructive Assessment of Inhibition of Demineralization in Dental Enamel Irradiated by a λ=9.3-µm CO2 Laser at Ablative Irradiation Intensities with PS-OCT. Lasers in Surgery and Medicine. 2008;40:342–349. doi: 10.1002/lsm.20633. [DOI] [PubMed] [Google Scholar]
- 31.Schmidt WJ, Keil A. Polarizing Microscopy of Dental Tissues. NY: Pergamon Press; 1971. [Google Scholar]
- 32.Al-Khateeb S, Exterkate RA, de Josselin de Jong E, Angmar-Mansson B, ten Cate JM. Light-induced fluorescence studies on dehydration of incipient enamel lesions. Caries Res. 2002;36(1):25–30. doi: 10.1159/000057586. [DOI] [PubMed] [Google Scholar]
- 33.van der Veen MH, de Josselin de Jong E, Al-Kateeb S. Caries Activity Detection by Dehydration with Qualitative Light Fluorescence, Early detection of Dental caries II. Indiana University. 1999;Vol. 4:251–260. [Google Scholar]


