Abstract
Socially important visual search tasks, such as airport baggage screening and tumor detection, place observers in situations where the targets are rare and the consequences of failed detection are substantial. Recent laboratory studies have demonstrated that low target prevalence yields substantially higher miss errors compared to high prevalence conditions when the same targets appear frequently (Wolfe, Horowitz, & Kenner, 2005; Wolfe et al., 2007). Under some circumstances, this "prevalence effect" can be eliminated simply by allowing observers to correct their last response (Fleck & Mitroff, 2007). However, in three experiments involving search of realistic x-ray luggage images, we find that the prevalence effect is not eliminated either by giving observers the choice to correct a previous response or by requiring observers to confirm their responses. This prevalence effect, obtained when no trial by trial feedback was given, was smaller than the effect obtained when observers searched through the same stimuli but were given trial by trial feedback about accuracy. We suggest that low prevalence puts pressure on observers in any search task, and that the diverse symptoms of that pressure manifest themselves differently in different situations. In some relatively simple search tasks, misses may result from motor or response errors. In other more complex tasks, shifts in decision criteria appear to be an important contributor.
On a regular basis, we must search for an object, perhaps a cell phone or front door key that has been lost in the house. Or we might wish to locate that popular brand of cereal that seems to be hiding on the supermarket shelves amidst the sea of other options. In these and many other routine tasks, we can expect that the object of our search will be present most of the time; “target prevalence” is high. In contrast, in some very important visual search tasks, target prevalence is low. In airport security (Rubenstein, 2001) and medical screening tasks (Jiang et al., 2007, Gur et al., 2004; Pisano et al., 2005; Smith & Turnbull, 1997), for example, the targets (weapons or possible tumors) are very rare. Our desire to find these targets is high, but our expectation that one will be found in a specific stimulus will be low.
Recent laboratory visual search experiments have shown that miss error rates are markedly elevated at low target prevalence. Wolfe,Horowitz, and Kenner (2005) reported that an artificial search task for tools among non-tool distractors on a noisy background yielded far higher miss rates when targets were rare (0.30 miss rate when targets appeared on 1% of trials) than when they were frequent (0.07 miss rate when targets appeared on 50% of trials). Moreover, correct target absent reaction times (RTs) were much faster at 1% target prevalence than at 50%. Wolfe et al. (2007) replicated this prevalence effect using realistic x-ray airport baggage stimuli. They obtained a 0.46 miss rate at low prevalence (2% target frequency) against just 0.20 at high prevalence (50% target frequency). It is not known if these effects are found in real-world settings with trained professionals and with real consequences for errors. However, in light of the disquieting implications of these findings for real world search contexts, the prevalence effect requires further scrutiny.
What mechanisms underlie the prevalence effect? Wolfe et al. (2007) argued that high miss error rates at low prevalence are not due to a simple speed-accuracy trade off, but rather to a shift in decision criterion (c), without a decline in sensitivity (d’) (Green and Swets. 1967; Macmillan & Creelman, 2005). In fact, in Wolfe et al. (2007), d’ was somewhat higher at low prevelence than at high prevalence. It appears that, when observers expect targets to be rare, they require less information to declare a bag free of weapons. This approach is beneficial for the majority of images, but would increase the likelihood of declaring a target to be absent when a target is actually present. Similar shifts in criterion linked to changes in response probability have been demonstrated elsewhere in the signal detection literature (Healy and Kubovy 1981; Maddox, 2002). Offering a different account for the elevated miss error rates at low prevalence, Fleck and Mitroff (2007) attributed the prevalence effect to response errors caused by a bias to respond with the “absent” key even when a target was detected. Errors of this sort certainly occur in speeded two alternative forced-choice (2AFC) tasks. Not infrequently, the observer wishes he could countermand a response already headed for the wrong finger. Such errors could be easily corrected by allowing observers to voluntarily reverse previous responses. Fleck and Mitroff gave observers this option in a replication of the original Wolfe et al. (2005) experiment. Without correction, they obtained a 0.27 miss error rate at 2% prevalence compared with an 0.08 rate at 50% prevalence, demonstrating a significant prevalence effect. When provided with the opportunity to correct a response after the trial if they deemed it to be in error, Fleck and Mitroff’s observers still produced a prevalence effect of standard magnitude before correction. However, after correction, the prevalence effect was essentially eliminated. Two percent prevalence yielded a miss error of 0.10 and 50% yielded 0.04. They argued that the target-absent response in low-prevalence blocks was “pre-potent,” liable to capture behavior even when the observer was trying to make the opposite response. More generally, even without explicit feedback, Fleck and Mitroff’s observers seemed to know when they had made an error, and could correct that error if given the opportunity.
Note that motor errors are not the only route to correctable errors in experiments of this sort. Another type of error could be a form of speed-accuracy tradeoff. Observers continue to search the stimulus or some memory of the stimulus after committing themselves to an “absent” response. If they identified the target after commanding that “absent” response, they might know that an error had been made but be unable to countermand the “target-absent” response. Errors of this sort could also be eliminated by allowing observers to change their answer after the fact.
Other attempts have been made to reduce response errors in low prevalence visual search for non-luggage stimuli. Li et al. (2006), using stimuli similar to those in the Wolfe et al. (2005) study, reported that the prevalence effect was reduced by changing the response procedure from a 2AFC task to a task in which the observer had to report the total number of targets in a block of trials. In our own work (Rich et al., in press), we found that a prevalence effect could be obtained even with a very simple search for a T among Ls, if the response was a 2AFC (e.g. T points left and, very rarely, right). However, when a 4AFC response was used (e.g. the T points left, right, up or, very rarely, down) the prevalence effect was eliminated. Like Fleck and Mitroff (2007), we argued that this version of the prevalence effect was produced by something like a pre-potent motor response. In the 2AFC version, observers were responding with one key on the overwhelming majority of trials, and sometimes hit that key when they meant to hit the other, uncommon response key. In the 4AFC case, common responses were divided among three options, diluting the potency of any one response.
In more difficult search tasks, however, the prevalence effect has proved more stubborn. Fleck and Mitroff (2007) used stimuli similar to those in Wolfe et al. (2005) in their correction paradigm. In a subsequent study, we also attempted to eliminate errors due to overly hasty responses (Wolfe et al., 2007). This experiment used x-ray luggage stimuli in a closer visual approximation of the baggage-screening task. This is a more difficult search task which produces false alarm errors as well as miss errors. False alarm errors decline at low prevelance (consistent with criterion shift, as noted above). Using these stimuli, we found that forcing our observers to slow down did not eliminate the prevalence effect.
Another important factor is the role of feedback. In our previous work, we provided trial-by-trial feedback about accuracy. Fleck and Mitroff (2007) replicated that result without providing feedback to the observers. The prevalence effect they obtained, however, was eliminated when observers were allowed to correct responses. Even without explicit feedback, Fleck and Mitroff’s observers often knew when they had made an error and were able to correct it.
The most pressing practical question is whether a prevalence effect is likely to occur in socially important search tasks like medical screening and airport security. In those contexts, the search task is hard, feedback is not reliable, and task demands make motor / response errors extremely unlikely. No one at an airport checkpoint is going to say to himself “Oh dear, I saw a gun in that bag, but I pushed the wrong button, so I will have to let it go.” Thus, if prevalence errors are motor/response errors, then they are probably not an important contribution to errors at the airport or in the radiology suite. Conversely, if one wants to argue that prevalence effects might be a real-world problem, then it must be possible to show such effects in a task without feedback and with an opportunity to correct errors. That is what we show in the present experiments. Following Fleck and Mitroff (2007), we eliminate feedback and allow for correction (in different ways in Experiments 1a and 2). We apply these methods to the search of x-ray images of baggage as in Wolfe et al., (2007). We conducted three experiments implementing response correction paradigms, with the goal of eliminating miss errors. In the first two, we apply Fleck and Mitroff’s voluntary correction system to our simulated luggage-screening task. In the third, we employ a somewhat different, compulsory correction system in which observers are required to respond twice to the same display. To anticipate our results, with these stimuli, the prevalence effect is smaller without feedback. However, that effect persists even when observers are allowed to correct their responses.
Experiment 1a: Voluntary Correction Paradigm: a second chance to respond
If the prevalence effect is due to response errors when targets are rare, then allowing observers to correct their responses should equalize miss rates at low and high prevalence. Experiment 1a tests this hypothesis by applying Fleck and Mitroff’s (2007) paradigm to the simulated luggage stimuli of Wolfe et al. (2007).
Method
Observers
Sixteen adults (ages 19–53, Mean=32.3 years, SD=10.8 years, 9 women, 7 men) were recruited from the Boston area to participate. No observer reported a history of eye or muscle disorders. All were screened for color blindness and normal visual acuity. Informed consent was obtained from all observers and each was paid $10/hr for his/her time.
Stimuli and Procedure
Observers participated in a laboratory-simulated airport luggage-screening task (see Wolfe et. al, 2007 for more details). Stimuli consisted of JPEG X-ray images of empty bags combined with X-ray images of a variety of non-weapon objects (e.g., clothes, toys, containers) and weapons (there were 100 images of knives and 100 images of guns). All X-ray images were obtained from the Department of Homeland Security’s Transportation Security Laboratory (Figure 1). Each bag had a set size of 3, 6, 12, or 18 total items, plus a number of clothing objects which add a pale orange cast to the image but do not appear as distinct items. Objects were placed at random throughout the bags and could overlap. The bags and contents were sized realistically (e.g., sunglasses were larger than paperclips). In bags containing a target weapon, only a single target was ever present. Stimuli were generated and presented using Matlab 7.5 and the Psychophysics Toolbox (Brainard, 1997; Pelli, 1997) running on Macintosh G4 computers. At a viewing distance of 57 cm, bags varied in size from 9.5 degrees of visual angle (°) in height by 16° in width to 20° by 21.5°. The resulting images and screening circumstances, though not perfect, are valid approximations of those presented to security personnel at the airport.
Figure 1.
Sample bag display, set size 12, target absent
Before the screening task, observers were shown 20 examples of potential target weapons for one second each isolated from the bags, and told to expect weapons to appear at a variety of angles and perspectives. Each trial began with a fixation cross and an audible ‘click,’ followed after 200 ms by the appearance of the stimulus, which remained visible until the observer responded. A 500 ms blank interval preceded the start of the next trial. Observers were instructed to indicate as quickly and accurately as possible whether a target was present or absent (they pressed one key for “target present” and a different key for “target absent”). We emphasized that finding weapons was the most important goal of the task, but instructed observers to keep in mind the real world need to move people through the security checkpoint quickly.
Following Fleck and Mitroff (2007), observers had the option to correct a response to the previous trial. After the observer had responded to trial n, following the 500 ms blank inter-trial interval, the display for trial n+1 was presented. At this point, with the display for trial n no longer visible, the observer had the option of reversing their response to trial n by pressing the ‘esc’ button on the keyboard (i.e. if the initial response was “absent,” the ‘esc’ button would change it to “present,” and vice versa). Upon hitting the ‘esc’ key, observers would see a message saying, “You have reversed the prior response, now respond to this trial,” and could then respond to the currently visible trial n+1. To be clear, observers could only reverse the previous response, not re-examine the previous display. No feedback about response accuracy was given at any point during the trials (before or after correction). Note that Fleck and Mitroff also ran a condition in which observers did not have the option to correct previous responses. However. since they found that miss rates for observers not given a correction option were comparable to miss rates prior to correction for those with the correction option, we decided that a no-correction condition would be redundant.
Each observer was given 100 practice trials at 50% prevalence (yielding 50 target present trials), and then tested for 200 experimental trials at 50% prevalence (100 target present trials) and 1000 experimental trials at 2% prevalence (20 target present trials). Experimental block order was counterbalanced across observers. Prior to each block, observers were informed about the rarity of targets: for high prevalence, they were told targets would be “frequent” and for low prevalence, targets would be “rare.” A 2-minute break was enforced every 200 trials.
Results
In all experiments, we removed all RTs > 10,000 ms or < 200 ms as outliers. Error rates were arcsine transformed before analysis; we report the back-transformed means. ANOVAs and t-tests were conducted in SPSS 11 for MacOS X. We report partial eta-squared (η̂2) as a measure of effect size for ANOVAs (included factors of prevalence (50% or 2%), correction (before or after), and experimental block order (50% or 2% first) unless otherwise specified). Levene’s Test of Equality of Error Variances was used to determine equality of variance (for between-subjects comparisons) and corrections were made for statistical reporting where appropriate. After RT filtering, only 1.1% of trials were removed from Experiment 1a. Analyses were collapsed across set size due to the sparse number of target present trials at each set size at low prevalence.
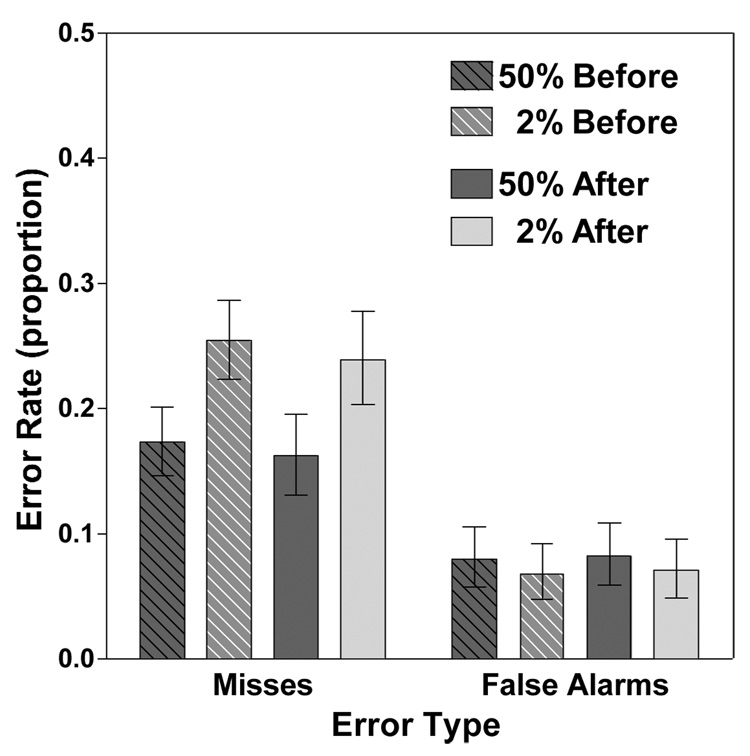
The central finding of interest is that the correction paradigm fails to eliminate the prevalence effect (Figure 2). Low prevalence produced more miss errors than high prevalence (F(1, 14)=17.908, p<0.01,η ^2 = 0.56). Correction lowered miss errors reliably, albeit very modestly in practical terms by about 0.02 at low prevalence and 0.01 at high prevalence (F(1, 14)=23.663, p<0.001,η ^2 = 0.63). Experimental block order did not significantly affect miss rate (F < 2.0, p > 0.15). There were no significant interactions. Paired samples t-tests were used to confirm the prevalence effect. The high prevalence miss rate before correction was 0.17, significantly lower than the 0.26 low prevalence miss rate before correction (t(15)=4.745, p<0.001). Critically, the situation was essentially unchanged after correction. The high prevalence miss rate after correction was 0.16, lower than the 0.24 low prevalence miss rate after correction (t(15)=3.351, p<0.01). Thus, a significant prevalence effect was present before and after correction.
Figure 2.
Mean error rates (misses and false alarms) for high (50%) and low (2%) prevalence. Error bars represent within-subject 95% confidence intervals.
As noted, the improvement with correction is marginal. At low prevalence, the numerically greatest number of changes were the 52 changes (out of 71 total changes) from correct absent responses to false alarm errors, though those 52 are a tiny fraction of the over 14,000 target absent trials. Just 8 (9.2%) of the 87 low prevalence misses were corrected to hits. At high prevalence, 17 (5.9%) out of 287 misses were corrected. Only 5 (0.4%) correct absent responses became false alarms after correction.
Although Wolfe et al. (2007) found higher false alarms at high prevalence than low prevalence, the current experiment did not show such a difference (F < 0.60, p > 0.40). This might be due to the fact that Wolfe et al. (2007) provided response feedback, whereas the current experiment presents no feedback and thus more uncertainty, potentially leading to more false alarms at low prevalence. Correction increased false alarm rate (F(1, 14)=6.946, p<0.05,η ^2 = 0.33), however experimental block order did not have any such effect (F < 0.001, p > 0.95). There were no significant two or three-way interactions.
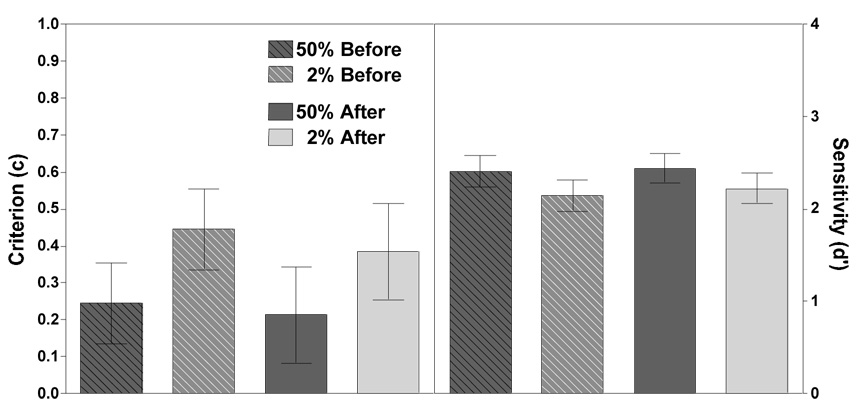
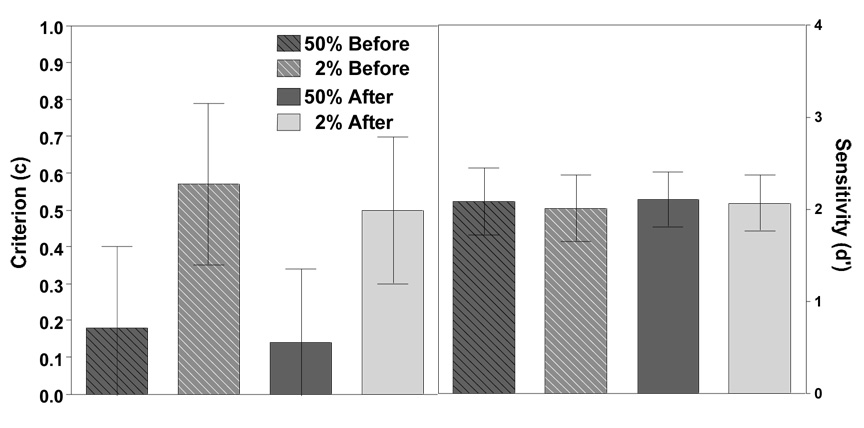
Wolfe et al., (2007) found that the prevalence effect manifested as a criterion shift. Figure 3 shows a similar result in this experiment. Criterion values were lower at high prevalence (F(1, 14)=7.146, p<0.05,η ^2 = 0.34), and slightly lower after correction (F(1, 14)=29.774, p<0.0001,η ^2 = 0.68). There was no main effect of experimental block order on criterion (F < 0.65, p > 0.40), but there was a significant 2-way interaction between prevalence and experimental block order (F(1, 14)=4.666, p<0.05,η ^2 = 0.25) reflecting the fact that there was a reliable criterion shift when observers completed the high prevalence block followed by the low prevalence block, but not vice versa.
Figure 3.
Mean criterion (c, left panel) and sensitivity (d', right panel) for high and low prevalence. Error bars represent within-subject 95% confidence intervals.
Wolfe et al., (2007) reported that sensitivity did not change as a function of prevalence. In this experiment, there was a modest but reliable decrease in d’ at low prevalence (see Figure 3, right panel) (F(1, 14)=5.156, p<0.05,η ^2 = 0.27), and a modest increase in d' after correction (F(1, 14)=10.579, p<0.01,η ^2 = 0.43). There was no main effect of experimental block order (F < 0.90, p > 0.35). There was a significant 2-way interaction between correction and experimental block order (F(1, 14)=5.018, p<0.05,η ^2 = 0.26) where correction increases d’ only in observers who completed the low prevalence block followed by the high prevalence block and not visa versa.
In order to confirm that task duration and issues of fatigue and sustained attention are not major confounds in our data, we broke down the low prevalence portion of the task into 250-trial quartiles and analyzed whether miss error increases significantly as the task progresses. While alertness might plausibly play some role in miss errors, a repeated measures ANOVA on low prevalence miss rate with factors of quartile, correction, and experimental block order shows no reliable evidence that performance gets worse as task progresses (F < 2.7, p > 0.05). There were also no significant interactions. Of course, there could be an effect too small for this analysis to detect but it would have to be quite small. Moreover, Wolfe et al. (2007) showed that a vigilance task, inserted at various times throughout a low prevalence block, produced RTs that remained constant from beginning to end, suggesting that time-on-task is not the main cause of errors.
The prevalence effect certainly has some important similarities to target frequency effects in the vigilance literature (Baddeley & Colquhoun, 1969; Colquhoun & Baddeley, 1967; Mackworth & Taylor, 1963). However, as discussed more extensively in Wolfe et al, (2007), prevalence effects are not just vigilance effects by another name as shown by the failure to find an effect of time-on-task in the present experiments.
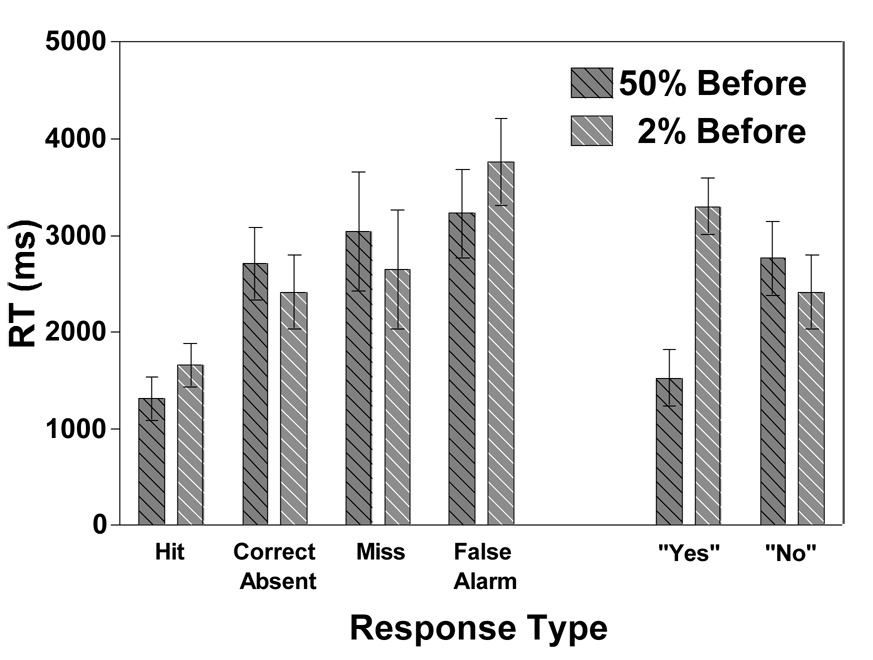
Turning to reaction time (RT) data for before correction responses only (after correction RTs are not useful due to a programming error), there is the usual main effect of response type (“yes” or “no”) demonstrating that “yes” responses are faster than “no” responses (F(1, 14)=26.355, p<0.001,η ^2 = 0.65). When present and absent trials are taken together, there is no main effect of prevalence (F < 4.0, p > 0.05) or experimental block order (F < 0.10, p > 0.75). However, there is an interation between prevalence and response type. This replicates Wolfe et al. (2005)’s finding that “no” responses are faster than “yes” responses at low prevalence while the opposite is true at high prevalence (F(1, 14)=69.656, p<0.000001,η ^2 = 0.83). Moreover, there is an interaction between response type and expeirmental block order showing that “yes” responses are faster than “no” responses, but only in the group that did the low prevalence condition followed by the high prevalence condition (F(1, 14)=9.306, p<0.01, η ^2= 0.40).
If RTs are divided into the four possible response types (hit, correct absent, miss, and false alarm), there are no main effects of prevalence (F < 0.10, p > 0.75), or experimental block order (F < 0.25, p > 0.65), but there is a significant effect of response type (F(2.36, 39)=39.109, p<0.00000000001, η ^2= 0.75). Prevalence and experimental block order interact marginally (F(1, 13)=4.634, p=0.051,η ^2 = 0.26) demonstrating that high prevalence RTs are faster than low prevalence ones, but only in the group who completed the low prevalence block first. Prevalence also interacts with response type indicating that hit RTs at low prevalence are slower than those at high prevalence, but RTs are comparable at both prevalence levels in the other 3 response types (F(2.45, 39)=4.175, p<0.05,η ^2 = 0.24). Finally, low prevalence correct absent and miss responses are comparable (t < 1.2, p > 0.25).
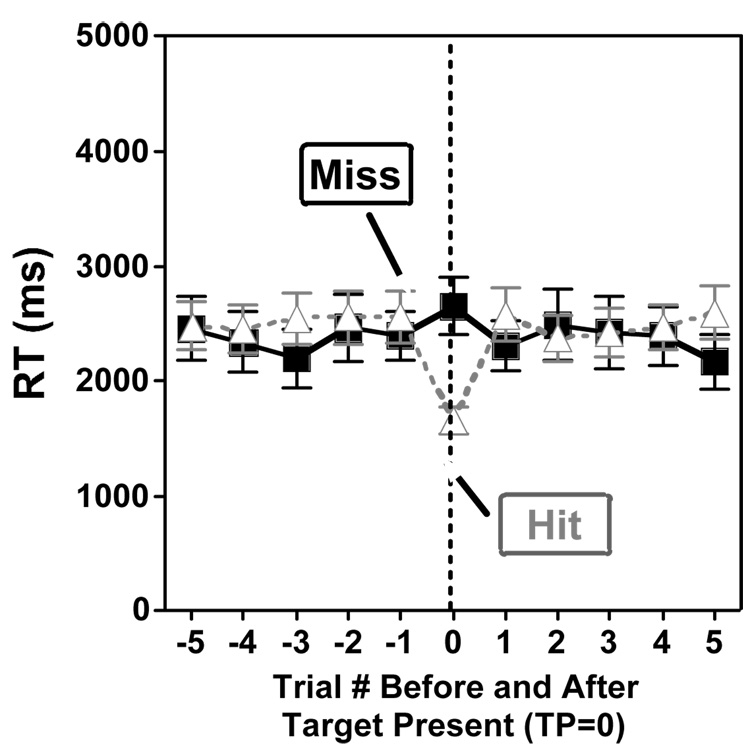
In our prior studies, where Os received feedback after each trial, RT was slowed after miss errors. In the present study, Os did not recieve feedback. However, if they committed an error and realized that they had committed that error, we might expect slowing on the next trial. Figure Five shows average before correction RT for five trials before and after target present trials in the low prevalence condition (so essentially all of the surrounding trials are target-absent trials). It is clear that there is no slowing after a miss trial (F < 0.01, p > 0.90). As noted above, the majority of errors were not corrected, and so this RT data reflects the fact that observers were, on the whole not, cognizant of their mistakes. RTs for trials prior to a miss were on average 150 ms faster than response times for trials preceding hits, but this difference is not significant (F < 2.1, p > 0.15). The deviant RT in the figure is the “hit” RT and that merely reflects that fact that target-present RTs are generally faster than target-absent.
Figure Five.
Low prevalence reaction times before and after misses (black) and hits (gray) for trials where observers did not correct responses. Negative numbers on the x-axis denote trials preceding a target present trial (0), and positive numbers indicate trials following the target. Error bars represent SEMs.
Discussion
In this experiment, the option to correct a previous response once a search display has disappeared did not eliminate the prevalence effect. As one might expect, when observers are offered the option of correcting a hasty, erroneous response, they do so and make some modest gains in accuracy/sensitivity. However, in this experiment, a very small proportion of miss errors were corrected. Indeed, when targets were rare, the majority of reversals changed correct target absent responses to false alarms errors. Observers’ failure to correct miss errors in this task suggests that the prevalence effect in this experiment is not caused by response errors like those proposed by Fleck and Mitroff to account for their data. This does not make one result correct and the other result wrong. Instead, it supports the idea that prevalence effects manifest themselves differently in different tasks. With relatively easy tasks (meaning those that tend not to produce false alarm errors as in of Rich et al., in press and, perhaps, Fleck and Mitroff, 2007, and Wolfe et al., 2005), low prevalence miss errors may well be due to motor errors with observers making a speeded prepotent “no” response even when they know that the correct response is “yes”. With the more difficult task used here, low prevalence manifests itself through a criterion shift.
Could it be that Os make more mistakes at low prevalence because they have less experience with the targets? Were this the case, Os who did the high prevalence block first should show less of a prevalence effect but no reliable effect of this sort appears in the data.
It is useful to compare the current results to those from very similar experiments in Wolfe et al. (2007). Wolfe et al. (2007) reported much larger criterion effects than we obtained here. For example, in Experiment 2 of that paper, low prevalence shifted c by about 1 unit (from about 1.0 at low prevalence to 0.0 for high prevalence). In the current experiment, the difference was only about 0.2 units (0.45 for low prevalence and 0.25 for high). Correction did not alter this difference (0.38 to 0.21). We suspect that the lack of feedback is the critical variable. Observers use feedback, explicit or implicit, to set decision criteria in search (Chun & Wolfe, 1996). In tasks like our baggage task, in the absence of explicit feedback, observers appear to move to a moderately conservative criterion in both the low and high prevalence conditions. Low prevalence still presses observers to a more conservative criterion, but not as dramatically. We will return to this topic in the General Discussion.
Experiment 1b: Replication with target preview
Experiment 1a demonstrated a prevalence effect with a realistic x-ray luggage screening task that remained largely immune to correction. We did not have the proper experimental set up and statistical power to investigate the effect of prior experience on performance in Experiment 1a. Observers varied diversely in their prior experience with this task, some of them having been in other experiments in the lab. Experiment 1b replicates Experiment 1a with more control over observers’ prior experience and more training with the actual targets in this study.
Method
Observers
Ten adults (ages 19–51, Mean=27 years, SD=11 years, 7 women, 3 men) were recruited from the Boston area to participate. No observer reported a history of eye or muscle disorders and all were screened for color blindness and normal visual acuity. Informed consent was obtained from all observers and each was paid $10/hr for his/her time. Importantly for present purposes, none of the observers had participated in a previous prevalence experiment in the laboratory.
Stimuli and Procedure
The stimuli and procedure in the presesnt experiment are identical to those of Experiment 1a, with the following improvements. First, as noted, the observers had no prior experience in our lab with prevalence experiments. Secondly, observers were shown a slide show of the target guns and knives isolated on the screen for two seconds each. Finally, we made a minor improvement to the stimulus set by removing 28 target present bag displays (out of the original 985) which contained targets deemed to be unrealistically positioned within the luggage.
Results and Discussion
Error rates are shown in Figure Six. RT filtering and statistical analysis were the same as in Experiment 1a. RT filtering removed 3.6% of trials as too long (>10,000 ms).
Figure Six.
Mean error rates (misses and false alarms) for high (50%) and low (2%) prevalence. Error bars represent within-subject 95% confidence intervals.
The data replicate the prevalence effect demonstrated in Experiment 1a. Miss errors were significantly higher at low prevalence than high prevalence (F(1, 8)=9.406, p<0.05,η ^2 = 0.54), and this is confirmed both before (t(9)=2.588, p<0.05) and after (t(9)=2.875, p<0.05) correction. Correcting a previous response also reliably reduced miss rate (F(1, 8)=14.295, p<0.01,η ^2 = 0.64), but as in Experiment 1a, this only amounts to a 0.02 reduction at high prevalence and about a 0.04 reduction at low prevalence. Similar to Experiment 1a, only 7 out of the 67 misses (10.5%) at low prevalence were reversed to a hit, while 54 of the 79 total changes (68.4%) reversed a correct absent to a false alarm. There was no effect of experimental block order (F < 0.60, p > 0.45), nor were there any significant interactions.
Just as in Experiment 1a, false alarm rates were not significantly different at low and high prevalence (F < 4.4, p > 0.05) though the direction is consistent with prior results. False alarms go down as miss errors go up. Correction (F < 1.5, p > 0.25) and experimental block order (F < 0.25, p > 0.65) did not affect false alarm rate. There were no significant interactions.
Once again, as shown in Figure Seven, the data support a criterion shift account of the prevalence effect with these stimuli (F(1, 8)=9.376, p<0.05,η ^2 = 0.54). The prevalence-related criterion shift manifests itself both before (t(9)=2.734, p<0.05) and after (t(9)=2.833, p<0.05) correction even though criterion is more liberal after correction (F(1, 8)=8.793, p<0.05,η ^2 = 0.52). There was no main effect of experimental block order (F < 0.05, p > 0.85), nor were there any significant two way interactions. There was, however, a significant three-way interaction (F(1, 8)=5.519, p<0.05,η ^2 = 0.41). Apparently, in the group that completed the high prevalence condition first, correction shifted criterion more at low prevalence than high prevalence while in the group that completed the low prevalence condition first, correction shifted criterion more at high prevalence than low prevalence. (Interpretation of this interaction is left as an exercise for the reader.)
Figure Seven.
Criterion (c, left panel) and sensitivity (d’, right panel) for high and low prevalence. Error bars represent within-subject 95% confidence intervals.
Consistent with Wolfe et al. (2007) prevalence did not significantly affect sensitivity in this experiment (F < 0.10, p > 0.75). Correcting a previous response, however, increased d’ modestly but reliably (F(1, 8)=7.731, p<0.05,η ^2 = 0.49). Experimental block order did not reliably affect sensitivity (F < 0.75, p > 0.40) and there were no interactions.
Checking once again that task duration is not the primary cause of the higher miss rate at low prevalence, the data was analyzed by 250-trial quartiles (ANOVA with factors of quartile, correction, and experimental block order). As in Experiment 1a, miss rate did not increase reliably at low prevalence as the task progressed (F < 1.8, p > 0.15). There were no significant interactions.
The pattern of RT data was essentially the same as in Experiment One and is omitted in the interest of space.
Experiment 1b replicates the results of Experiment 1a. This strengthens the argument that the prevalence effect in this task is not eliminated when observers can correct their answers. Pre-exposure to every target makes it less likely that the prevalence effect is due to unfamiliarity with the target items.
Experiment 2: Compulsory Correction
Given the very modest effects of allowing observers to voluntarily correct errors, it seemed advisable to force observers to make a second, confirming or correcting response on every trial. That was the purpose of Experiment 2.
Method
Observers
Sixteen adults (ages 18–53, Mean=33.6 years, SD=11.1 years, 8 women, 8 men) were recruited from the Boston area to participate. No observer reported a history of eye or muscle disorders and all were screened for color blindness and normal visual acuity. Informed consent was obtained from all observers and each was paid $10/hr for his/her time. Ten of the observers in this experiment also participated in Experiment 1a (time between experiments spanned from a day to a month; four did Experiment 1a first, six did Experiment 2 first).
Stimuli and Procedure
The stimuli, search task, and blocks were identical to those of Experiment 1a. Experiment 2, however, drew images from only one set of stimuli (2,012 possible target absent and 989 target present bag displays), whereas Experiment 1a drew images from two stimulus sets (half of the observers searched stimuli drawn from the set used in Experiment 2, and the other half searched through a different set of 2,015 target absent and 985 target present displays; there was no difference between the two sets in terms of performance). In Experiment 2, observers were required to make two responses to each image display: an initial response and a confirmation. Once a display appeared, observers searched and then pressed either the “target present” or “target absent” button on the keyboard. After initial response, observers saw the message, “Please either confirm or change your response.” Observers then pressed the same button as their initial response if they wanted to confirm their first decision, or pressed the other key if they wanted to change their original decision. Observers then saw the message, “Thanks,” and moved on to the next trial. The search display remained visible during the whole response process, allowing observers to continue searching after the initial response. Observers received no response feedback during the task.
Results and Discussion
RT filtering and statistical analysis were the same as in Experiment 1a. RT filtering removed 2.2% of trials as too long (>10,000 ms). Unless specified otherwise, ANOVAs include factors of prevalence, confirmation, and experimental block order.
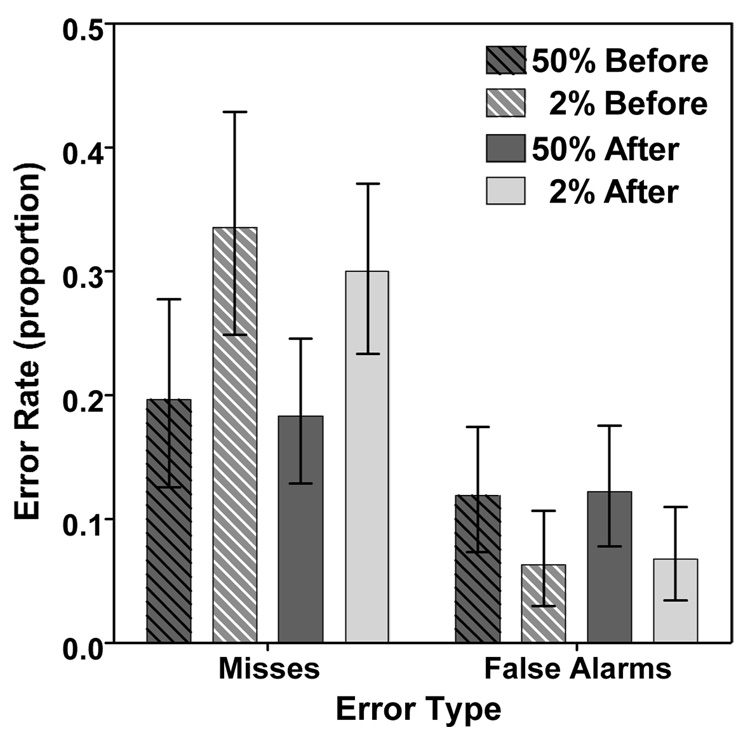
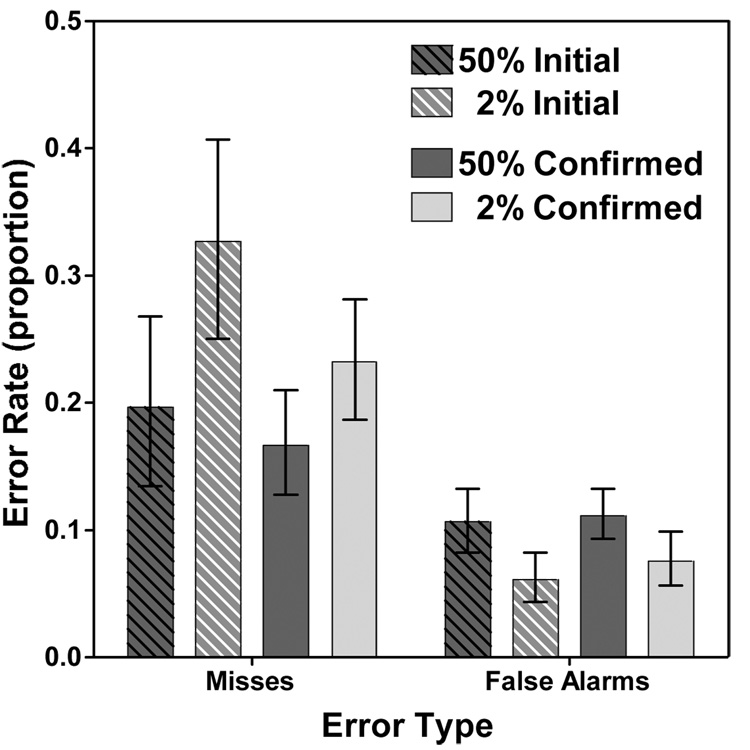
Error data are shown in Figure 4. There was a significant prevalence effect as shown by the greater proprotion of miss errors at low prevalence (F(1, 14)=8.378, p<0.05,η ^2 = 0.37). There were fewer miss errors on the second response than on the the first (F(1, 14)=13.902, p<0.01, η ^2 = 0.50). Note that observers could continue to search the display during the interval between first and second response so a reduction in miss errors is not hugely surprising. Importantly, even though the miss rates were reduced, a significant prevalence effect was seen in the second responses. The 0.23 miss rate after the second response in the low prevalence condition was significantly higher than the 0.17 miss rate on the second response in the high prevalence condition (t(15)=2.219, p<0.05). There was no main effect of experimental block order (F < 0.01, p > 0.90), nor were there any significant interactions
Figure Four.
Reaction time broken down by response type and prevalence for before correction performance. On the left, RT is broken down by target presence and response, whereas the right breaks it down only by participant response. Error bars represent within-subject 95% confidence intervals.
As before, false alarms decrease as misses increase. There were more false alarms at high prevalence (F(1, 14)=7.734, p<0.05, η ^2 = 0.36), and more false alarms on the second response (F(1, 14)=14.414, p<0.01, η ^2 = 0.51). Experimental block order, however, did not affect false alarm rate (F < 0.60, p > 0.45). There was a reliable interaction between prevalence and confirmation, indicating that false alarm rates were higher on the second response only under low prevalence conditions (F(1, 14)=7.382, p<0.05, η ^2 = 0.35). Other interactions were not significant.
In this experiment, the requirement to confirm responses allowed observers to improve their overall accuracy by 9.4% at low prevalence (t(15)=3.022, p<0.01) and 3% at high prevalence (t(15)=3.337, p<0.01). At low prevalence, because absent trials were so common, 81% of all 306 changes were from correct absent responses to false alarms. Note that these correct response to false alarm changes represent only 1.7% of the target absent trials but because the vast majority of trials are target absent trials, this 1.7% represents fully 81% of all changes. At high prevalence, however, the pattern was somewhat different: 25% of the 104 changes were from correct absent responses to false alarms, while 52% were from miss errors to hits. Table 1 breaks down each change by response type for Experiments 1a, 1b, and 2. The miss to hit percentages for Experiment 2 make it clear that requiring a second response does allow observers to correct about a third of low prevalence miss errors. Even if it does not eliminate the prevalence effect, the required response does narrow the gap between low and high target prevalence conditions.
Table 1.
Percentage of first responses that were changed on second response. Thus, at low prevalence in Experiment 1a, only 9.2% of targets missed on first response were found on the second, 10.5% in Experiment 1b, and 29.9% in Experiment 2.
| Experiment/ Prevalence |
Miss to Hit | Correct Absent to False Alarm |
Hit to Miss | False Alarm to Correct Absent |
|---|---|---|---|---|
| Experiment 1a | ||||
| Low (2%) | 9.2% | 0.4% | 0.0% | 9.7% |
| High (50%) | 5.9% | 0.4% | 0.0% | 6.8% |
| Experiment 1b | ||||
| Low (2%) | 10.5% | 0.6% | 0.0% | 2.8% |
| High (50%) | 8.0% | 0.6% | 0.4% | 2.3% |
| Experiment 2 | ||||
| Low (2%) | 29.9% | 1.7% | 0.5% | 2.4% |
| High (50%) | 16.7% | 1.9% | 0.4% | 10.1% |
The pattern of changed responses can be seen in Table 1
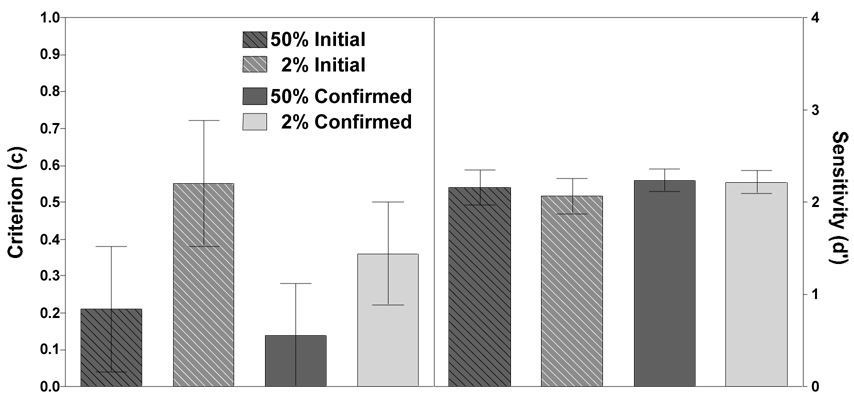
As shown in Figure 9, analysis of the signal detection parameters d’ and c replicate those of Experiment 1a, 1b, and of Wolfe et al. (2007). Criterion was more conservative at low prevalence (F(1, 14)=9.589, p<0.01, η ^2 = 0.41) and more liberal after correction (F(1, 14)=18.294, p<0.01, η ^2 = 0.57). Experimental block order did not affect criterion (F < 0.10, p > 0.75). There is an interaction between prevalence and confirmation reflecting the larger effects of correction at low prevalence (F(1, 14)=5.732, p<0.05, η ^2 = 0.29). Other interactions were not significant.
Figure 9.
Criterion (c, left panel) and sensitivity (d’, right panel) for high and low prevalence. Error bars represent within-subject 95% confidence intervals.
Turning to sensitivity, d' improved modestly on second response (F(1, 14)=7.651, p<0.05, η ^2 = 0.35). However, there was no main effect of prevalence (F < 0.30, p > 0.55), or experimental block order (F < 0.60, p > 0.45). There were no significant interactions.
As before, miss rate was analyzed in 250-trial bins (ANOVA with factors of quartile, confirmation, and experimental block order). Miss rate did not increase reliably as the task progressed (F < 0.10, p > 0.95). There was a significant interaction between confirmation and quartile (F(3, 42)=4.010, p<0.05, η ^2 = 0.22) reflecting the fact that the second response was associated with reduced miss rates only in the second half of the experiment. Other interactions were not significant.
Experiment Two demonstrates that requiring observers to confirm their responses on every trial improves performance modestly. That improvement could be due to correction of perceived errors as in Fleck and Mitroff (2007) or it could be the by-product of forcing observers to spend more time with the stimulus. In an experiment in Wolfe et al. (2007), we found that forcing observers to take a second look at a stimulus on a few trials improved performance on those specific trials. These intermittent second looks were intended to induce a general slowing of first responses. This manipulation did slow first responses significantly but did not reduce the prevalence effect. Essentially the same point is made here. Performance on the second response is better than on the first respose but the prevalence effect remains.
Effect of Removing Feedback: Comparison with Wolfe et al. (2007)
The original purpose of these studies was to examine the possibility that the prevalence effect could be eliminated by allowing observers to correct responses. The effects of correction in our experiments are quite small. The biggest change from our earlier results seems to be associated with the presence of feedback in our eariler expeirments and its absence in these experiments. The prevalence effect, while still robust in the present experiments, appears smaller than in comparable earlier experiments. In order to assess this hypothesized role of feedback, we did a post-hoc comparision of Experiments 1a, 1b, and 2 from Wolfe et al. (2007) with Experiments 1a and 2 from this paper (Experiment 1b was omitted for redundancy with Experiment 1a). The tasks in these two sets of experiments are nearly identical except that Wolfe et al. (2007) provided full feedback and the present experiments provided none. Like the current studies, each of the three Wolfe et al. (2007) experiments tested a strategy intended to eliminate the prevalence effect (e.g., combining search performance of pairs of observers or forcing observers to slow down). Each strategy failed to eliminate the prevalence effect.
For analysis of RT performance, we compared data from uncorrected responses from the first experiment of this paper with that of Experiment 1a in Wolfe et al. (2007). It is possible that ability to correct responses in the present experiments might influence performance (RT and error) on the initial response. Nevertheless, this between-experiment comparison provides support for the hypothesis that feedback produced more dramatic shifts in criterion (and thus in errors) as a function of target prevalence.
Results
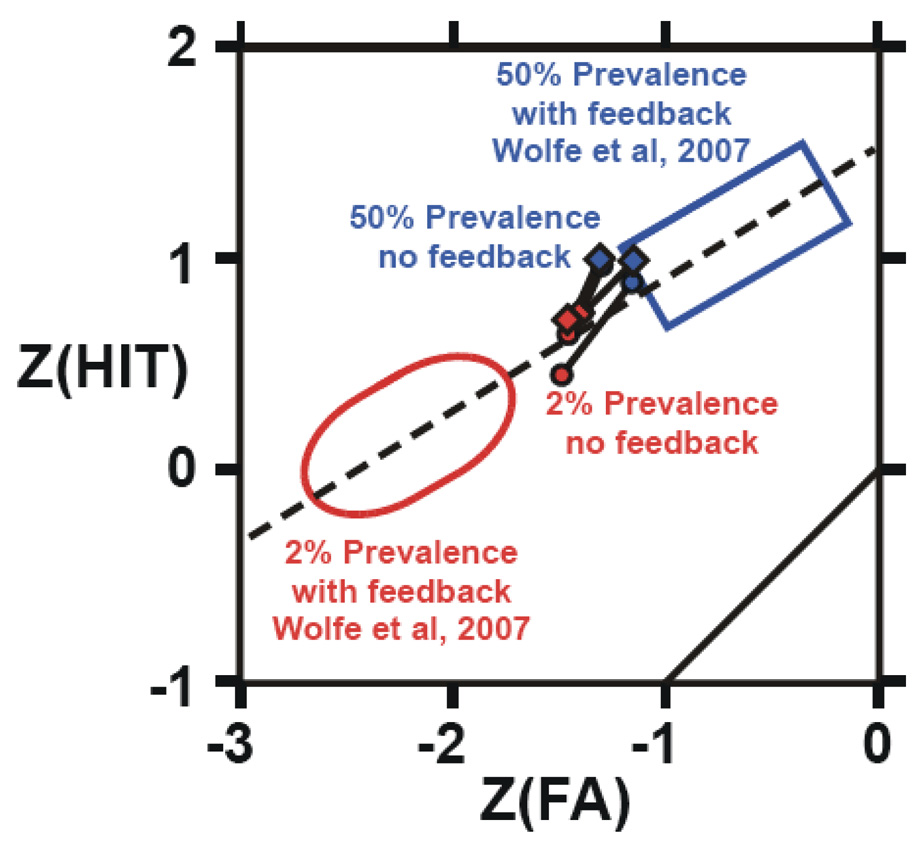
Figure 10 shows the accuracy data from Experiments 1a and 2 plotted in z-coordinates. Each experiment is plotted as two barbells, one before correction (circles) and one after correction (diamonds). Each barbell consists of a red symbol (lower left end of the barbell) denoting performance at 2% and a blue symbol (upper right) denoting performance at 50%. Similarly, the large oval (red) summarizes performance in comparable experiments from Wolfe et al (2007) at 2%, and the large rectangle (blue) summarizes 2007 performance at 50%. The dotted line is the ROC of slope 0.6 that best fits the Wolfe et al (2007) data. Movement along the ROC reflects a criterion shift. The solid line (bottom right) is the diagonal line of unit slope on a standard ROC. If the current experiments also yielded a criterion shift, the barbell shafts should be parallel to the ROC. In contrast, a sensitivity change should result in barbell shafts perpendicular to the ROC.
Figure 10.
Data from 2% and 50% prevalence experiments with feedback (from Wolfe et. al, 2007) and without feedback (present exps.). The figure shows that there is a greater shift in criterion with feedback than without. Dotted line represents an ROC of slope 0.6 in z-coordinates. Large open oval (red) shows the range of 2% prevalence data from Fig. 18 of Wolfe et al., (2007). Large open rectangle (blue) shows the 50% prevalence data from that paper. Data from Exps 1 & 2 of this paper are shown as ‘barbells’ lying between the open figures. In all cases, the end to the lower left (red) is 2% prevalence. Upper right (blue) is 50% prevalence. The steeper barbells are Exp. 1. Circles are before correction and diamonds, after.
Several points can be made from this figure:
The central conclusion is that, in the absence of feedback, the prevalence effect is smaller but it is still characterized by a criterion shift. The data from the present studies (no feedback) fall roughly on the line in z-coordinate space defined by the data from the previous experiments (with feedback). This corresponds to an ROC with a slope of about 0.6. If the primary effect of the absence of feedback had been to change sensitivity, the barbells representing the prevalence effect would have been oriented orthogonal to this line.
Second, the without-feedback data points from the present experiment lie between the low and high prevalence points from the with-feedback conditions of Wolfe et al., (2007). In the absence of explicit feedback, criteria at both low and high prevalence move to intermediate values. A mixed-model ANOVA (includes only initial response data from current Experiments 1a and 2) with factors of prevalence and feedback reveals a main effect of feedback on criterion: overall, criterion values are closer to zero in the absence of feedback (F(1, 76)=12.224, p<0.01,η ^2 = 0.14). There is the usual effect of prevalence such that the criterion is more neutral at high prevalence than at low prevalence: (F(1, 76)=164.03, p<0.00001, η ^2 = 0.68). As is clear from the figure, the effects of prevalence (i.e. the distance between linked red and blue symbols) are much more marked with feedback than without (F(1, 76)=51.086, p<0.00001, η ^2 = 0.40).
Questioning the assumptions of d’ and c
D’ and c as measures of sensitivity and criterion are based on the assumption of an equal variance ROC with a slope of 1.0. If we take the “true” slope to be 0.6 as shown in Figure 10, we can calculate the alternative measures d(a) and c(a) for Experiments 1a and 2 (See Macmillan and Creelman, 2005, ch. 3). Analyzed in this way, the results suggest some effect of prevalence on both criterion and sensitivity. The change in criterion with prevalence as measured by c(a) is significant for three of the four comparisons (t(11)> 2.4, p<0.05). The criterion shift for the second response in Experiment 1a is marginal (t(11)=2.1, p=0.057). The change in sensitivity, as measured by d(a), is significant in Experiment 1a (both t(11) > 3.1, p < 0.01) but not in Experiment 2 (both t < 1.7, p > 0.1).
We can also measure A’ (proposed as a non-parametric measure of the area under the ROC) and B” (a measure of bias) (Donaldson, 1992). Average results are shown in Table 2. While the non-parametric nature of these measures has been challenged (Pastore, Crawley, Berens, & Skelly, 2003), they also show the pattern of results described throughout this paper: little or no effect of prevalence on sensitivity with a substantial effect on criterion. Correction has more of an effect in Exp. 2, as would be expected when all repsonses must be confirmed.
Table 2.
Nonparametric sensitivity (A’) and bias (B”) values calculated from average hit and false alarm data for Exps. 1 & 2. A’ maximum is 1.0. For B”, zero indicates no bias.
| Sensitivity (A') | Bias (B") | ||||
|---|---|---|---|---|---|
| Before Correction | After Correction | Before Correction | After Correction | ||
| Exp. 1 | 2% Prevalence | 0.90 | 0.91 | 0.65 | 0.60 |
| 50% Prevalence | 0.92 | 0.92 | 0.36 | 0.31 | |
| Exp. 2 | 2% Prevalence | 0.88 | 0.91 | 0.75 | 0.56 |
| 50% Prevalence | 0.90 | 0.91 | 0.30 | 0.18 | |
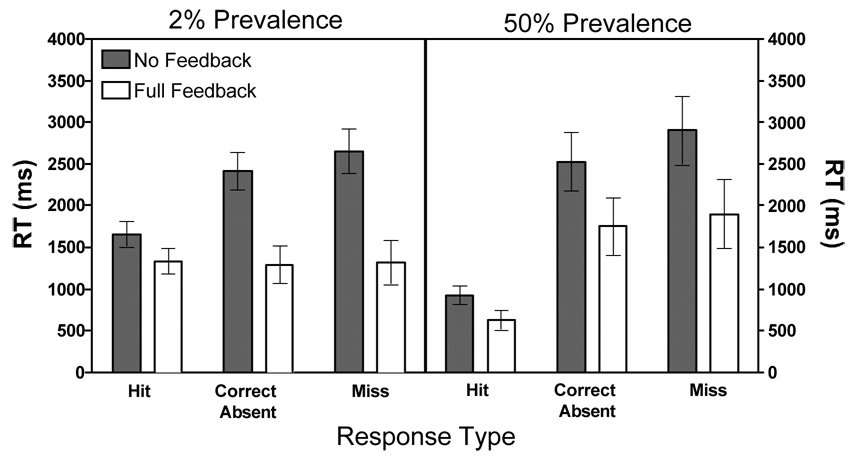
The absence of feedback also has a pronounced effect on RT. Observers appear to have adopted a more cautious approach to the task and spent more time with the display. The effect is illustrated in Figure 11. It is obvious that the main effect of feedback is on the “no target” responses (analyses were not done on false alarm responses because rates were very low at 2% prevalence for the Wolfe et al. (2007) study). These are much faster with feedback than without. A mixed model ANOVA on RT collapsed across set size with factors of feedback, prevalence, and response type reveals main effects of feedback (F(1, 38)=17.040, p<0.001, η ^2 = 0.31), prevalence (F(1, 38)=5.991, p<0.05, η ^2 = 0.14) and response type (F(2, 76)=80.119, p<0.001, η ^2 = 0.68), as well as reliable interactions between response type and feedback (F(2, 76)=13.841, p<0.001 η ^2 = 0.27), and prevalence and response type (F(2, 76)=22.776, p<0.001, η ^2 = 0.38). Looking particularly at the RTs at low prevalence, absence of feedback slows correct absent RT by 1126 ms (t(38)=5.043, p<0.001), hit RT by 329 ms (t(38)=2.084, p<0.05), and miss RT by 1336 ms (t(38)=5.058, p<0.001). A similar but more modest effect occurs at high prevalence: correct absent RT slows by 682 ms (t(38)=2.231, p<0.05), hit RT by 258 ms (t(20.9)=2.270, p<0.05), and miss RT by 877 ms (t(38)=2.411, p<0.05). Thus, although there is still a persistent prevalence effect in the no feedback experiments, the absence of feedback makes the observers more cautious and more accurate. Interestingly, Fleck and Mitroff (2007) did not find a major effect of feedback. They replicated the original Wolfe et al. (2005) “find the tools” experiment without feedback. Nevertheless, they obtained a substantial prevalence effect. It was this prevalence effect that was correctable in their experiment. We will discuss this difference in the effects of feedback in the General Discussion.
Figure 11.
RT in milliseconds for correct absent, hit, and miss responses. Full Feedback (Experiment 1a of Wolfe et. al, 2007) is represented in white bars and No Feedback (initial response data from Experiment 1a of the current paper) is in gray bars. Low prevalence is represented on the left panel and high prevalence on the right. Error bars represent between-subject 95% confidence intervals.
General Discussion
We believe that low prevalence puts pressure on the observer. This pressure can be manifest in different ways depending on the details of the search task. Fleck and Mitroff’s (2007) observers responded to the pressure with speeded errors that they recognized and could correct. Our observers, in the present experiments, responded to our somewhat different stimuli with a criterion shift that produced more miss errors and fewer false alarms. This pattern of errors was not eliminated by the opportunity to correct responses. The object search tasks used in our 2005 paper and by Fleck and Mitroff (2007) is fairly demanding but does not produce false alarm errors. It is a “high threshold” task (Palmer, Verghese, & Pavel, 2000) that would occupy space in the upper left corner of a standard ROC graph; high hits with low false alarms. There would not be much room in this task for a criterion shift to manifest itself. In this part of the task space, many of the errors produced by low prevalence seem to be errors that the observer notices and can correct, given the option.
In the simulated baggage task used here, false alarms occur and d’ hovers around 2.0. With this task, Wolfe et al. (2007) found that the main effect of prevalence was on criterion. In the present experiments, when feedback was eliminated, the effect of criterion was muted. Both low and high prevalence criteria moved toward an intermediate value. Nevertheless, we still observed a significant criterion shift due to prevalence.
Fleck and Mitroff produced a robust prevalence effect with their task without feedback. We hypothesize that their task provided its own feedback. In tasks that do not produce false alarms, observers may have to work to find the target but once they find it, they can be quite sure that they have found it. As evidenced by Fleck and Mitroff’s (2007) correction data, their observer were often aware that they found the target but had made the incorrect response. They could correct the error that they had detected. Our observers did not explicitly detect their errors and could not correct them with a second response.
Neither the Fleck and Mitroff (2007) results nor our current results represent the “True Results.” Rather, each samples a different portion of a task space. From a practical point of view, we would like to know what part of the task space is occupied by real baggage screening or real medical screening tasks. In the real world, feedback is imperfect but not entirely absent. Tasks are difficult and do produce false alarms as in our task. At the same time, trained specialist observers like baggage screeners and mammographers undoubtedly know that they have found a target on many target present trials as in the Fleck and Mitroff task. The time course of individual trials is different, and so on. The robust nature of prevalence effects in the lab, even if they can be counteracted by a second response in some cases, indicates that we should determine if they are occurring in the field and, if they are, how they can be counteracted.
As a topic for basic research, the differences between our results and those of Fleck and Mitroff (2007) raise a different set of interesting questions. These have to do with the problem of terminating unsuccessful searches. Changing the prevalence changes some sort of threshold for terminating search without finding a target. The prevalence effect shows us that the same targets that are found at high prevalence can be missed at low prevalence. It has proven difficult to model target absent responses in visual search (Chun & Wolfe, 1996; Cousineau & Shiffrin, 2004; Zenger & Fahle, 1997), but the prevalence data may impose constraints that clarify those models.
For the present, our results show that the prevalence effect is not always eliminated when observers have a chance to correct themselves; at least, not when the task is our simulated baggage search task. Eliminating feedback does appear to reduce the impact of prevalence on task performance. Nevertheless, it remains clear that very low target prevalence exerts pressure on human observers. That pressure may be pernicious in tasks where miss errors are particularly undesirable. Thus, it remains worthwhile to understand the role of target prevalence in laboratory and real world search tasks.
Figure 4.
Mean error rates (misses and false alarms) for high (50%) and low (2%) prevalence. Error bars represent within-subject 95% confidence intervals.
Acknowledgements
The work reported here was funded by the Department of Homeland Security’s Transportation Security Laboratory Human Factors Program, grant DHS 02-G-010 to JMW. We would like to thank Karla Evans for useful suggestions.
References
- Baddeley AD, Colquhoun WP. Signal probability and vigilance: a reappraisal of the 'signal-rate' effect. British Journal of Psychology. 1969;60(2):169–178. doi: 10.1111/j.2044-8295.1969.tb01189.x. [DOI] [PubMed] [Google Scholar]
- Brainard DH. The Psychophysics Toolbox. Spatial Vision. 1997;10:443–446. [PubMed] [Google Scholar]
- Chun MM, Wolfe JM. Just say no: how are visual searches terminated when there is no target present? Cognitive Psychology. 1996;30:39–78. doi: 10.1006/cogp.1996.0002. [DOI] [PubMed] [Google Scholar]
- Colquhoun WP, Baddeley AD. Influence of signal probability during pretraining on vigilance decrement. Journal of Experimental Psychology. 1967;73(1):153–155. doi: 10.1037/h0024087. [DOI] [PubMed] [Google Scholar]
- Cousineau D, Shiffrin RM. Termination of a visual search with large display size effects. Spatial Vision. 2004;17(4–5):327–352. doi: 10.1163/1568568041920104. [DOI] [PubMed] [Google Scholar]
- Donaldson W. Measuring recognition memory. Journal of Experimental Psychology: General. 1992;121(3):275–277. doi: 10.1037//0096-3445.121.3.275. [DOI] [PubMed] [Google Scholar]
- Fleck M, Mitroff S. Rare targets rarely missed in correctable search. Psychological Science. 2007;18(11):943–947. doi: 10.1111/j.1467-9280.2007.02006.x. [DOI] [PubMed] [Google Scholar]
- Gur D, Sumkin JH, Rockette HE, Ganott M, Hakim C, Hardesty L, et al. Changes in breast cancer detection and mammography recall rates after the introduction of a computer-aided detection system. Journal of the National Cancer Institute. 2004;96(3):185–190. doi: 10.1093/jnci/djh067. [DOI] [PubMed] [Google Scholar]
- Green DM, Swets JA. Signal detection theory and psychophysics. New York: John Wiley and Sons; 1967. [Google Scholar]
- Healy AF, Kubovy M. Probability matching and the formation of conservative decision rules in a numerical analog of signal detection. Journal of Experimental Psychology: Human Perception & Performance. 1981;7(5):344–354. [Google Scholar]
- Jiang Y, Miglioretti DL, Metz CE, Schmidt RA. Breast cancer detection rate: designing imaging trials to demonstrate improvements. Radiology. 2007;243:360–367. doi: 10.1148/radiol.2432060253. [DOI] [PubMed] [Google Scholar]
- Li H, Li F, Gao HH, Chen A, Lin C. Appropriate responding can reduce miss errors in visual search. 2006. unpublished ms. [Google Scholar]
- Mackworth J, Taylor M. The d' measure of signal detectability in vigilance-like situations. Canadian Journal of Psychology. 1963;17(3):302–325. [PubMed] [Google Scholar]
- Maddox WT. Toward a unified theory of decision criterion learning in perceptual categorization. Journal of Experimental Analysis of Behavior. 2002;78(3):567–595. doi: 10.1901/jeab.2002.78-567. [DOI] [PMC free article] [PubMed] [Google Scholar]
- Macmillan NA, Creelman CD. Detection Theory: A User's Guide. 2nd Edition. Cambridge University Press; 2005. [Google Scholar]
- Palmer J, Verghese P, Pavel M. The psychophysics of visual search. Vision Research. 2000;40(10–12):1227–1268. doi: 10.1016/s0042-6989(99)00244-8. [DOI] [PubMed] [Google Scholar]
- Pastore RE, Crawley EJ, Berens MS, Skelly MA. "Nonparametric" A' and other modern misconceptions about signal detection theory. Psychon Bull Rev. 2003;10(3):556–569. doi: 10.3758/bf03196517. [DOI] [PubMed] [Google Scholar]
- Pisano ED, Gatsonis C, Hendrick E, Yaffe M, Baum JK, Acharyya S, et al. Diagnostic Performance of Digital versus Film Mammography for Breast Cancer Screening. New England Journal of Medicine. 2005 doi: 10.1056/NEJMoa052911. [DOI] [PubMed] [Google Scholar]
- Pelli DG. The VideoToolbox software for visual psychophysics: transforming numbers into movies. Spatial Vision. 1997;10(4):437–442. [PubMed] [Google Scholar]
- Rich AN, Kunar MA, Van Wert MJ, Hidalgo-Sotelo B, Horowitz TS, Wolfe JM. Why do we miss rare targets? Exploring the boundaries of the low prevalence effect. Journal of Vision. doi: 10.1167/8.15.15. (In press) [DOI] [PMC free article] [PubMed] [Google Scholar]
- Rubenstein J. Test and evaluation plan: X-Ray Image Screener Selection Test (no. DOT/FAA.AR-01/47) Washington DC: Office of Aviation Research; 2001. [Google Scholar]
- Smith PA, Turnbull LS. Small cell and 'pale' dyskaryosis. Cytopathology. 1997;8(1):3–8. [PubMed] [Google Scholar]
- Wolfe JM, Horowitz TS, Kenner NM. Rare items often missed in visual searches. Nature. 2005;435:439–440. doi: 10.1038/435439a. [DOI] [PMC free article] [PubMed] [Google Scholar]
- Wolfe JM, Horowitz TS, Van Wert MJ, Kenner NM, Place SS, Kibbi N. Low target prevalence is a stubborn source of errors in visual search tasks. Journal of Experimental Psychology: General. 2007;136(4):623–638. doi: 10.1037/0096-3445.136.4.623. [DOI] [PMC free article] [PubMed] [Google Scholar]
- Zenger B, Fahle M. Missed targets are more frequent than false alarms: A model for error rates in visual search. Journal of Experimental Psychology: Human Perception and Performance. 1997;23(6):1783–1791. doi: 10.1037//0096-1523.23.6.1783. [DOI] [PubMed] [Google Scholar]


