Abstract
The ability to generate in vivo maps of lactate may have significant diagnostic utility in staging and treatment planning of a wide variety of cancers. The double selective multiple quantum filter technique (SelMQC) has been shown to be effective for non-localized detection of lactate with little or no interference from other signals. Here the SelMQC technique has been combined with longitudinal Hadamard slice selection and chemical shift imaging to yield slice selective images of lactate. The technique is shown to be effective in phantoms and in WSU-DLCL2 xenografts implanted in flanks of SCID mice. Tumors exhibited an annulus of elevated lactate concentration surrounding a necrotic tumor core.
Keywords: CSI, lactate, tumor, mouse
Introduction
It is widely recognized that aerobic glycolysis is a hallmark of cancer (1). The primary function of this metabolic pathway is believed to provide building blocks for cell replication (2), although glycolysis also plays a minor role in supporting tumor energy metabolism. Tumors have also been shown to have compromised perfusion and exhibit high interstitial fluid pressure compared to normal tissues due to the absence of functioning lymphatics, increased vascular permeability, and rapid proliferation of cells in confined spaces (3). These properties often result in elevated steady-state lactate levels within tumors. Elevated lactate levels have therefore been proposed as markers for tumor diagnosis (4), the presence of hypoxia (5), therapeutic resistance (1), response to therapy (6-9) and poor prognosis associated with neoplastic disease (10,11). Although tumor lactate concentrations may be determined from biopsy, the metabolism of tumors is known to be heterogeneous and point sampling may not be representative of overall tumor metabolism. A technique for mapping lactate distributions within the tumor is therefore highly desirable.
Magnetic resonance spectroscopy (MRS) has long been recognized as being capable of non-invasive detection of lactate levels. However, MRS techniques are complicated by the fact that the lactate methyl resonance chemical shift falls in the same range as that for lipids. Thus the lactate signal is often obscured by the lipid signal unless some spectral editing method is employed. Lactate editing techniques can be broadly categorized as being difference techniques (12-17) or multiple quantum (MQ) filters (18-25). The difference techniques suffer from the fact that any instability in the specimen (patient) or instrument between acquisitions degrades the level of cancellation resulting in spurious signals. Of the various MQ lactate editing techniques, the doubly frequency selective multiple quantum coherence transfer (SelMQC) technique (26) has several advantages. The method detects the lactate signal in a single shot making it less susceptible to motion and instability than difference and phase cycling methods. The utilization of two frequency selective pulses tuned to the lactate methyl and methyne resonances makes the protocol highly specific for lactate, requiring no water suppression beyond the MQ filter.
The present report investigates the feasibility of using the SelMQC method to generate maps of lactate in vivo. Two-dimensional spatial encoding can easily be incorporated into the SelMQC pulse sequence by introduction of chemical shift imaging gradients in one of the evolution periods of the sequence. However, addition of slice selection is complicated by the fact that every pulse in the sequence is frequency selective. Furthermore, multiple quantum coherence is generated by the second pulse in the sequence. The use of spatially selective RF pulses for coherence transfer is known to negatively impact the efficiency of the coherence transfer leading to signal loss (19,21). Slice selection must therefore be achieved before the second pulse in order to avoid this penalty in signal to noise ratio. One solution to this problem is to replace the first pulse in the sequence with a spectral-spatially selective pulse envelope (27). However, these pulses are highly sensitive to errors in the relative timing of the gradient and RF channels making them difficult to implement. Furthermore, the spectral selectivity of such pulses is limited.
An alternative solution is to achieve slice localization prior to the first pulse in the SelMQC sequence using longitudinal Hadamard encoding (28). This technique employs inversion pulses to encode spatial information into axial magnetization prior to the lactate selective sequence. Application of a Hadamard transform to the acquired data then yields the localized spectra. Hadamard encoding has previously been shown to be an effective method for slice selection when used in combination with two-dimensional chemical shift imaging (CSI) techniques (29). Two dimensional Hadamard localization has also been shown to be effective when used in combination with multiple quantum lactate editing techniques (30). Here, a technique that combines the SelMQC-CSI sequence with Hadamard slice selection is described. The utility of the technique in generating maps of lactate levels is demonstrated in phantoms and subcutaneous tumors in mice.
Methods
Pulse Sequence
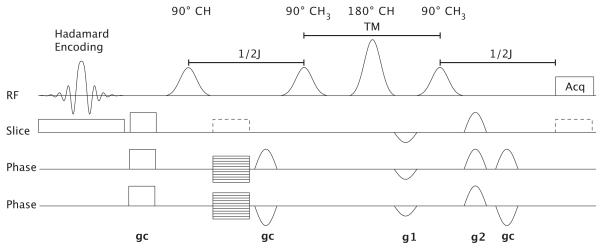
The pulse sequence employed in the current study (Fig-1) consists of longitudinal Hadamard encoding in the slice direction followed by the previously published SelMQC pulse sequence (26). The SelMQC sequence consists of four frequency selective pulses with the first and third applied at the lactate methyne resonance (4.1 ppm) and the second and fourth applied at the methyl resonance (1.3 ppm). Coherence selection is achieved with gradient pulses g1 and g2 that have relative amplitudes of 1:2. Crusher gradients pulses, gc, are also included in order to suppress unwanted coherence pathways. Optional pre-encode and read gradients on the slice axis were incorporated into the sequence (Fig 1, dashed lines) in order to allow for direct observation of the slice selection profiles. Alternatively, CSI phase-encoding gradients may be enabled in the first evolution period for in-plane spatial encoding. For additional details about the SelMQC sequence, the reader is referred to the original description (26).
Figure 1.
The HS-SelMQC-CSI pulse sequence consists of Hadamard slice encoding followed by crusher gradients and the SelMQC sequence. Phase encoding gradients were inserted in the first evolution period to achieve in-plane spatial encoding. Optional pre-encode and read gradients on the slice axis (dashed lines) are provided for generation of lactate slice selection profiles.
Two versions of the protocol were implemented with second and fourth order longitudinal Hadamard encoded slice selection, respectively. Slice selection was achieved using 2N inversion pulses based on the hyperbolic secant envelope, where N is the number of slices. The slice selection pulses were designed in pairs having inverted response profiles. This method of using 2N pulses to generate N’th order Hadamard encoding minimizes T1 interference with the localization and allows the protocol to be run at a reduced repetition time (TR). The simplest of the spatial encoding pulses employed was a null pulse. The remaining multi-band spatially selective pulses, p(t), were generated from linear combinations of single-band pulses (31) as described by
| [1] |
where the time parameter, t, runs from -π to π, β determines the adiabaticity of the envelope, μ determines the bandwidth, P is the number of bands in the profile, Δωj is the frequency offset for the j’th band and i=√-1. Techniques for minimization of the pulse power in the multi-band pulses (32) were not necessary because the number of bands was small and peak power was not a limiting factor. The parameters used to generate the seven pulse envelopes used for fourth order Hadamard encoding are listed in Table 1. A subset of these pulses was employed for the two-slice protocol.
Table-1.
Parameter values used to generate spatially encoded adiabatic RF pulse envelopes.
| Profile | β (rad/sec) | μ | Δω1 (rad/sec) | Δω2 (rad/sec) |
|---|---|---|---|---|
| - - - - | 1.98 | 4 | 0 | |
| + - - + | 1.98 | 2 | 0 | |
| + + - - | 1.98 | 2 | 20.5 | |
| - + - + | 1.98 | 1 | 10.25 | -30.5 |
| - + + - | 1.98 | 1 | 30.75 | -30.75 |
| - - + + | 1.98 | 2 | -20.5 | |
| + - + - | 1.98 | 1 | -10.25 | 30.6 |
Phantom and Animal Studies
All MR studies were performed on a 9.4T vertical bore spectrometer (Varian Inc, Palo Alto, CA) equipped with a 55 mm ID gradient tube (Resonance Research Inc., Billerica, MA) with a maximum gradient strength of 25 Gauss/cm. Phantom studies were performed using a 10 mm high-resolution multi-nuclear probe (Doty Scientific Inc., Columbia, SC). Animal studies employed a home-built 13×13 mm (diameter x length) resonator constructed specifically for observation of xenografts in small animals. Gaussian pulse envelopes of 8 msec duration were used for all frequency selective pulses. A pulse width of 5 msec was employed for all Hadamard encoding pulses. Coherence selection gradients of amplitude g1 = 6 and g2 = 12 G/cm and crusher of gc=5 G/cm were employed.
A phantom was constructed consisting of two concentric cylinders (10 and 5 mm O.D. NMR tubes) with a 100 mM solution of lactic acid (Fisher Scientific) in normal saline in the inner cylinder and mineral oil in the outer annulus. Lactate slice selection profiles were generated by enabling the read gradients on the slice axis (dashed lines, Fig 1). Other acquisition parameters for the slice profile studies were; slices = 4, thickness = 2 mm , TR = 0.6 sec and averages = 32. Imaging studies of the phantom were planned such that the imaging plane was tilted relative to the axis of the phantom. Under these conditions the position of the phantom cross section varies with respect to slice position making the effectiveness of slice selection apparent in the images. Gradient echo scout images (TR = 0.1 sec, TE = 3 msec, flip angle = 20°, slices = 2, field of view = 1,6×1.6 cm, thickness = 1 mm, matrix = 128×128) were acquired for comparison with the CSI data. The Hadamard slice selection (HS)-SelMQC-CSI protocol was then run (TR = 0.6 sec, matrix = 32×32, data points = 512, spectral width = 4000 Hz, averages = 2*Hadamard order = 4, total acquisition time = 68 min) with the same slice orientation and thickness parameters used in the gradient echo study.
The Institutional Animal Care and Use Committee (IACUC) approved the animal protocol. Diffuse large B-cell lymphoma cells (WSU-DLCL2) were cultured as described elsewhere (33). SCID mice (National Cancer Institute) were inoculated in the rear flank with 107 cells in 0.1 ml of Hanks’ Balanced Salt Solution (Invitrogen/Gibco, Carlsbad, CA) at age 5-7 weeks. Tumors became palpable within a few weeks. MR exams were performed when tumors reached a volume of approximately 500 mm3 (as determined with calipers) that typically required about 40 days post-inoculation. Animals were prepared for MR exams by induction of general anesthesia by free breathing of 1% isoflurane in oxygen delivered through a custom-built nose cone. An optical temperature probe (Luxtron, Mountain View, CA) was inserted rectally and provided thermostatic control of a home-built warm air source. The output of this device was directed over the animal, which maintained the animal’s core body temperature at 37° ± 2°. The animal was mounted in the coil such that the subcutaneous tumor projected into the resonator. The coil was inserted into the magnet and gradient echo images were generated as described previously. Global shimming on the tumor was performed and line widths of 40-100 Hz were typically achieved. Slice selective spectra were acquired (no in plane spatial encoding) using the fourth order Hadamard slice selection SelMQC protocol and the same acquisition parameters used in the phantom studies. A second order Hadamard slice selection SelMQC-CSI sequence was then performed (TR = 0.6 sec, matrix = 16×16, data points = 512, spectral width = 4000 Hz, averages = 8*Hadamard order = 16, total acquisition time = 41 min, slice thickness = 2 mm). At the conclusion of the study, the animal was removed from the coil and observed during recovery from anesthesia.
Data Analysis
All data analysis was performed off line using codes developed in the IDL (ITT Visual Information Systems, Boulder, CO) programming environment specifically for this purpose. The difference between pairs of CSI data sets generated with inverted Hadamard encoding profiles were calculated for each acquired pair. The Hadamard transform was then applied to the resulting CSI data sets, followed by zero filling in spatial domains to 64×64 and three-dimensional Fourier transformation. Lactate metabolite maps were then extracted from the resulting slice selective two-dimensional CSI data sets by calculating the integral of the signal intensity over a bandwidth of 100 Hz centered on the lactate methyl resonance. The resulting maps were saved for further analysis.
Results
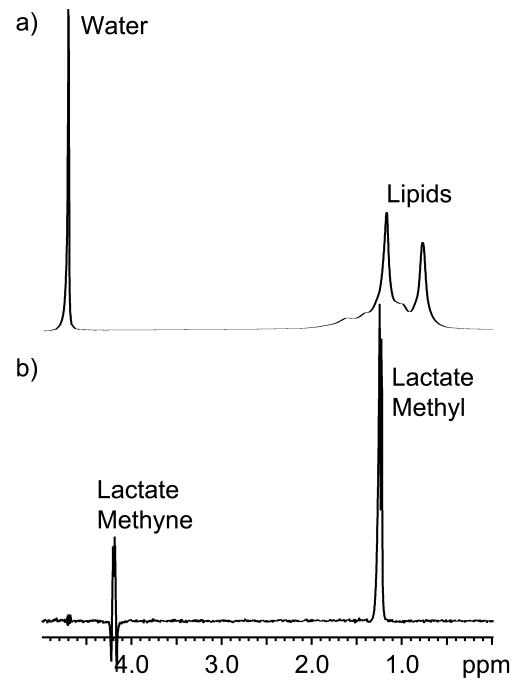
The specificity of the SelMQC sequence for lactate is demonstrated in Fig 2 which compares a single pulse spectrum of the lactate/lipid phantom to one generated with the SelMQC sequence with all spatial localization disabled. The water (4.7 ppm) and lipid resonances (0.5 – 1.8 ppm) are easily identified in the single pulse spectrum. However, the lactate resonances (4.1 and 1.3 ppm) are orders of magnitude smaller than the lipid and water signals and are therefore not seen in the spectrum. The SelMQC sequence easily detects the lactate with no interference from the other resonances. All of the lipid resonances are suppressed to below noise levels while a small residual water signal is detected. Note that the outer elements in the methyne quartet (4.1 ppm) are inverted relative to the center two lines due to scalar evolution during the SelMQC pulse sequence.
Figure 2.
Spectra of the lactate/lipid phantom generated with a pulse acquire sequence (a) and the non-localized SelMQC sequence (b) are shown. The spectra are displayed on different scales due to the much lower signal intensity in the lactate edited spectrum.
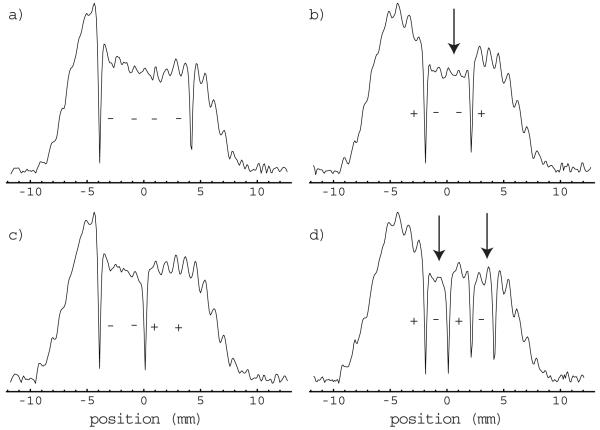
Experimentally determined magnitude slice selection profiles generated with the lactate/lipid phantom are depicted in Fig 3. The overall envelope of the response profiles is indicative of the axial variation in the sensitivity of the RF probe for the SelMQC sequence. The probe used in the phantom studies was a Helmholtz pair design and thus has relatively poor B1 homogeneity as is evident in the profiles. Magnitude profiles are employed to avoid problems associated with adjusting first order phase corrections; however, this results in positive signals across the profiles. The transitions between equilibrium and inverted magnetization are evident in the plots as sharp dips in the profiles. The sign of the magnetization following Hadamard encoding is indicated for each band in the figure using + (equilibrium) and - (inverted) symbols. The desired response profiles were generated in every case with sharp transitions between the bands.
Figure 3.
The experimentally observed magnitude response profiles generated by the spatial encoding pulses described in Table 1 are depicted; - - - - (a), + - - + (b), - -++ (c) and + - +- (d). Selection bands having reduced signal intensity due to partial saturation effects are indicated by arrows.
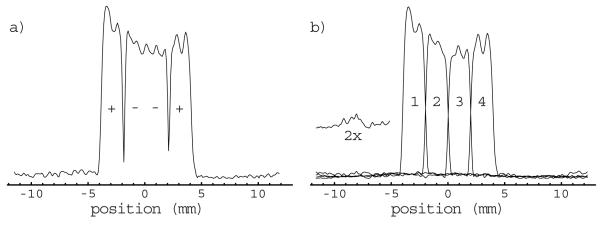
The effects of T1 recovery during the delay between the slice encoding pulses and the start of the SelMQC portion of the sequence are evident in the figure as a slight reduction in signal intensity in the inverted bands relative to the expected profile (arrows, Fig 3b & d). These effects are canceled by taking the difference between profiles having inverted symmetry in their inversion pattern. This correction is demonstrated for the (+--+) - (-++-) = 2(+--+) profile in Fig 4a. The vertical scale for the profile displayed in Fig 4a is half that used in Fig 3. Note that this correction method also suppresses the signal from outside the slab. The slice selection profiles generated by application of the 4’th order Hadamard transform to the corrected profiles are depicted in Fig 4b. The vertical scale in the slice profiles in Fig 4b has been increased relative to that in Fig 4a to account for the 4-fold gain in signal intensity provided by the Hadamard transform. Good localization is achieved for all four slices with very little signal outside of the slice.
Figure 4.
The T1 effects on slice localization are suppressed by calculating the difference between profiles generated with opposite symmetry as shown for the (+--+) - (-++-) = 2(+--+) profile (a). Application of the Hadamard transform to the corrected profiles yields the slice selection profiles (b). The signal from the lactate methyne resonance is largely suppressed due the antiphase components of the multiplet as shown for slice 3 in the inset.
Theoretically, the slice selection profiles are a convolution of the Hadamard pulse response profile with the lactate filter provided by the SelMQC sequence. As demonstrated in Fig 2, both the methyne and methyl resonances of lactate are detected by the SelMQC sequence. The localization for the lactate methyne resonance for a particular volume of tissue is therefore shifted in the slice direction relative to that for the methyl resonance for the same volume of tissue. The region in which the methyne profile is expected to be seen for slice three is displayed in figure (Fig 4b, inset). Some of the methyne signal is detected; however, the intensity is relatively low. This is due to the fact that the SelMQC sequence detects the methyne resonance with a 180° phase difference between the inner and outer lines of the quartet (Fig 2). Convolution of this anti-phase multiplet with the broad slice localization profile results in partial cancellation of the methyne signal. Note that this misregistration of the methyne resonance does not pose any problems in the CSI studies because the resonances are easily resolved in the spectral domain. Typically only the methyl resonance is evaluated in the CSI studies due to its much larger signal intensity.
Typical results from the phantom imaging studies are depicted in Fig 5. Both the inner cylinder and the outer annulus are clearly depicted in the gradient echo images (Fig 5a & b). Note that the vertical position of the two images is shifted relative to each other due to the slice orientation. Also evident in the images is a slight variation in signal intensity due to inhomogeneous RF coil sensitivity. The lactate images generated with the HS-SelMQC-CSI protocol (Fig-4c & d) are well correlated in the gradient echo images. The lactate signal in the inner cylinder is detected with high signal to noise, and the lipid signal in the outer annulus is suppressed to below detection limits. The vertical position of the images is also well correlated with the gradient echo images suggesting effective localization in the slice direction.
Figure 5.
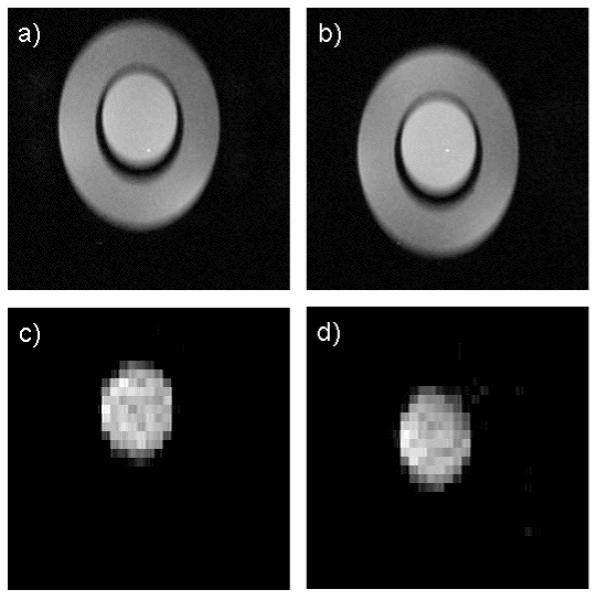
The phantom structure is clearly depicted in the gradient echo, T1 weighted scout images (a, b). Lactate images generated with the HS-SelMQC-CSI protocol exhibit strong signal from the lactate solution in the inner cylinder with no signal from the lipid in the outer annulus (c, d).
The slice planning used in the fourth order slice selective lactate spectra of tumors is depicted in Fig 6a. The first slice was positioned such that it is tangent to the surface of the tumor. The second and third slices pass through the tumor and the fourth slice was within the mouse body. The resulting spectra (Fig 6b) are consistent with expectations. The complete lack of signal in the first spectrum suggests that the signal from that slice is effectively localized outside of the tumor. The remaining slices have significant signal at the lactate methyl and methyne chemical shifts and residual water signal is below detection limits. The observed lactate signal is maximum in the third slice which passes approximately through the center of the tumor.
Figure 6.
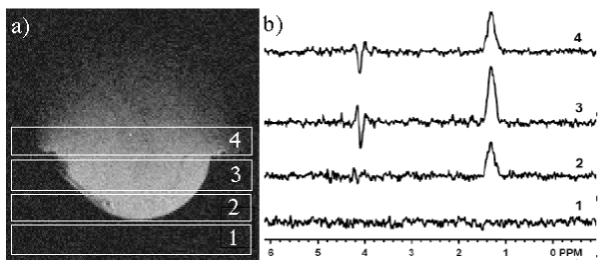
Slice selective spectra were planned such that the first slice was in free space, the center two passed through the tumor, and the last slice was within the mouse body (a). Slice selective spectra show no signal in the first slice, and a maximum lactate intensity in the third slice (b).
Typical results from a lactate imaging study of a tumor xenograft are shown in Fig 7. The gradient echo, T1 weighted images of the tumor exhibit a hypo-intense region near the center that is likely due to necrosis. This hypo-intense core is surrounded by tissue that appears homogeneous in the T1 weighted images with some evidence of vasculature (Fig 7a & b). The 10 mM lactate reference phantom is visualized in both slices; however, there is evidence of air bubbles within the phantom (arrow). The lactate images clearly demonstrated heterogeneity within the tumor. The lactate levels are below detection limits in the core of the tumor and are elevated in the region surrounding the core. Comparison of Fig 7a and c indicates that the region of suppressed lactate levels is significantly larger than the hypo-intense region in the T1 weighted images. The lactate reference phantom is detected in one of the lactate images (Fib 7d, arrow). The larger area of the phantom in the lactate images relative to that in the gradient echo images is due to the lower in plane spatial resolution and larger slice thickness (2 mm) employed in the lactate study. Its absence in the other slice (Fig 7c) is likely due to the previously mentioned air bubbles. The intensity of the phantom signal is comparable to that in the tumor suggesting that the tumor lactate levels are in the 5-10 mM range. The SNR of the lactate signal is in the range of 2-4 as is evident in the image profile (Fig 7e).
Figure 7.
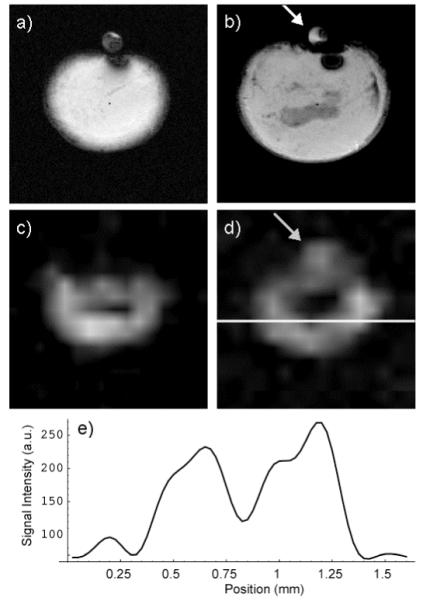
T1 weighted gradient echo images of a tumor xenograft had a hypo-intense core surrounded by homogeneous tissue (a, b). The lactate signal was suppressed in the tumor core (c, d) and the region of this suppression was larger than the hypo-intense region observed in the gradient echo images. The lactate reference phantom was evident in only one of the two slices in both the gradient echo (b) and lactate (d) images (arrows). A profile of the lactate image along the white line in (d) shows the SNR of the lactate images (e).
Discussion
Previous studies have been reported that employ the SelMQC protocol in combination with surface coil localization to generate estimates of total tumor lactate (6,34,35). Although theses studies have demonstrated correlations between lactate levels and response to therapy, these measurements almost certainly provide an incomplete picture. Lactate levels in tumors are a trade-off between the rate of lactate production (glycolysis) and the rate of lactate clearance via perfusion. The total tumor lactate measurements provided by surface coil localization can not distinguish between changes in tumor volume and changes in lactate concentration within specific regions of the tumor. Heterogeneity of tumor perfusion has been demonstrated using dynamic imaging techniques. The level of tissue perfusion determines the rate of lactate clearance, and therefore similar levels of heterogeneity are expected in the lactate distribution. This competition between lactate generation and clearance leads to an in vivo lactate distribution that is not well correlated with other MR observable parameters. This is demonstrated in Fig 7 where the region of lactate suppression in the tumor core extends significantly beyond the necrotoic region observed in the gradient echo images. A complete understanding of in vivo lactate levels in tumors thus requires mapping of its distribution. Furthermore, heterogeneous tumor response within a tumor has been detected by diffusion and T2 weighted imaging. This raises the critical question of whether response detected by decreases in lactate corresponds with response measured by MRI methods. This question, as well as correlation with histological indices of response, can be addressed by imaging the lactate distribution within the tumor.
The HS-SelMQC-CSI technique presented in the current study has been shown to be an effective method for generating slice selective maps of lactate both in phantoms and in vivo. These studies have also demonstrated the anticipated heterogeneity in lactate distribution in tumor xenografts in mice. The observed low lactate levels in the central regions of the tumor are consistent with a necrotic tumor core.
Ideally one would like to generate maps in which the observed lactate signal intensity is proportional to the concentration of lactate in the tissue. The current study employed an external reference sample that can be used to generate order of magnitude estimates of the lactate present in the tissue. A comparison of tissue lactate signal intensity with that of the reference phantom suggests that tissue lactate levels are in the 0-15 mM range. However, this estimation ignores partial volume effects and assumes that the lactate longitudinal relaxation rates are the same in both the phantom and tissue. The in vivo relaxation time of the lactate methyl protons has previously been reported to be 1.4 sec at 4.7 T (36) and is expected to be slightly longer at the field strength employed in the current study. Clearly the TR of 0.6 sec employed in the present study is insufficient to achieve equilibrium magnetization between shots, and the resulting maps are, therefore, heavily T1 weighted. If one assumes that the lactate T1 is homogeneous, it is possible to convert the data generated in the present study to concentration; however, such analysis is beyond the scope of this presentation.
One limitation of the longitudinal Hadamard encoded slice selection technique presented here is that the number of slices acquired must be a power of two, 2N. Alternatively, the normalized Hadamard method (37) may be employed in which case the number of slices must be N2 — 1. The combination of these two methods allows for acquisition of from one to four slices. Studies with more than four slices are simply not practical since the acquisition times are excessive. Another concern with Hadamard encoding is that any motion that occurs in the slice selection direction over the duration of the experiment can lead to slice contamination. In most cases these issues can be addressed by proper restraint of the target tissues.
The technique presented here is the first demonstration of effective slice selection in combination with the SelMQC method of lactate detection. Translation of this protocol to the clinical environment is expected to play an important role in advancing our understanding of the response of tumor metabolism to therapy.
Acknowledgement
We thank Dr. Al-Katib from Wayne State University for providing the cell line used in the current study. All MR studies described in this manuscript were performed in the Small Animal Imaging Facility in the Department of Radiology at the University of Pennsylvania. SCL and JDG and the animal studies were supported by NIH grant R01-CA101700, U24-CA083105.
List of Symbols
- T1
Italics upper case ‘T” , subscript one
- p(t)
Italics lower case “p”, open parenthesis, italics lower case “t”, close parenthesis
- β
Greek italics lower case “beta”
- t
Italics lower case “t”
- μ
Greek italics lower case “mu ”
- i
Italics lower case “i”
- P
Italics upper case “P”
- j
Italics lower case “j”
- Δωj
Greek upper case “delta”, Greek italics lower case “omega”, italics subscript “j”
Footnotes
Correspondence to: Stephen Pickup PhD, Department of Radiology, University of Pennsylvania Medical Center, 3400 Spruce Street, Philadelphia, PA 19104. Voice: (215) 349-5297, FAX: (215) 349-5925, email: pickup@mail.med.upenn.edu
References
- 1.Gatenby RA, Gillies RJ. Why do cancers have high aerobic glycolysis? Nature Reviews Cancer. 2004;4(11):891–899. doi: 10.1038/nrc1478. [DOI] [PubMed] [Google Scholar]
- 2.Bui T, Thompson CB. Cancer’s sweet tooth.[comment] Cancer Cell. 2006;9(6):419–420. doi: 10.1016/j.ccr.2006.05.012. [DOI] [PubMed] [Google Scholar]
- 3.Jain RK. Transport of molecules in the tumor interstitium: a review. Cancer Research. 1987;47(12):3039–3051. [PubMed] [Google Scholar]
- 4.Czernicki Z, Horsztyski D, Jankowski W, Grieb P, Walecki J. Malignancy of brain tumors evaluated by proton magnetic resonance spectroscopy (1H-MRS) in vitro. Acta Neurochirurgica - Supplement. 2000;76:17–20. doi: 10.1007/978-3-7091-6346-7_4. [DOI] [PubMed] [Google Scholar]
- 5.Brizel DM, Schroeder T, Scher RL, Walenta S, Clough RW, Dewhirst MW, Mueller-Klieser W. Elevated tumor lactate concentrations predict for an increased risk of metastases in head-and-neck cancer. International Journal of Radiation Oncology, Biology, Physics. 2001;51(2):349–353. doi: 10.1016/s0360-3016(01)01630-3. [DOI] [PubMed] [Google Scholar]
- 6.Poptani H, Bansal N, Graham RA, Mancuso A, Nelson DS, Glickson JD. Detecting early response to cyclophosphamide treatment of RIF-1 tumors using selective multiple quantum spectroscopy (SelMQC) and dynamic contrast enhanced imaging. NMR in Biomedicine. 2003;16(2):102–111. doi: 10.1002/nbm.816. [DOI] [PubMed] [Google Scholar]
- 7.Bhujwalla ZM, Glickson JD. Detection of tumor response to radiation therapy by in vivo proton MR spectroscopy. International Journal of Radiation Oncology, Biology, Physics. 1996;36(3):635–639. doi: 10.1016/s0360-3016(96)00371-9. [DOI] [PubMed] [Google Scholar]
- 8.Aboagye EO, Bhujwalla ZM, Shungu DC, Glickson JD. Detection of tumor response to chemotherapy by 1H nuclear magnetic resonance spectroscopy: effect of 5-fluorouracil on lactate levels in radiation-induced fibrosarcoma 1 tumors. Cancer Research. 1998;58(5):1063–1067. [PubMed] [Google Scholar]
- 9.Shungu DC, Bhujwalla ZM, Wehrle JP, Glickson JD. 1H NMR spectroscopy of subcutaneous tumors in mice: preliminary studies of effects of growth, chemotherapy and blood flow reduction. NMR in Biomedicine. 1992;5(5):296–302. doi: 10.1002/nbm.1940050517. [DOI] [PubMed] [Google Scholar]
- 10.Tedeschi G, Lundbom N, Raman R, Bonavita S, Duyn JH, Alger JR, Di Chiro G. Increased choline signal coinciding with malignant degeneration of cerebral gliomas: a serial proton magnetic resonance spectroscopy imaging study. Journal of Neurosurgery. 1997;87(4):516–524. doi: 10.3171/jns.1997.87.4.0516. [DOI] [PubMed] [Google Scholar]
- 11.Tarnawski R, Sokol M, Pieniazek P, Maciejewski B, Walecki J, Miszczyk L, Krupska T. 1H-MRS in vivo predicts the early treatment outcome of postoperative radiotherapy for malignant gliomas. International Journal of Radiation Oncology, Biology, Physics. 2002;52(5):1271–1276. doi: 10.1016/s0360-3016(01)02769-9. [DOI] [PubMed] [Google Scholar]
- 12.Rothman DL, Behar KL, Hetherington HP, Shulman RG. Homonuclear 1H double-resonance difference spectroscopy of the rat brain in vivo. Proceedings of the National Academy of Sciences of the United States of America. 1984;81(20):6330–6334. doi: 10.1073/pnas.81.20.6330. [DOI] [PMC free article] [PubMed] [Google Scholar]
- 13.Wild JM, Marshall I. In vivo lactate editing in single voxel proton spectroscopy and proton spectroscopic imaging by homonuclear polarisation transfer. Magnetic Resonance Imaging. 1999;17(1):131–139. doi: 10.1016/s0730-725x(98)00138-6. [DOI] [PubMed] [Google Scholar]
- 14.Adalsteinsson E, Spielman DM, Pauly JM, Terris DJ, Sommer G, Macovski A. Feasibility study of lactate imaging of head and neck tumors. NMR in Biomedicine. 1998;11(7):360–369. doi: 10.1002/(sici)1099-1492(1998110)11:7<360::aid-nbm518>3.0.co;2-p. [DOI] [PubMed] [Google Scholar]
- 15.Shen J, Novotny EJ, Rothman DL. In vivo lactate and beta-hydroxybutyrate editing using a pure-phase refocusing pulse train. Magnetic Resonance in Medicine. 1998;40(5):783–788. doi: 10.1002/mrm.1910400520. [DOI] [PubMed] [Google Scholar]
- 16.Reese T, Norris DG, Leibfritz D. A fast method for in vivo lactate imaging. NMR in Biomedicine. 1995;8(5):225–231. doi: 10.1002/nbm.1940080507. [DOI] [PubMed] [Google Scholar]
- 17.Adalsteinsson E, Spielman DM, Wright GA, Pauly JM, Meyer CH, Macovski A. Incorporating lactate/lipid discrimination into a spectroscopic imaging sequence. Magnetic Resonance in Medicine. 1993;30(1):124–130. doi: 10.1002/mrm.1910300119. [DOI] [PubMed] [Google Scholar]
- 18.Marjanska M, Henry PG, Bolan PJ, Vaughan B, Seaquist ER, Gruetter R, Uurbil K, Garwood M. Uncovering hidden in vivo resonances using editing based on localized TOCSY. Magnetic Resonance in Medicine. 2005;53(4):783–789. doi: 10.1002/mrm.20425. [DOI] [PMC free article] [PubMed] [Google Scholar]
- 19.Lei H, Dunn J. The effects of slice-selective excitation/refocusing in localized spectral editing with gradient-selected double-quantum coherence transfer. Journal of Magnetic Resonance. 2001;150(1):17–25. doi: 10.1006/jmre.2001.2304. [DOI] [PubMed] [Google Scholar]
- 20.de Graaf RA, Luo Y, Terpstra M, Garwood M. Spectral editing with adiabatic pulses. Journal of Magnetic Resonance Series B. 1995;109(2):184–193. doi: 10.1006/jmrb.1995.0008. [DOI] [PubMed] [Google Scholar]
- 21.Lei H, Peeling J. Simultaneous lactate editing and observation of other metabolites using a stimulated-echo-enhanced double-quantum filter. Journal of Magnetic Resonance. 1999;137(1):215–220. doi: 10.1006/jmre.1998.1684. [DOI] [PubMed] [Google Scholar]
- 22.Keltner JR, Wald LL, Ledden PJ, Chen YC, Matthews RT, Kuestermann EH, Baker JR, Rosen BR, Jenkins BG. A localized double-quantum filter for the in vivo detection of brain glucose. Magnetic Resonance in Medicine. 1998;39(4):651–656. doi: 10.1002/mrm.1910390420. [DOI] [PubMed] [Google Scholar]
- 23.Jouvensal L, Carlier PG, Bloch G. Practical implementation of single-voxel double-quantum editing on a whole-body NMR spectrometer: localized monitoring of lactate in the human leg during and after exercise. Magnetic Resonance in Medicine. 1996;36(3):487–490. doi: 10.1002/mrm.1910360325. [DOI] [PubMed] [Google Scholar]
- 24.Lazeyras F, Terrier F, Aue WP, Frey FJ, Howarth N. Measurement of lactate in acutely ischemic rat kidneys using magnetic resonance spectroscopy. Investigative Radiology. 1994;29(1):24–30. doi: 10.1097/00004424-199401000-00003. [DOI] [PubMed] [Google Scholar]
- 25.Kingsley PB. Scalar coupling and zero-quantum coherence relaxation in STEAM: implications for spectral editing of lactate. Magnetic Resonance in Medicine. 1994;31(3):315–319. doi: 10.1002/mrm.1910310311. [DOI] [PubMed] [Google Scholar]
- 26.He Q, Shungu DC, van Zijl PC, Bhujwalla ZM, Glickson JD. Single-scan in vivo lactate editing with complete lipid and water suppression by selective multiple-quantum-coherence transfer (Sel-MQC) with application to tumors. Journal of Magnetic Resonance Series B. 1995;106(3):203–211. doi: 10.1006/jmrb.1995.1035. [DOI] [PubMed] [Google Scholar]
- 27.Cunningham CH, Vigneron DB, Chen AP, Xu D, Hurd RE, Sailasuta N, Pauly JM. Design of symmetric-sweep spectral-spatial RF pulses for spectral editing. Magnetic Resonance in Medicine. 2004;52(1):147–153. doi: 10.1002/mrm.20116. [DOI] [PubMed] [Google Scholar]
- 28.Goelman G, Wlater G, Leigh JS. Hadamard Spectroscopic Imaging Technique as Applied to the Study of Calf Muscle. Magnetic Resonance in Medicine. 1992;25(2):349–354. doi: 10.1002/mrm.1910250214. [DOI] [PubMed] [Google Scholar]
- 29.Gonen O, Arias-Mendoza F, Goelman G. 3D localized in vivo 1H spectroscopy of human brain by using a hybrid of 1D-Hadamard with 2D-chemical shift imaging. Magnetic Resonance in Medicine. 1997;37(5):644–650. doi: 10.1002/mrm.1910370503. [DOI] [PubMed] [Google Scholar]
- 30.Lei H, Peeling J. Multiple-voxel double-quantum lactate-edited spectroscopy using two-dimensional longitudinal Hadamard encoding. Magnetic Resonance in Medicine. 1999;42(1):19–23. doi: 10.1002/(sici)1522-2594(199907)42:1<19::aid-mrm4>3.0.co;2-t. [DOI] [PubMed] [Google Scholar]
- 31.Goelman G, Leigh JS. Multiband Adiabatic Inversion Pulses. Journal of Magnetic Resonance A. 1993;101(2):136–146. [Google Scholar]
- 32.Goelman G. Two Methods for Peak RF Power Minimization of Multiple Inversion-Band Pulses. Magnetic Resonance in Medicine. 1997;37(5):658–665. doi: 10.1002/mrm.1910370506. [DOI] [PubMed] [Google Scholar]
- 33.Mohammad RM, Wall NR, Dutcher JA, Al-Katib AM. The addition of bryostatin 1 to cyclophosphamide, doxorubicin, vincristine, and prednisone (CHOP) chemotherapy improves response in a CHOP-resistant human diffuse large cell lymphoma xenograft model. Clinical Cancer Research. 2000;6(12):4950–4956. [PubMed] [Google Scholar]
- 34.Aboagye EO, Bhujwalla ZM, He Q, Glickson JD. Evaluation of lactate as a 1H nuclear magnetic resonance spectroscopy index for noninvasive prediction and early detection of tumor response to radiation therapy in EMT6 tumors. Radiation Research. 1998;150(1):38–42. [PubMed] [Google Scholar]
- 35.He Q, Bhujwalla ZM, Maxwell RJ, Griffiths JR, Glickson JD. Proton NMR observation of the antineoplastic agent Iproplatin in vivo by selective multiple quantum coherence transfer (Sel-MQC) Magnetic Resonance in Medicine. 1995;33(3):414–416. doi: 10.1002/mrm.1910330315. [DOI] [PubMed] [Google Scholar]
- 36.Muruganandham M, Koutcher JA, Pizzorno G, He Q. In vivo tumor lactate relaxation measurements by selective multiple-quantum-coherence (Sel-MQC) transfer. Magnetic Resonance in Medicine. 2004;52(4):902–906. doi: 10.1002/mrm.20206. [DOI] [PubMed] [Google Scholar]
- 37.Goelman G, Leigh JS. Hadamard Spectroscopic Imaging Technique Insensitive to Pulse Imperfections. Journal of Magnetic Resonance A. 1993;105(1):78–81. [Google Scholar]


