
Figure 5.
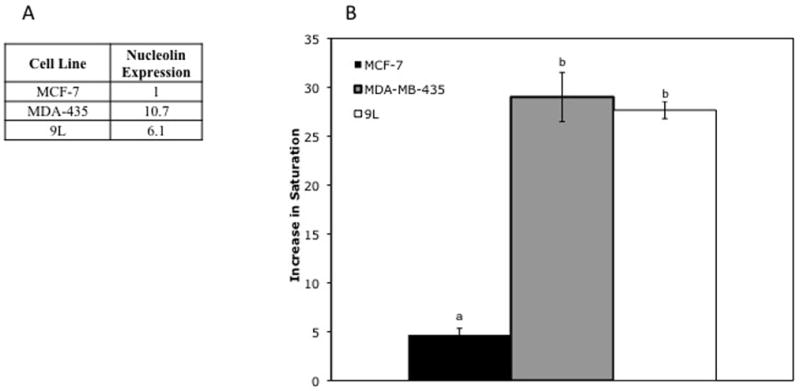
5A) Relative nucleolin expression: Nucleolin expression was estimated based on uptake of fluorescent F3 peptide by each cell line. All values shown are average fold-increase of uptake of fluorescent peptide by MCF-7 cells. Values shown for MDA-435, and 9L represent a significant increase in fluorescence compared to MCF-7 cells.
5B) Relative increase in glioma cell saturation after treatment with targeted vs. non-targeted NPs: Significant differences (P < 0.005), based on unpaired t-tests, comparing MCF-7, 9L, and MDA-MB-435 cells are indicated by letters above each data point. Points with statistically significant differences have different letters, while those that are statistically identical share a letter. Error bars indicate standard error of mean.