

Abstract
Background
The information processing demands associated with behavioral self-management of diabetes are extensive. Pairing personal digital assistant (PDA)-based self-monitoring with a behavioral self-management intervention may improve adherence and patient outcomes.
Methods
ENHANCE is a randomized controlled trial to test an intervention designed to improve regimen adherence in adults with type 2 diabetes. The intervention, based on Social Cognitive Theory (SCT), is paired with PDA-based self-monitoring. In this paper we describe the: (a) manner in which PDA-based self-monitoring is integrated within the SCT-based intervention, (b) feasibility and acceptability of PDA-based dietary self-monitoring, and (c) issues encountered in teaching participants to self-monitor using a PDA.
Results
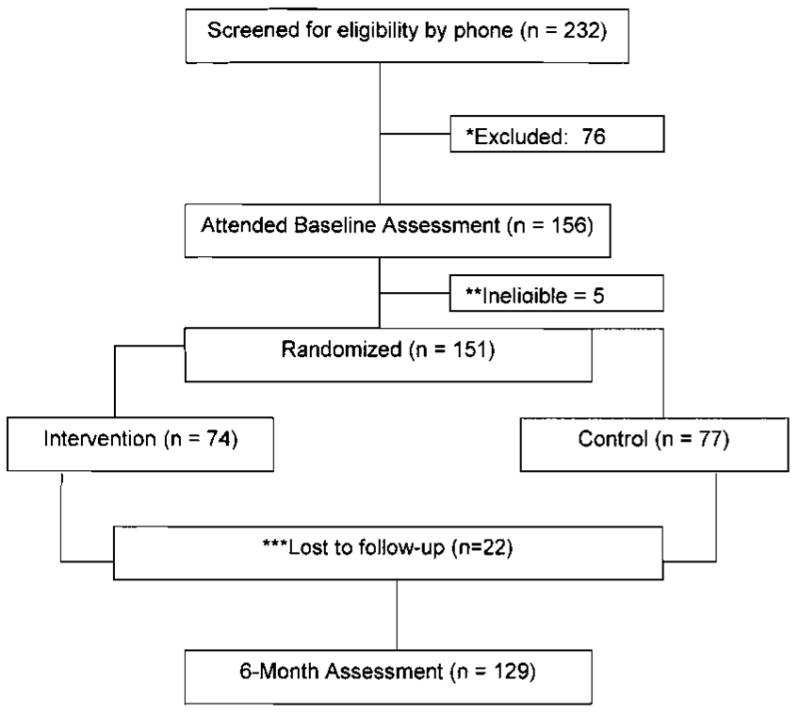
During the first 30 months of this 5-year study, 232 participants were screened and 151 were randomized. To date, 6 cohorts have completed the study. The retention rate is 85% (n=129). Of those randomized to the intervention (n=74) and completing the study (n=61), 88% reported understanding the usefulness of PDA-monitoring, 85% reported ease in entering foods into the device, 70% reported ease in interpreting feedback graphs, and 82% indicated that they would continue to use the PDA for self-monitoring after the study concluded. Assuming 3 meals per day, participants entered an average of 58% of their meals in their PDA, and 43% were entered assuming 4 meals per day. If we eliminate from the analysis those individuals who entered less than 10% of their expected meals (n=12), the average rate of self-monitoring was 69% assuming 3 meals per day, and 52% assuming 4 meals per day.
Conclusions
PDA-based dietary monitoring is perceived by participants to be useful and acceptable. The approach used to instruct participants in use of the PDA and lessons learned are discussed. PDA technology shows promise as a tool for assisting those with type 2 diabetes in their efforts to manage their disease.
Keywords: diabetes mellitus, type 2, self care, computers, handheld, personal digital assistant, randomized clinical trial, behavioral research, adherence
I. Introduction and background
Diabetes mellitus is a group of metabolic diseases characterized by hyperglycemia resulting from defects in insulin secretion, insulin action, or both.[1] Type 2 diabetes, the most common form of the disease, is caused by a combination of resistance to insulin action and inadequate compensatory insulin secretion.[1] Approximately 798,000 new cases of diabetes are diagnosed each year, with 90% of these cases being type 2.[2]
Nutritional therapy in type 2 diabetes seeks to achieve and maintain recommended levels for blood glucose and lipids, and blood pressure. The American Diabetes Association (ADA) dietary recommendations for those with type 2 diabetes include: a moderate calorie restriction; a weight loss of 5–7% of starting weight if overweight; and uniform spacing of nutrient intake throughout the day. Protein should provide 10–20% of daily calories, carbohydrates 60–70%, saturated fats less than 7% of total calories, polyunsaturated fats 10%, and monounsaturated fat intake should be increased.[3] The percentage of calories from fat is dependent upon treatment goals for lipids and body weight. Finally, ADA recommendations state that sodium intake should be reduced to 2,400 mg per day or less.[4,5] Those who also have chronic kidney disease (CKD) may have additional dietary restrictions (e.g., sodium, protein, potassium and phosphorus) depending on the stage of disease. In addition to a complex diet, most people with type 2 diabetes require at least one oral agent and sometimes insulin to reduce blood glucose. Nearly 71% of individuals with diabetes have hypertension [6] and, so, will also be prescribed one or more antihypertensive agents. Exercise may contribute to the normalization of blood glucose by improving insulin sensitivity.[7] Finally, patients are strongly encouraged to monitor blood glucose; examine skin integrity; obtain regular foot, eye and dental exams; and monitor and report complications of diabetes and associated medical conditions.
The diabetes self-management regimen is both a behavioral and information processing challenge. Following the regimen requires behavior change on the part of the patient – including initiating new behaviors, modifying existing behaviors, and eliminating unhealthy behaviors. Researchers and clinicians know that such changes are difficult to initiate and sustain, particularly with regard to long-standing behaviors such as dietary habits that have developed over a lifetime. Factors important to successful behavior change include the perceived costs and benefits of behavior change, perceived attitudes of one’s reference group to the behavior change, and the person’s perception that they are capable of performing the required behavior under a variety of circumstances.[8]
Even the best-informed, highly motivated, self-confident person with type 2 diabetes may fail in their efforts at self-management due to the complexity of information that must be manipulated for making good self-management decisions. For sustained behavior change, those with diabetes must remain vigilant regarding their dietary intake on a daily basis. However, scientists in the field of behavioral decision theory have found that as newly adopted behaviors become routine, the person begins to pay less attention to what they are doing.[9,10] Consequently, the dietary regimen may be followed carefully by a person with newly diagnosed diabetes as they adjust to their self-management regimen. They may read food labels and sources of nutritional information and adjust their dietary habits to be adherent to the regimen. However, such vigilance is burdensome and unlikely to be sustained. Researchers who are familiar with this phenomenon (referred to in the literature as “mindlessness”) recommend procedures to reduce the information processing demands imposed by vigilance tasks and the stress associated with such tasks, as well as making information that is required for good problem solving readily available.
Limitations in short term memory may also serve as a barrier to adherence. In their seminal work, Newell and Simon found that the average individual is able to maintain about 7 bits of information in short-term memory [11,12]. Short-term memory provides the individual with an internal representation of their current situation. For example, in evaluating what to eat for dinner, the person with diabetes should consider his or her current glycemic condition and energy expenditures; evaluate a broad range of nutritional values for previous, current, and planned meals; and anticipate the glycemic impact of foods that he or she plans to eat. Thus, in making good dietary decisions, the amount of information that must be manipulated is immense.
Minimizing the complexity of information processing associated with self-management should facilitate vigilance and, consequently, the behavior changes required of patients. In this era of expanding computer-based technologies, a number of tools have become available to help people manage information. One of these, the personal digital assistant or PDA, is a small hand-held computer. In our examination of the literature, only a handful of articles discussed the use of PDAs by patients to assist with self-management of a chronic disease.[13] Moreover, only one study was found in which PDA-based interventions were used in patients with diabetes. In this pilot study, Tsang et al. showed a significant reduction in hemoglobin A1c when diabetic patients used an electronic diabetes monitoring system via a handheld electronic diary to track meal portions and blood glucose readings over a 6-month period as compared with the usual paper-based tracking method.[14] A recent symposium presented at the Society of Behavioral Medicine concluded that PDA intervention capacities are just beginning to be tapped, and that their convenience and portability can enhance adherence to self-monitoring required by most behavioral treatments.[15] However, limited empirical information is available regarding how PDAs may be incorporated into traditional behavioral change interventions to enhance adherence to the diabetes regimen.
II. Objectives
The purpose of the ENHANCE Study was to evaluate a behavioral intervention, based on Social Cognitive Theory (SCT) [16], designed to foster adherence of individuals with type 2 diabetes to their self-management regimen. The primary aim of the study was to determine the extent to which the intervention resulted in improved behavioral adherence to the diabetes regimen and, consequently, to better clinical outcomes. The investigators also examined the impact of the intervention on perceived self-efficacy and variation in outcomes with regard to baseline glycemic control and nephrovascular health.
The SCT-based behavioral intervention was paired with PDA-based self-monitoring to minimize the information processing burden associated with maintaining vigilance surrounding diabetes self management tasks. In this paper we provide a brief overview of the study methods. Because of the unique nature of the intervention, we devote special attention to: (a) the manner in which PDA-based self-monitoring is integrated within a behavioral intervention to enhance adherence to the diabetes regimen, (b) the feasibility and acceptability of PDA-based dietary self-monitoring, and (c) issues encountered in teaching participants how to self-monitor using a PDA. Data from the first 6 cohorts having completed the study are presented.
III. Methods
A. Design
The ENHANCE Study was a single center, randomized controlled trial of adults with type 2 diabetes who are seeking help with diabetes management. The 6-month intervention was tested in three groups of individuals with type 2 diabetes: (1) those with HbA1c <8% and no evidence of chronic kidney diseases (or CKD, i.e., an estimated glomerular filtration rate (eGFR) > 60 ml/min), (2) those with HbA1c ≥8% and no evidence of CKD, and (3) those with diabetes and evidence of CKD (eGFR ≤ 60 ml/min) regardless of HbA1c. We included those with good glycemic control as well as those with concurrent kidney disease as these individuals are often excluded from diabetes intervention studies.
B. Recruitment, Screening, and Enrollment Procedures
Study participants were recruited between September 2004 and December 2006 using a variety of methods including newspaper advertisements, fliers placed in physician offices, announcements delivered through the University of Pittsburgh voicemail system, and study posters placed in pharmacies, grocery stores, and on public buses.
All participants were initially screened by telephone. The manual dexterity requirements of performing capillary glucose checks are similar to those required to use a PDA stylus, and the font size for BalanceLog is comparable to newspaper print. Thus, we eliminated those who reported difficulty reading a newspaper, as well as those who stated that they were unable or unwilling to perform capillary glucose checks. As a result of our screening procedures no study participant was recruited to the study who was physically unable to self-monitor using a PDA. We did not screen for computer literacy as we are aware of no method that accurately predicts ability to perform PDA dietary self-monitoring, and did not want to unduly restrict recruitment. Table 1 lists inclusion and exclusion criteria for the study.
TABLE 1.
Inclusion and Exclusion Criteria
| Inclusion | Exclusion |
|---|---|
|
|
We notified each participant’s primary care physician (by letter) of their patient’s involvement in the study, with a request to notify study staff with contraindications to participation. Eligible participants were scheduled for a baseline fasting assessment visit at the outpatient facilities of the Clinical Translational Research Center (CTRC) at the University of Pittsburgh, with repeat assessments scheduled at 3 and 6 months. The recruitment and retention history is graphically displayed in Figure 1.
FIGURE 1.
Consort Table
C. Measurements
Table 2 outlines the various measures obtained at each time point [17–26]. Two weeks prior to their baseline assessment visit, eligible participants were sent a packet of questionnaires, a 3 day-food diary and a consent form for review. At the baseline assessment CTRC visit, signed informed consent was obtained. The packet of questionnaires and the 3-day food diary were collected from participants and reviewed for completeness. Laboratory samples and biophysiologic measures were obtained. Resting metabolism was calculated using the Harris Benedict Equation [27] and body composition estimated via bioelectrical impedance. Participants received a light breakfast following fasting procedures. Parking vouchers or bus passes were provided as needed. At the completion of the assessment visit, participants were given a $20 gift certificate to a local grocery store. This process was repeated at 3 and 6 months, with the exception that participants were requested to return their survey packets by mail, in advance of their appointment. (Mail return of 3- and 6-month questionnaires allowed study staff to review the questionnaires and 3-day food diaries for completeness prior to the CTRC assessment visit, thus streamlining the appointment).
TABLE 2.
Schedule of measurements
| Variable | Measurement | Month | ||||||
|---|---|---|---|---|---|---|---|---|
| Baseline | 1 | 2 | 3 | 4 | 5 | 6 | ||
| Dietary adherence | Three-day dietary diaries entered into the Nutrient Data System [17] | X | X | X | ||||
| Physical activity | Community Healthy Activities Model Program for Seniors questionnaire (CHAMPS) [18] | X | X | X | ||||
| Blood glucose control, fasting blood glucose | HbA1c, fasting blood glucose | X | X | X | ||||
| Cardiovascular risk factors | LDL, HDL, triglycerides, blood pressure | X | X | X | ||||
| Body composition | Weight, height, waist circumference, bioelectrical impedance analysis | X | X | X | ||||
| Self efficacy | Multidimensional Diabetes Questionnaire [19] | X | X | X | ||||
| Quality of Life | Outcomes Study 12-Item Short-Form Health Survey (SF-12) [20], and the Audit of Diabetes Dependent Quality of Life (ADDQoL) [21] | X | X | X | ||||
| Medication changes | Investigator-developed medication inventory | X | X | X | ||||
| Depression | Beck Depression Inventory-II [22] | X | X | X | ||||
| Treatment satisfaction | Diabetes Treatment Satisfaction Questionnaire [23] | X | X | X | ||||
| Health Literacy | Rapid Estimate of Adult Literacy in Medicine (REALM) [24] | X | ||||||
| Social Support | Chronic Illness Resources Survey [25] | X | X | X | ||||
| Severity of Disease | Rigler comorbidity checklist [26] | X | ||||||
| General Characteristics | General Health and Sociodemographics | X | ||||||
| Kidney function | Urine albumin:creatinine ratio | X | X | X | ||||
| Feasibility/acceptability | PDA dietary self-monitoring acceptability questionnaire | X | ||||||
D. Randomization
After completion of the baseline assessment visit, participants were stratified according to the three groups described above: (1) HbA1c <8% and no CKD, (2) HbA1c ≥8% and no CKD, or (3) presence of CKD regardless of baseline HbA1c. Within these strata, participants were allocated to either the treatment group or to an attention control group using permuted block randomization. Seven participants presented to the study with a significant other who also had type 2 diabetes. When this occurred, one person was randomly selected from the pair and randomized. (While both participants were permitted to remain in the study, the outcome data for the accompanying, nonrandomized participant will not be considered in the final analysis). The experiences of the control groups were designed to minimize attention bias, sustain interest in the study, and retain participants through the 6-month assessment visit.
With informed consent participants were told that they would be expected to self-monitor their dietary intake. However, to minimize cross-over, participants were not informed that their dietary self-monitoring was to be performed using a PDA. To our knowledge, no control group participant purchased comparable PDA technology and software contemporaneous with the study. Intervention and attention control group experiences are outlined in Table 3.
TABLE 3.
Intervention and Attention Control Group experiences
| Intervention Group | Attention Control Group |
|---|---|
|
|
|
| |
| ✓ 13 group meetings with SCT-based self-management intervention | ✓ 6 monthly contacts including 3 group meetings: |
| - Weekly for months 1–2 | - Month 1 – Basics of diabetes self-management |
| - Biweekly for month 3–4 (including a stress management seminar) | - Month 2 – Lay diabetes journal |
| - Monthly for months 5–6 (including an executive chef demonstration) | - Month 3 – Stress management |
| - Month 4 – Lay diabetes journal | |
| - Month 5 – Executive chef demonstration | |
|
| |
| ✓ Baseline, 3- and 6-month laboratory measurements are sent to physicians, along with glucose meter reports uploaded at 3 and 6 month assessment visits. | ✓ Baseline, 3- and 6-month laboratory measurements are sent to physicians, along with glucose meter reports uploaded at 3 and 6 month assessment visits. |
|
| |
| ✓ Birthday and seasonal greetings. | ✓ Birthday and seasonal greetings |
|
| |
| ✓ Parking vouchers or bus passes | ✓ Parking vouchers or bus passes |
E. Intervention
The behavioral component of the intervention was based on Bandura’s Social Cognitive Theory (SCT). [16] According to SCT, behavior change and maintenance are strongly influenced by the individual’s perceived self-efficacy, which is defined by Bandura as a belief in one’s capabilities to successfully overcome the demands of a situation in order to achieve a desired outcome. Successfully completed tasks in the past or mastery accomplishments are the most dependable and influential sources of information for increasing levels of self-efficacy, where successful experiences tend to enhance self-efficacy and past unsuccessful experiences serve to decrease self-efficacy.[16] With regard to diabetes management, mastery experiences would include incremental goal setting, self-monitoring, feedback regarding goal achievement, and developing participant expertise in both the regimen and in problem-solving around barriers to adherence.
The PDA increases mastery by: (1) enabling vigilance to the management regimen while minimizing information burden, (2) providing immediate meal-by-meal feedback regarding achievement of goals for diet and physical activity, and (3) permitting straight-forward integration of information regarding energy intake, energy expenditure and distribution of calories from protein, fat, and carbohydrates. These factors are directly linked to SCT in that participants are likely to experience greater success in managing their disease by minimizing the information processing demands and the burden of vigilance requirements that are required in making and sustaining behavior change.
As noted in Table 3, the intervention involved group meetings of 10–15 participants. Meetings decreased in frequency over the 6-month intervention to permit participants to become more independent in their application of self-management skills acquired through the intervention, e.g., weekly for 2 months, biweekly for 2 months, and monthly for 2 months. At least two interventionists were present at each meeting, with one assuring that SCT-based concepts were applied within the group session, and the other being a content expert in diabetes material that was introduced at that particular meeting (e.g. dietitian, diabetes educator, exercise physiologist, stress management instructor, or chef). During the group meetings, participants shared progress made toward their goals and barriers they encountered. Participants helped each other problem-solve around difficulties they experienced with the various aspects of the regimen that were discussed. At each meeting, glucose meter and PDA data were uploaded and hard-copy feedback reports were generated and distributed. Participants were assisted in interpreting their reports and encouraged to use the reports to develop explicit goals related to diabetes self-management that they would like to achieve before the next meeting. These reports were provided to participants at their next meeting. Print-outs of electronic dietary data, physical activity, and glucose meter results were also reviewed by two certified diabetes educators (CDEs, one dietitian and one nurse), who provided written feedback in relation to the participants’ goals. (NOTE: In the first 2 cohorts of the study, feedback was provided primarily by telephone. Because of difficulties experienced in our ability to access participants by telephone, the investigators altered the feedback process to involve written summaries based on glucose results and dietary logs). Participants were encouraged to contact the CDEs by telephone with questions related to the feedback.
The same intervention content was delivered in all group sessions regardless of pre-randomization status of the participants (i.e. whether or not they had good glycemic control and whether or not they had CKD). Individualization in the intervention occurred in the manner in which the participant’s PDA was programmed to their dietary requirements, and in written feedback provided to them by the study CDEs.
E.1. PDA hardware and software
The investigators used a PalmOne Tungsten/E2 PDA with BalanceLog® software by MicroLife. BalanceLog® contained a food database of more than 4300 foods-including over 1700 major brand names. MicroLife used the current nutrient composition data from the United States Department of Agriculture, and monitored brand name and restaurant data to ensure that the program used the most current data.
In addition to the extensive food database, participants were able to add their own meals and recipes to the program. Standard serving size was the default setting on the program. However, participants had the ability to change portion and serving sizes so that they could accurately record the size of their meal. Prior to training, BalanceLog® was programmed for the individual calorie and nutrient requirements for each participant, based on the guidelines of the ADA, and estimated energy needs based on resting calorie expenditure and usual activity level. [4,5,27] Using a standardized training approach developed with a preliminary study [28,29] participants were taught how to search the database, enter foods they ate, and examine (meal-by-meal and day-by-day) the extent to which they achieved their dietary goals for total calories; calories from saturated fats and unsaturated fats, carbohydrates, and proteins; sodium, sugar; and fiber. Participants were able to examine the extent to which they met dietary goals, which were presented as percent of goal achieved per meal and per day for several nutrients. BalanceLog® also permitted the participant to enter daily exercise from a large database of physical activities. The program calculated the calories expended from exercise, and subtracted it from the participant’s “calorie budget.”
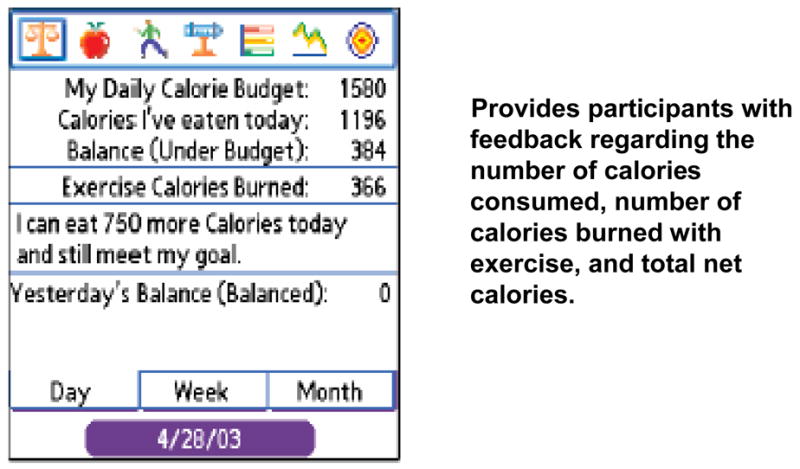
Example screen shots from our BalanceLog® training PowerPoint slide presentation appear below. Figure 2 shows the Calorie Budget Page. Participants were instructed to use this page to obtain cumulative information about net calories consumed (i.e., considering the number of calories consumed minus the number of calories burned with exercise).
FIGURE 2.
The Balance Scale Page
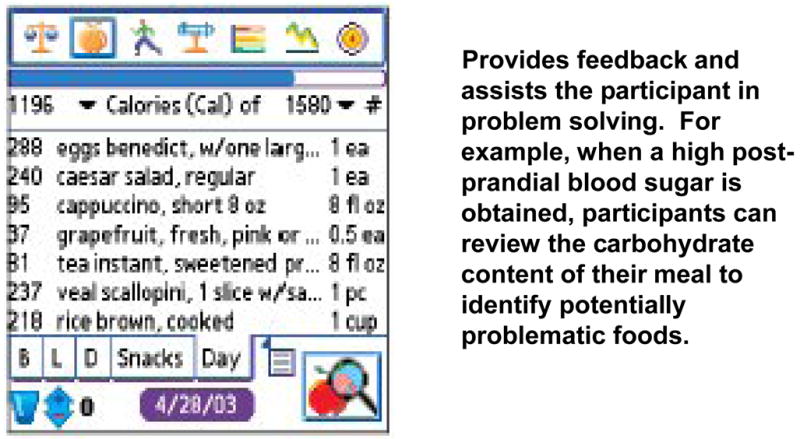
Figure 3 shows the Food Log Page, which participants were instructed to use for viewing dietary intake according to a variety of nutrients. In the figure, the number of calories contributed by each logged food is shown. By clicking on the drop-down arrow to the right of “calories” participants were instructed to view the content of their dietary log in terms of other nutrients, such as carbohydrates, fat, or saturated fat. Finally, on the right hand side of the Food Log Page, another drop-down arrow can be seen, which participants were instructed to use for viewing nutritional content of each food in terms of amount (such as grams of carbohydrates, which is useful for those who count carbohydrates) or percent of dietary target contributed by each logged food.
FIGURE 3.
The Food Log Page
Figure 4 shows the Nutrition Facts page, which appeared each time a participant searched and selected a particular food from the database. Serving size and units on the Nutrition Facts page could be changed, with nutritional content automatically recalculated. The participant was shown how to increase/decrease the serving size by touching on the upper/lower half of each number. Using the drop-down arrows, the participant was shown how to switch the measurement unit (e.g., from ounces to cups). Participants were encouraged to view Nutrition Facts pages prior to making food selections. For example, in making a choice regarding the type of popcorn to consume, participants could compare the nutritional content of air-popped versus oil popped popcorn.
FIGURE 4.

The Nutrition Facts Page
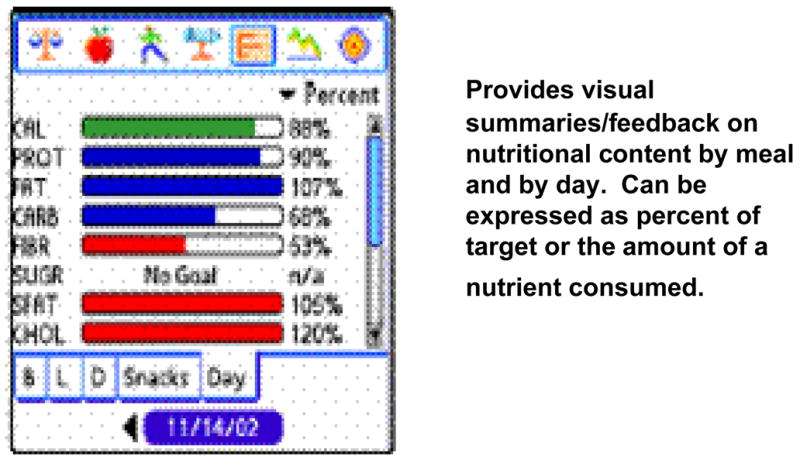
Figure 5 shows the Nutrition Graph page, which participants were instructed to use for viewing the percent of nutritional targets consumed, by meal or by day. (Additional graph bars for sodium, vitamins A & C, iron, and fiber can be viewed by scrolling down the screen using the scroll bar on the right hand side of the page). Participants were taught to check their Nutrition Graph page after each meal, and were encouraged to moderate the rate at which they filled their calorie and carbohydrate graph bars over the course of the day, and were instructed to consume approximately 100% of their dietary targets for each nutrient.
FIGURE 5.
The Graph Page
E.2. Procedures employed for training participants in PDA-based dietary monitoring
Training in PDA-based self-monitoring occurred in the 2nd and 3rd group sessions. The training sessions were staffed with approximately 1 instructor for every 3–4 participants. In this initial training session, participants were given a simple meal and shown how to enter that meal into BalanceLog®, using a PowerPoint slide presentation. As the slides were viewed, participants entered the example meal into their own individually programmed PDAs. Participants were given a homework assignment to enter 1 meal a day for the next 7 days until they returned for the next intervention session. In the second training session, participants were shown more features of the BalanceLog®, such as how to add new foods, delete a mistake, create menus, and further interpret the feedback graphs. Three to four hours were required to teach dietary self-monitoring in a group setting with participants who had little or no prior experience with PDAs.
For all sessions subsequent to the 2 PDA training, PDAs were collected at the beginning of the meeting for uploading into a desktop computer. They were not returned to participants until they departed from the session. Those participants who had difficulty with the PDA were encouraged to confer with study staff by telephone, or were scheduled for 1:1 training at a time other than the group sessions. By isolating PDA training in this manner, we minimized the potential for the PDA to distract participants from the SCT principals and self-management content delivered during the sessions. Also, by limiting additional training to 1:1 contacts, participants had the opportunity to gain confidence in using the PDA without revealing to the group that they experienced difficulty in using the technology.
IV. Observations regarding the use of BalanceLog® within the SCT-based behavioral intervention
The investigators used PDA-based dietary self-monitoring to support the SCT-based intervention in a variety of ways. First, the PDA self-monitoring enhanced the accuracy with which participants estimated caloric intake and expenditure. Lightman et al., found that obese individuals under-estimate their calorie intake and over-estimate calories burned from physical activity.[30] By using PDA self-monitoring, participants could obtain visual feedback regarding the extent to which they underestimated their calorie, fat, and/or carbohydrate intake, and overestimated their energy expenditure.
Second, PDA self-monitoring enhanced vigilance to the dietary regimen by providing participants with information that could help them make conscientious dietary decisions. Portion size in the US has gradually increased since the 1970s and has been suggested to play a role in increased body weight. [31] Within the intervention, participants were trained in portion size, and the process of logging foods into the PDA in real-time prompted the individual to pay attention to the quantity of food being consumed, which facilitated success in achieving dietary and weight goals.
Third, dietary logs from the PDA combined complex information in an easily interpretable form, thus enabling successful problem solving. In particular, participants were taught to combine dietary records with glucose meter results for problem solving around glycemic control issues. When a participant had a high or low glucose reading, they were instructed to examine the Food Log page. As noted above, by clicking on the nutrient category at the top of the page (“Calories” in Figure 3 above) they could scroll down to “carbohydrates” to reveal the percent of target for carbohydrates contributed by each food logged and locate those foods that may have contributed the most to their glycemic problem. They could also scroll through the saturated fat content to identify foods that may have increased insulin resistance.
Fourth, the PDA records were used to provide positive reinforcement to participants when they achieved their goals, and also to assist them in identifying problem behaviors and the need to revise goals. The Balance Scale page provided participants with information about the number of calories that they were under or over budget by the day, by the week, and for the month. Participants were also shown how to distribute their carbohydrate intake over the course of the day, eating a balance of proteins, fats and carbohydrates with each meal. Visually, on the Graph page, participants were told that they should see the protein, fat, and carbohydrate graph bars fill gradually and approximately equally over the course of the day. Participants were taught to use the Graph page to obtain feedback and positive reinforcement of their efforts to control their dietary intake. With each group meeting, electronic logs of dietary intake and glucose meter results were also uploaded to a computer and printed-out for review by the two CDEs. The CDEs provided additional positive reinforcement regarding the extent to which the participants met their goals, and provided tips for better self-management.
Finally, using the PDA throughout the intervention set the stage for self-management after the conclusion of the study. Participants were advised that type 2 diabetes often progresses, and that current measures for controlling may become less effective in time. Also, because of the many factors that can influence blood glucose levels (e.g. medication changes, stress, illness, diet), they were advised of the importance of consistently checking their blood sugar, and circumstances in which they should consult their diabetes care provider. In order to maintain the progress they made during the study, continued self-monitoring was advised. In the event that self-monitoring was discontinued, participants were advised to re-initiate self-monitoring when they experienced changes in glycemic control, weight, eating patterns, or medication regimen, or when they experienced stressful life events or significant life changes (e.g. hospitalization, illness, divorce, relocation or retirement).
V. Feasibility and acceptability of PDA-based dietary monitoring
During the first 30 months of this 5-year study, 6 cohorts completed the study. One hundred and fifty-one individuals were randomized with 129 (85%) completing their 6-month assessment. No participant was lost due to difficulties experienced with the PDA self-monitoring (although not all participants used the PDA consistently).
At their 6-month assessment, intervention group participants completed an investigator-developed, 5-point likert-scaled instrument regarding the acceptability of PDA self-monitoring. Participants agreed that they understood the usefulness of PDA-monitoring (87.9%), that entering foods into the program was easy (84.8%), that feedback graphs were easily interpreted (69.7%), and that they would continue to use the PDA for self-monitoring after the study concluded (82%).
We examined self-monitoring rates in those completing the study. We abstracted the number of dietary entries made each day from BalanceLog® files created with each upload and entered these in an Excel spreadsheet.* BalanceLog® software provided the participants the option of entering 3 meals a day as well as a snack into their meal log. While not all participants consumed a daytime snack, if we conservatively assume 3 meals plus one snack per day (i.e., 4 meals), participants entered an average of 43% of their expected meals over the intervention (including the first 2 weeks in which participants were learning to use the PDA and were not expected to enter all meals). Assuming participants consumed 3 meals per day, participants entered an average of 58% of their expected meals in their PDA. If we eliminate from the analysis those individuals who entered less than 10% of their expected meals (n=12), under the assumption that participants consumed 4 meals a day, the average rate of self-monitoring was 52%, and was 69% under the assumption of 3 meals a day.
Few other investigators have reported on the use of PDAs for self-management of other conditions or on adherence to self-monitoring using a PDA. Glanz and colleagues reported on a one-month pilot study that was part of a randomized clinical trial targeting improving the diet. [32] They found that on 62% of all days, foods were entered in the PDA at least three times each day; for the other 38% of days, subjects entered foods twice per day. Burke et al. reported on adherence to self-monitoring using a paper diary that was unobtrusively equipped with a photosensor that detected when the diary was opened and closed. [33, 34] Study participants reported significantly more episodes of self-monitoring than what the photosensors detected, e.g., the mean number of self-reported diary entries made per day was 4.0 while the electronic diary revealed that Ss opened the diary on average 2.5 times per day during the first 6 months. In a behavioral weight loss program that included PDA-based self-monitoring, Yon et al. found that participants submitted weekly e-journals 52% of the time. [35] However, adherence was defined as the availability of a weekly record regardless of the completeness of that record. Unless all meals were entered every day, the frequency of self-monitoring in the study by Yon et al. is likely to be somewhat less than 52%.
Caution must be used in comparing rates of self-monitoring in these different studies due the complexity of the interventions in which they were implemented. With that being said, our rate of 58% of participants entering 3 meals per day is comparable to the rates found by Glanz et al. [35] and likely greater that the rates reported by Yon et al. [36]
VI. Implementing a SCT-based counseling intervention paired with PDA-based self-monitoring: Lessons Learned
ENHANCE study investigators and staff members encountered some challenges in implementing the intervention and teaching study participants to self-monitor their diet and physical activity using the PDA. First, participants required substantial education or reeducation regarding general diabetes self-management before additional SCT-based principles and goals could be introduced. In particular, at orientation we found that a significant number of participants did not routinely perform capillary glucose monitoring. Many participants were also unaware of the nature and action of their medications. For example, some participants who were prescribed oral medications to increase insulin production were not aware of the importance of taking these medications prior to meals. In addition, we encountered widespread misunderstanding regarding the diabetes diet. Consequently, in the early weeks of the intervention, session content emphasized the basics of self-management (e.g., How and when do I check my glucose? What is a normal glucose? What do I do when a glucose reading is low or high? What are carbohydrates, fats and proteins and how do they influence my blood sugar?). Later, as participants became more familiar with self-management and experienced with self-monitoring technologies, the interventionists were able to shift the emphasis of the session to goal-setting and problem-solving around particular self-management challenges.
Another challenge we experienced was incorporating the SCT content into the intervention. As discussed above, participants were assisted with setting goals, evaluating goal achievement, self-reinforcement, and re-setting goals as appropriate. However, it was sometimes difficult for participants to engage in goal setting regarding their self-management due to a very limited understanding of their disease. Consequently, we encouraged participants to set their goals around the basics of the intervention protocol (e.g., I will check my blood sugar twice each day between now and next week. I will enter 1 meal each day in my PDA.) As they discovered more about how diet, physical activity and glycemic control were related to each other, individualized goal setting around their self-management regimen became possible (e.g., I will pack my lunch 3 days this week instead of eating at fast food restaurants. Instead of two cans of soda per day I will drink one. I will try to swim over lunch time one day next week.)
A third challenge was participants who had difficulty using the PDA to monitor their foods. These individuals were typically elderly people, who had no experience with computers, and/or had problems with fine motor skills. When difficulties were encountered, we employed individual instruction. We demonstrated, on our own PDAs, how to enter a meal that had been eaten by the participant, while the participant followed along on their own PDA. This approach was generally successful. Only 12 participants “gave-up” on the PDA, and entered less than 10% of their expected meals. When this occurred, participants were, nevertheless, encouraged to remain in the study.
A final challenge we encountered was providing timely goal-directed feedback to participants. Participants set goals related to their self-management, and the interventionists provided feedback on goal achievement or provided tips for getting back on-track when participants had not achieved their goals. We attempted to accomplish this by providing the CDEs with print-outs of uploaded data from the PDA and glucose meters as well as a list of goals as stated by the participant. However, there was often a time-lag in making this connection between goals and feedback due to a variety of factors including the time between intervention sessions, missed sessions, participants with rapidly changing goals and/or participants not turning-in goals in a timely manner. A next generation intervention that could address such a problem would be the development of interactive web-based programs or applications for wireless technology that permit participants to more conveniently communicate with the interventionist, thereby allowing for more timely review and feedback. In the current study, while the interventionists continued to review food logs and glucose results as soon as feasible, goal-directed feedback was provided primarily during group sessions during which participant shared their goals, successes, and problems. Group members praised the successes of others and helped others problem-solve around barriers to adherence. Participants were also encouraged to perform individual assessments of their own progress, reward themselves for goal achievement, problem-solve when they were not meeting their goals, and reset goals as needed.
VII. Use of BalanceLog and PDAs: Lessons Learned and Directions for Future Research
BalanceLog® was developed for personal use rather than for research purposes. The current program does not include a date and time stamp. Consequently, it was not clear to what extent participants back-filled [36] dietary entries (forward-filling is not possible). A date and time stamp would allow researchers to determine the extent to which participants perform self-monitoring in real-time, and whether timing of entries influence the effectiveness of the intervention. BalanceLog® entries were written to PDFs with each upload, rather than to a database that permitted analysis of dietary intake. Consequently it was not possible to analytically examine time trends in dietary patterns.
With older-generation Palm models of PDAs, dietary entries were lost if the device was not recharged in a timely manner. As a result, we do not have complete data on frequency of self-monitoring for 2 of the cohorts. In newer-generation PDA technologies, loss of battery power does not result in loss of data.
Finally, beyond dietary monitoring, PDA diabetes self-management could be facilitated further by software that incorporates capillary blood glucose tracking into the program. While it is not currently a feature on BalanceLog, the software is currently being revised by Microlife to accommodate glucose tracking. [37] Other software programs with glucose tracking features, such as Health Engage Diabetes and the Diabetes Pilot, are currently on the market. [38, 39]
Given the complexity of the behavioral approach used in the ENHANCE study, future research is needed to provide a more detailed insight into the strengths and limitations of using multifaceted interventions. Qualitative methods involving patient interviews and narratives should be used prospectively to identify the most important elements of these complex interventions, especially those elements that would better enable the participants to achieve their desired health goals. This detailed assessment would also allow investigators to isolate barriers that emerge during the intervention, thereby helping investigator to develop solutions to improve the interventions overall effectiveness. As additional participants are accrued, the ENHANCE investigators will be able to explore, quantitatively, predictors of adherence to self-monitoring.
Future interventions which rely on technology should also integrate a technology assessment plan into their protocol. This step would enable researchers to better assess the feasibility and acceptability of the technology as it is used within the context of the intervention. Employing methods from the field of cognitive ergonomics, future research should map the interface between the tasks participants are asked to accomplish and the technology itself. This step can provide important information, revealing how effectively the participants are able to interact with the technology which in turn can help determine whether the hardware and/or software can be improved to further strengthen the effectiveness of the intervention.
VIII. Conclusions
With this report we described a novel intervention that pairs PDA-based dietary self-monitoring with SCT-based group counseling to enhance adherence to the type 2 diabetes self-management regimens. PDA technology was portable and convenient. Training in the use of the PDA could effectively be performed in group sessions. Use of the PDA was deemed acceptable by the majority of participants, and the dietary software was inexpensive. When combined with a SCT-based behavioral intervention, PDA-based dietary self-monitoring may prove a practical method of enhancing perceived mastery over the diabetes self-management regimen.
TABLE 4.
Intervention Schedule
| Week | SCT Content | Diabetes Content |
|---|---|---|
| Week 1 |
|
|
| Week 2 |
|
|
| Week 3 |
|
|
| Week 4 |
|
|
| Week 5 |
|
|
| Week 6 |
|
|
| Week 7 |
|
|
| Week 8 |
|
|
| Week 10 |
|
|
| Week 12 |
|
|
| Week 14 |
|
|
| Week 18 |
|
|
| Week 24 |
|
|
Acknowledgments
The work of this paper was supported by the following grants: NIH/NINR/NR-R01008792, NIH/NCRR/CTSA-UL1-RR024153, and NIH/NCRR/GCRC-M01-RR000056 as well as through the Veterans Administration Health Services Research & Development Merit Review Entry Program Career Development Award. The authors would like to acknowledge the individual contributions of: Deborah Klinvex, BA; Tienna Luster; Beth Hall, RD; and Kathleen O’Malley, BA, BPhil
Footnotes
We have incomplete data in waves 2 and 4. Older-generation PDAs did not back-up BalanceLog® data when battery power was lost, and thus we were subsequently unable to retrieve these data. Data backup is a feature of newer-generation PDAs and, thus, this problem has been addressed for subsequent waves of the study. All available data are used in this analysis.
Publisher's Disclaimer: This is a PDF file of an unedited manuscript that has been accepted for publication. As a service to our customers we are providing this early version of the manuscript. The manuscript will undergo copyediting, typesetting, and review of the resulting proof before it is published in its final citable form. Please note that during the production process errors may be discovered which could affect the content, and all legal disclaimers that apply to the journal pertain.
References
- 1.The Expert Committee on the Diagnosis and Classification of Diabetes Mellitus, Report of the expert committee on the diagnosis and classification of diabetes mellitus. Diabetes Care. 2000;23:S4–S19. [PubMed] [Google Scholar]
- 2.National Institutes of Health. Diabetes Statistics in the United States. Bethesda, MD: 1999. Publication No. 99–3892. [Google Scholar]
- 3.American Diabetes Association. Nutrition Recommendations and Interventions for Diabetes. Diabetes Care. 2007;30:S48–S65. doi: 10.2337/dc07-S048. [DOI] [PubMed] [Google Scholar]
- 4.American Diabetes Association. Nutrition recommendations and principles for people with diabetes mellitus. Diabetes Care. 2000;24:S43–6. [PubMed] [Google Scholar]
- 5.American Diabetes Association. Evidence-Based Nutrition Principles and Recommendations for the Treatment and Prevention of Diabetes and Related Complications. Diabetes Care. 2002;25:S50–S60. doi: 10.2337/diacare.25.1.202. [DOI] [PubMed] [Google Scholar]
- 6.Geiss LS, Rolka DB, Engelgau MM. Elevated blood pressure among U.S. adults with diabetes, 1988–1994. Am J Prev Med. 2002;22:42–8. doi: 10.1016/s0749-3797(01)00399-3. [DOI] [PubMed] [Google Scholar]
- 7.American Diabetes Association. Diabetes mellitus and exercise. Diabetes Care. 2002;25:S64–S68. [Google Scholar]
- 8.Institute of Medicine of the National Academies. Theory. Chapter 2 in, Speaking of Health: Assessing Health Communication Strategies for Diverse Populations. Washington DC: The National Academies Press; 2002. [PubMed] [Google Scholar]
- 9.Sharps MJ, Martin SS. “Mindless” decision making as a failure of contextual reasoning. J Psychol. 2002;136:272–82. doi: 10.1080/00223980209604155. [DOI] [PubMed] [Google Scholar]
- 10.Langer EJ, Imber LG. When practice makes imperfect: debilitating effects of overlearning. J Pers Soc Psychol. 1979;37:2014–24. doi: 10.1037//0022-3514.37.11.2014. [DOI] [PubMed] [Google Scholar]
- 11.Newell A, Simon H. Human Problem Solving. Engelwood Cliffs: Prentice Hall, Inc.; 1972. [Google Scholar]
- 12.Newell A, Shaw JC, Simon HA. Elements of a theory of human problem solving. Psychol Rev. 1958;65:151–166. [Google Scholar]
- 13.Burke LE, Warziski M, Starrett T, et al. Self-monitoring dietary intake: current and future practices. J Ren Nutr. 2005;15:281–90. doi: 10.1016/j.jrn.2005.04.002. [DOI] [PubMed] [Google Scholar]
- 14.Tsang MW, Mok M, Kam G, et al. Improvement in diabetes control with a monitoring system based on a hand-held, touch-screen electronic diary. J Telemed Telecare. 2001;7:47–50. doi: 10.1258/1357633011936138. [DOI] [PubMed] [Google Scholar]
- 15.Spring B, Tate D. Personal Digital Assistant (PDA) as Behavioral Interventionist: Getting the Therapist into the Hip Pocket. Ann Behav Med. 2006;31:S185. [Google Scholar]
- 16.Bandura A. Self Efficacy: The Exercise of Control. New York: Freeman and Co.; 1997. [Google Scholar]
- 17.Nutrient Data System for Research (NDS-R), Nutrition Coordinating Center, Suite 300, 1300 South Second Street, Minneapolis, MN 55454, www.ncc.umn.edu (Accessed February 13, 2007).
- 18.Stewart AL, Mills KM, King AC, Haskell WL, Gillis D, Ritter PL. CHAMPS physical activity questionnaire for older adults: outcomes for interventions. Med Sci Sports Exerc. 2001;33:1126–41. doi: 10.1097/00005768-200107000-00010. [DOI] [PubMed] [Google Scholar]
- 19.Talbot F, Nouwen A, Gingras J, Gosselin M, Audet J. The Assessment of Diabetes-Related Cognitive and Social Factors: The Multidimensional Diabetes Questionnaire. J Behav Med. 1997;20:291–312. doi: 10.1023/a:1025508928696. [DOI] [PubMed] [Google Scholar]
- 20.Ware J, Jr, Kosinski M, Keller CD. A 12-Item Short-Form Health Survey: construction of scales and preliminary tests of reliability and validity. Med Care. 1996;34:220–33. doi: 10.1097/00005650-199603000-00003. [DOI] [PubMed] [Google Scholar]
- 21.Bradley C, Todd C, Gorton T, Symonds E, Martin A, Plowright R. The development of an individualized questionnaire measure of perceived impact of diabetes on quality of life: the ADDQoL. Quality of Life Research. 1999;8:79–91. doi: 10.1023/a:1026485130100. [DOI] [PubMed] [Google Scholar]
- 22.Beck AT, Steer RA, Brown GK. BDI-II Manual. San Antonio: Harcourt Brace & Co.; 1996. [Google Scholar]
- 23.Bradley C, Speight J. Patient perceptions of diabetes and diabetes therapy: assessing quality of life. Diabetes Metab Res Rev. 2002;18:S64–9. doi: 10.1002/dmrr.279. [DOI] [PubMed] [Google Scholar]
- 24.Wonch DE. Readability Testing. http://www1.va.gov/visns/visn02/vet/ed/articles/readability.doc. (Accessed February 14, 2007).
- 25.Glasgow RE, Strycker LA, Toobert DJ, Eakin E. A Social-Ecologic Approach to Assessing Support for Disease Self-Management: The Chronic Illness Resources Survey. J Behav Med. 2000;23:559–583. doi: 10.1023/a:1005507603901. [DOI] [PubMed] [Google Scholar]
- 26.Rigler SK, Studenski S, Wallace D, Reker DM, Duncan PW. Co-morbidity adjustment for functional outcomes in community-dwelling older adults. Clin Rehabil. 2002;16:420–8. doi: 10.1191/0269215502cr515oa. [DOI] [PubMed] [Google Scholar]
- 27.Roza AM, Shizgal HM. The Harris Benedict equation reevaluated: resting energy requirements and body cell mass. Am J Clin Nutr. 1984;40:168–82. doi: 10.1093/ajcn/40.1.168. [DOI] [PubMed] [Google Scholar]
- 28.Sevick MA, Piraino B, Sereika S, et al. A preliminary study of PDA-based dietary self-monitoring in hemodialysis patients. J Ren Nutr. 2005;15:304–11. doi: 10.1016/j.jrn.2005.04.003. [DOI] [PubMed] [Google Scholar]
- 29.Burke LE, Warziski M, Starrett T, et al. Self-monitoring dietary intake: current and future practices. J Ren Nutr. 2005;15:281–90. doi: 10.1016/j.jrn.2005.04.002. [DOI] [PubMed] [Google Scholar]
- 30.Lightman SW, Pisarska K, Berman ER, et al. Discrepancy between self-reported and actual caloric intake and exercise in obese subjects. N Engl J Med. 1992;327:1893–8. doi: 10.1056/NEJM199212313272701. [DOI] [PubMed] [Google Scholar]
- 31.Ledikwe JH, Ello-Martin JA, Rolls BJ. Portion sizes and the obesity epidemic. J Nutr. 2005;135:905–9. doi: 10.1093/jn/135.4.905. [DOI] [PubMed] [Google Scholar]
- 32.Glanz K, Murphy S, Moylan J, Evensen D, Curb JD. Improving dietary self-monitoring and adherence with hand-held computers: A pilot study. American Journal of Health Promotion. 2006;20(3):165–170. doi: 10.4278/0890-1171-20.3.165. [DOI] [PubMed] [Google Scholar]
- 33.Burke LE, Sereika S, Choo J, Warziski M, Music E, Styn MA, et al. Ancillary study to the PREFER trial: A descriptive study of participants’ patterns of self-monitoring: Rationale, design and preliminary experiences. Contemporary Clinical Trials. 2006:23–33. doi: 10.1016/j.cct.2005.10.006. [DOI] [PubMed] [Google Scholar]
- 34.Burke, L. E., Sereika, S. M., Music, E., Warziski, M., Styn, M. A., Stone, A. (in press, 2007). Using Instrumented Paper Diaries to Document Self-Monitoring Patterns in Weight Loss, Contemporary Clinical Trials.
- 35.Yon BA, Johnson RK, Harvey-Berino J, Gold BC, Howard AB. Personal Digital Assisants are Comparable to Traditional Dietary Self-Monitoring During a Weight Loss Program. Journal of Behavioral Medicine. 2007;30:165–75. doi: 10.1007/s10865-006-9092-1. [DOI] [PubMed] [Google Scholar]
- 36.Stone AA, Shiffman S, Schwartz JE, Broderick JE, Hufford ME. Patient compliance with paper and electronic diaries. Control Clin Trials. 2003;24:182–99. doi: 10.1016/s0197-2456(02)00320-3. [DOI] [PubMed] [Google Scholar]
- 37.Personal communication. Scott McDoniel, Clinical Operations Manager, Microlife. (August 27, 2007).
- 38.Health Engage Diabetes at www.healthengage.com. Accessed August 27, 2007
- 39.Diabetes Pilot ay www.diabetespilot.com. Accessed August 27, 2007.