

Summary
Nuclear pore complexes (NPCs) are selectively gated pathways between nucleoplasm and cytoplasm. While small molecules can diffuse freely through NPCs, large molecules (>40 kD) can pass only when bound to transport receptors. The NPC central channel is filled with disordered proteins, rich in phenylalanine-glycine (FG) repeats, referred to as FG-nups. Our simulations, carried out at coarse-grained and all-atom levels, show that arrays of FG-nups tethered to a planar surface, at an FG-repeat density found in the NPC, form dynamic brushlike structures of multi-protein bundles, while individual FG-nups form dynamic globular structures. More than half of the FG-repeats are found on the surface of the bundles, offering a favorable environment for transport receptors. Binding to FG-repeats and a sliding motion of NTF2 induced by binding and unbinding to phenylalanines were observed when adding this transport receptor into one of the brush-like structures.
Introduction
The nucleus of eukaryotic cells stores and organizes the cell's genetic material, controlling thereby gene expression. The nucleus is enclosed by the nuclear envelope (NE), which isolates and protects the materials inside the nucleus from the cytoplasmic compartment. While genome and the transcription machinery require the protection, they also need to communicate with the rest of the cell, importing proteins from the cytoplasm across the NE and exporting products, such as RNAs. Nuclear pore complexes (NPCs), forming large pores through the NE, enable and control the needed import and export. As the only pathway connecting the cellular cytoplasm with the nucleoplasm, NPCs allow small molecules (<40 kD) to diffuse freely into and out of the nucleus, while excluding large molecules, which are only allowed to pass when bound to so-called transport receptors. Transport receptors are proteins that manage to pass the NPC despite their large size. The selective passage through the NPC is essential for cell growth and function; however, the mechanism underlying the selection is still unknown.
Structure of the NPC and selective transport
Each nucleus has many NPCs to facilitate the exchange of molecules with the cytoplasm, the exact number varying with cell size and cell activity. For example, there are 200 NPCs/nucleus in yeast cells and 2000-5000 NPCs/nucleus in proliferating human cells (Gerace and Burke, 1988; Görlich and Kutay, 1999). The NPC, composed of ∼ 30 different kinds of proteins (nucleoporins/nups), has octagonal radial symmetry and pseudo two-fold symmetry across the nuclear envelope. Because of this symmetric structure, each nup has at least 8 copies in the NPC and, in fact, most nups exist in 16 copies or more. NPCs exhibit a very large total mass, e.g., ∼ 44 MDa in yeast and ∼ 60 MDa in vertebrates (Rout et al., 2000; Cronshaw et al., 2002). Despite the different masses, nuclear pores have a similar basic structure: each NPC is composed of a cylindrical central framework, of eight cytoplasmic filaments, and of a nuclear basket (Rout et al., 2000; Cronshaw et al., 2002). Electron microscopy studies revealed that the central framework of the NPC is anchored inside the NE with the cytoplasmic filaments attached to its cytoplasmic side and the nuclear basket attached to its nuclear side (review in Lim et al. (2008)). Inside the central framework is a central channel, with a diameter of 38 nm and a length of 37 nm in case of yeast NPC (Alber et al., 2007b,a). The central channel is filled with intrinsically unstructured nucleoporins (FG-nups), which are rich in phenylalanine and glycine (FG) repeating sequences (Beck et al., 2004; Macara, 2001; Rout et al., 2000), most with repeating motifs FG, FxFG (x being any amino acid) and GLFG (Denning and Rexach, 2007).
To achieve active NPC transport, a special family of proteins, called transport receptors, is required. These proteins distinguish between inert molecules and molecules destined to go through the NPC by recognizing the nuclear localization signal (NLS) for import and the nuclear export signal (NES) for export, both of which are special protein sequences (review in Pemberton and Paschal (2005)). A transport receptor binds to its cargo molecule, i.e., one with the correct signal, forming a receptor-cargo complex, and chaperons it across the NPC. Once arriving at the opposite side of the NPC, receptor-cargo complex dissociation is triggered by binding of RanGTP (nucleoplasm) and by the hydrolysis of RanGTP to RanGDP (cytoplasm), leaving the cargo in the proper compartment of the cell. As the RanGDP importer, NTF2 carries RanGDP from the cytoplasm to the nucleoplasm, where RanGDP is converted to RanGTP.
The interaction between FG-nups and the transport receptors is key to the selective transport of the NPC. Both experiment and simulation have demonstrated that transport receptors bind to FG-nups through hydrophobic binding spots (Liu and Stewart, 2005; Morrison et al., 2003; Bednenko et al., 2003; Bayliss et al., 2002b; Isgro and Schulten, 2005, 2007a,b). FG-nups are believed to be very flexible and to exhibit properties typical of natively unfolded, disordered proteins (Denning et al., 2003; Lim et al., 2006). The deletion of some combinations of FG-repeat regions can lead to cell death while the cell is still viable when over half of the FG-repeat mass is deleted (Strawn et al., 2004).
Proposed models of selective transport through NPCs
The disordered nature of FG-nups in the NPC, apparently required for transport receptor passage and selective gating, poses a challenge to a detailed understanding of NPC function. Fortunately, disordered biomolecular systems can be studied by means of molecular dynamics (MD) simulations (Heller et al., 1993) such that the models can be tested. The ability of MD to investigate disordered systems was demonstrated widely in the case of membrane processes, a field where MD has become indispensable (Gumbart et al., 2005). Structure, dynamics and function of FG-nups should likewise become a successful domain of MD, a major hurdle being the more extended length and time scale that need to be described. Various models explaining selective transport through the NPC have been suggested. Below we introduce three, the virtual-gate, the selective-phase, and the reduction-of-dimensionality model.
The virtual-gate model (Rout et al., 2000) proposes that FG-nups form an entropic barrier, given the fact that a dense array of FG-nups is attached to the surface of the NPC channel. While transport receptors can carry large molecules bound to them through this barrier by binding to FG-repeats, other large, but inert molecules are excluded. In support of this model, clusters of human Nup153 (a human FG-nup) were demonstrated by atomic force microscopy (AFM) measurements to form polymer brushes in vitro (Lim et al., 2006). The authors in (Lim et al., 2007) showed that addition of transport receptor importin-β induces the collapse of the Nup153 brushes while this collapse can be reversed by adding RanGTP, which dissociates importin-β from the FG-nups and inhibits importin-β from binding to FG-repeats (Rexach and Blobel, 1995).
The selective-phase model (Ribbeck and Görlich, 2002) proposes that FG-nups form a 3D meshwork inside the channel through extensive FG-repeat-mediated binding. The binding between FG-repeats reduces the free diffusion size limit, but transport receptors carrying cargo can travel through this mesh by separating the linked FG-repeats, competing themselves for binding to FG-repeats. In support of this model, yeast nsp1 (a yeast FG-nup) was shown to form a macroscopic hydrogel (Frey et al., 2006). The authors demonstrated also that a saturated hydrogel formed by nsp1 can produce a permeability barrier similar to that found in real NPC (Frey and Görlich, 2007).
The reduction-of-dimensionality model (Peters, 2005) proposes that FG-repeats of FG-nups line the NPC central channel with an FG surface. While inert molecules are restricted to a very narrow passage, transport receptors can manage through the NPC by sliding on the FG surface in the manner of a two-dimensional rather than a three-dimensional random walk.
The reduction-of-dimensionality model (Peters, 2005) proposes that the FG-repeats of FG-nups form a roughly cylindrical layer and are sufficiently available for binding to transport receptors. The layer guides the receptors through the nuclear pore, both through reduction in dimensionality from three to two and through affinity gradients.
The exact gating and transport mechanism of the NPC remains elusive. By combining coarse-grained (CG) and all-atom (AA) molecular dynamics (MD), we were able to study individual and collective behaviors of FG-nup yeast nsp1 over the time scale of microseconds. Individual segments as well as arrays of nsp1 segments were investigated (summarized in Table 1 and 2). While individual segments were seen to form globule-like dynamic structures, arrays of them formed polymer strands organized into brush-like structures with a height much larger than the Rg of individual segments. All-atom simulations were performed to investigate the interaction between the brush-like structure and the transport receptor NTF2.
Table 1.
Segments D1 - D25 simulated and their nsp1 sequences.
| Segment name | D1 | D2 | D3 | D4 | D5 |
|---|---|---|---|---|---|
| Nsp1 sequence | 1 - 100 | 21 - 120 | 41 - 140 | 61 - 160 | 81 - 180 |
| Segment name | D6 | D7 | D8 | D9 | D10 |
| Nsp1 sequence | 101 - 200 | 141 - 240 | 161 - 260 | 181 - 280 | 201 - 300 |
| Segment name | D11 | D12 | D13 | D14 | D15 |
| Nsp1 sequence | 221 - 320 | 241 - 340 | 261 - 360 | 281 - 380 | 301 - 400 |
| Segment name | D16 | D17 | D18 | D19 | D20 |
| Nsp1 sequence | 321 - 420 | 341 - 440 | 361 - 460 | 381 - 480 | 401 - 500 |
| Segment name | D21 | D22 | D23 | D24 | D25 |
| Nsp1 sequence | 421 - 520 | 441 - 540 | 461 - 560 | 481 - 580 | 501 - 600 |
Table 2.
Summary of MD simulations.
| Simulation | System | CG simulation No. of CG beads | CG simulation time | AA simulation No. of atoms | AA simulation time |
|---|---|---|---|---|---|
| Sim_ D1 | D1 | 16,814 | 1 μs | 74,316 | 20 ns |
| Sim_ D6 | D6 | 16,493 | 1 μs | 76,630 | 20 ns |
| Sim_ D10 | D10 | 17,511 | 1 μs | 75,605 | 20 ns |
| Sim_ D15 | D15 | 16,209 | 1 μs | 78,286 | 20 ns |
| Sim_ D20 | D20 | 15,811 | 1 μs | 76,303 | 20 ns |
| Sim_ D25 | D25 | 17,400 | 1 μs | 84,656 | 20 ns |
| Sim_ WT1 | WT_ array | 56,595 | 4 μs | 353,628 | 10 ns |
| Sim_ WT2 | WT_ array | 56,595 | 4 μs | 355,574 | 10 ns |
| Sim_ MT | MT_ array | 56,595 | 4 μs | 355,618 | 10 ns |
| Sim_ NTF2 | NTF2 | — | — | 329,162 | 60 ns |
Results
In order to sample computationally a representative volume of the nsp1-filled NPC channel, we constructed an array of individually tethered nsp1 segments, tethering points being positioned such that the resulting systems adopted an FG-repeat density similar to that in the NPC. For this purpose, the FG-repeat domain of nsp1 (1 - 600) was represented by twenty-five 100 amino acid (aa) long segments (D1 - D25, Table 1), individual and collective behaviors of which being then studied through coarse-grained (CG) and all-atom (AA) molecular dynamics (MD) simulations. As representatives, six segments tethered to the substrate were simulated individually in solution, reaching dynamic globular structures. All twenty-five segments were then tethered individually to a planar surface, the tethered endpoints forming a regular 5 × 5 lattice as shown in Fig. 2. Both wildtype and mutant nsp1 arrays were simulated. The transport receptor NTF2 was finally added to one resulting structure of the wildtype array and simulated to study its interaction with nsp1.
Figure 2.

Initial configuration of the wildtype nsp1 array system (WT_array). a) Top view of the array. Only the N-terminus constrained to the substrate is shown for each chain. b) Side view. Each segment is shown in a different color with its constrained N-terminus represented by a red sphere. The water box including the array is shown in light purple and its dimension is labeled. The central segment of the array is indicated by a black circle.
Individual nsp1 segments
Segments D1, D6, D10, D15, D20 and D25 (Table 1) tethered to a planar surface were simulated individually in solution, their sequences covering the whole FG-repeat domain of nsp1 (1-600) without overlap. Each segment was first described through coarse-grained (CG) molecular dynamics (MD) for 1 μs. During the simulations, the initially fully extended segments coiled up and shortened into globule-like structures as seen in Fig. 1, which shows the radius of gyration (Rg) decreasing from over 100 Å (corresponding to the fully extended form) to a value between 11.8-13.5 Å (corresponding to a globular form).
Figure 1.

Coiling of individual, initially fully extended, nsp1 segments. The time evolution of the radius of gyration (Rg) is shown for 1 μs CG simulations. The inset shows the time evolution of Rg during subsequent AA simulations, that started from the reverse-coarse-grained AA structures of the final (1 μs) CG structures.
The resulting CG globular structures were reverse-coarse-grained and the obtained all-atom (AA) structures studied in 20 ns AA MD simulations. During these simulations, Rg values increased slightly (Fig. 1 inset) to 13.7 Å, 14.0 Å, 14.7 Å, 15.7 Å, 14.5 Å, and 20.0 Å for segments D1, D6, D10, D15, D20, and D25, respectively. With the volume of each globule-like structure taken to be , the average FG-repeat density in these segments is 0.39 FG-repeat/nm3, which is five times as large as the estimated density of yeast NPC.
For comparison, three natively-folded proteins of similar size were selected from the Protein Data Bank and their Rg calculated: the fibronectin type III repeat domain of neural cell adhesion molecule 1 (PDB code: 2HAZ, 104-aa, 11.3 kDa) has an Rg of 14.2 Å; macromomycin (PDB code: 2MCM, 112-aa, 10.7 kDa) has an Rg of 13.4 Å; and the light chain of Bence-Jones Protein RHE (PDB code: 2RHE, 114-aa, 11.8 kDa) has an Rg of 14.0 Å. Compared to these natively-folded proteins, segments D1 and D6 are as compact, segments D10, D15, and D20 are a little less compact, and segment D25 is significantly more expanded, suggesting overall that the whole FG-repeat domain of nsp1 is less compact than typical natively-folded protein and likely is more flexible.
Arrays of wildtype nsp1
A key question regarding NPC function is how nsp1 segments behave when brought together, reaching an FG-repeat density close to that in the NPC central channel. The listed twenty-five 100-aa wildtype nsp1 segments (D1 - D25, Table 1) were, thus, tethered individually to form a 5 × 5 array (WT _array, Fig. 2). Two independent 4 μs CG MD simulations were performed for this system. In both simulations, the segments coiled and shortened from their fully extended state, reaching a dynamic equilibrium very quickly. As shown in Fig. 3a, the brush height decayed, from an initial brush-height of over 350 Å to an average value of 77.1 Å for Sim_WT1 and 88.8 Å for Sim_WT2. The coiling of the segments in Sim_WT1 and Sim_WT2 is shown in detail in Supplementary Materials (Movies 1 and 2).
Figure 3.

Formation of brush-like structures. a) Time evolution of the brush-height for Sim_WT1 (red line), Sim_WT2 (blue line), and Sim_MT (green line) during 4 μs CG simulations, with the inset showing the time evolution of the brush-height during the AA simulations. b) Pair distribution function g(r) of the FG-repeats of simulations Sim_WT1 (red line), Sim_WT2 (blue line), and Sim_MT (green line) averaged over the last 2 ns of their 10 ns AA simulations. The inset shows a histogram of the distances between adjacent binding spots on transport receptors (Isgro and Schulten, 2007b).
Instead of forming globule-like structures as the individual segments did, the wildtype array in each simulation formed a brush-like structure with a height much larger than the Rg of a single chain (i.e., 77.1 - 88.8 Å vs. 13.7 - 20.0 Å). The segments are seen to form bundles of 2 - 6 individual segments and different bundles inter-cross with each other, leaving some space that allows small molecules to diffuse through. One should note that the final conformation reached continues to undergo random conformational transitions as the system is dynamic in nature. The brush-like structure of Sim_WT1 is shown in Fig. 4a; detailed 360-degree views of the brush-like structures that resulted from the two simulations are provided in Supplementary Materials (Movies 4 and 5).
Figure 4.
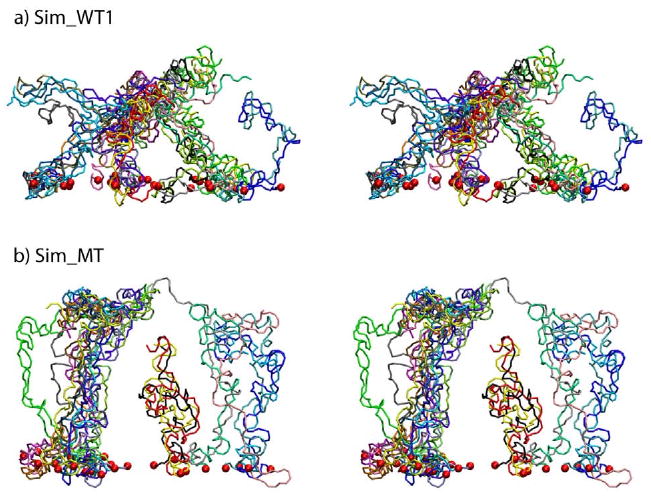
Stereo images of the brush-like structures of Sim_WT1 (a) and of Sim_MT (b). The CG brush-like structures of Sim_WT1 and Sim_MT at the end of their 4 μs CG simulations are shown with each segment depicted in a different color; the constrained N-termini (tethering points) are represented by red spheres. Note that only a single periodic cell is shown; bundles at the cell boundary are actually engaged in contacts with segments of neighboring periodic cells, that are not shown. A large array of segments that includes three periodic cells is shown in Supplementary Materials Fig. S1.
The CG structures reached after 4 μs were reverse-coarse-grained into AA structures, which were then simulated and equilibrated for 10 ns. The AA simulations did not result in a significant restructuring, except that the brush-height increased by ∼10 Å to a value of 87.8 Å for Sim_WT1 and 98.7 Å for Sim_WT2 (Fig. 3a inset). These heights correspond to an FG-repeat density of 0.08 FG-repeat/nm3 for Sim_WT1 and 0.07 FG-repeat/nm3 for Sim_WT2. Yeast NPC has a central channel of 38 nm in diameter and 37 nm in height (Alber et al., 2007b,a), in which FG-nups with a total of ∼3500 FG-repeats (Strawn et al., 2004) are anchored, corresponding to an estimated density of 0.08 FG-repeat/nm3.
A surface representation of the structures at the end of the two AA simulations is shown in Fig. 5, with FG-repeats colored in orange and green. The two simulations (Sim_WT1 and Sim_WT2) started from identical initial structures, but with different initial random atomic velocities; the two resulting equilibrated structures are qualitatively very similar, yet different in detail, which is consistent with the expected disordered nature of FG-nups (Denning et al., 2003). In either case, many FGs remain exposed to the bundle surface, free for binding to transport receptors. Surround views of Sim_WT1 and Sim_WT2 structures in Fig. 5 are provided as Movies 6 and 7 in Supplementary Materials.
Figure 5.

Final brush-like structures for Sim_WT1 (a) and Sim_WT2 (b). The structures of Sim_WT1 and Sim_WT2 at the end of their AA simulations are shown in surface representation with the FG-repeats colored in orange and green. Many FG repeats are exposed to water and ready to bind to transport receptors. The final structures are dynamic.
To identify how FG-repeats are distributed in detail, the respective pair distribution function, g(r), was averaged over the last 2 ns of each AA simulation (Fig. 3). Although both simulations reached quite different final conformations (Fig. 5a, b), they exhibit a similar FG-FG distance distribution at the first g(r) peak located at r ∼ 6 Å, indicating similar FG-repeat interactions. Indeed, sampling the FG-FG distances with a cutoff of 8 Å revealed that 41.5% of the FG-repeats are involved in close contact with other FG-repeats in Sim_WT1 and 37.5% in Sim_WT2. However, more than half of the FG-repeats are actually not involved in any contact with another FG-repeat within a distance of less than 8 Å; these FG-repeats should interact easily with FG-repeat binding spots on transport receptors, as long as they are surface-exposed which they mainly are (c.f. Fig 5). The two simulations show differences in the second and third g(r) peaks; the differences result from different conformations adopted by FG-repeats in the two simulations. It is interesting to note that g(r) assumes significant values between r = 12 Å and r = 22 Å, a region that corresponds to typical separations of binding spots found on transport receptors (Isgro and Schulten, 2007b), i.e., FG-repeats can bind readily to multiple binding spots on transport receptors. The inset of Fig. 3b shows a histogram of the distances between adjacent binding spots on transport receptors taken from (Isgro and Schulten, 2007b).
Array of mutant nsp1
A mutant nsp1 array with almost all non-polar phenylalanines mutated to polar serines (MT_array) was investigated to further explore the role of FG-repeats in forming brush-like structures. The mutant system was also subjected to a 4 μs CG MD simulation, during which the mutant nsp1 segments also coiled and shortened to form a brush-like structure, but one with an average brush-height of 108.1 Å, which is higher than seen in either wildtype array simulation (Fig. 3). The bundles of mutant nsp1 segments entangled with each other less than in the wildtype case, and thus remained largely separated, offering wider spaces for passage. The brush-like bundles are depicted in Fig. 4b; Movie 8 in Supplementary Materials illustrates this system, too.
The resulting CG structure was reverse-coarse-grained to obtain its associated AA structure, which was then refined in an AA MD simulation for 10 ns. With the basic structure not changing from the CG one, the brush-height increased by several Å to reach an equilibrium value averaged to 114.4 Å (Fig. 3a inset), resulting in a brush-height difference of +26.6 Å relative to Sim_WT1, and of +15.7 Å relative to Sim_WT2.
The SG/FG-repeat pair distribution function g(r) was averaged for the last 2 ns of the AA MD simulation of Sim_MT and compared to g(r) in simulations Sim_WT1 and Sim_WT2 (Fig. 3b). g(r) in Sim_MT looks quite different from that in the wildtype simulations. Instead of exhibiting a main first peak, g(r) is seen to split into three lower peaks. Using the same cutoff of 8.0 Å as for the wildtype simulations, a further calculation showed that 31.1% of the mutated SG repeats were in close contact, less than seen in the wildtype cases (37.5% and 41.5%). The FG-repeats seem to play a role in affecting the overall appearance of the nsp1 arrays' brush-like structure, but apparently they do not dominate the formation of the brushes.
Interactions with NTF2
In order to investigate the interactions of nsp1 with a transport receptor, one NTF2 (per elementary cell, see Methods) was embedded into the final AA structure resulting from wildtype array simulation Sim_WT2, forming a new system B_NTF2. It is noteworthy that the bundled nsp1 segments leave enough space for NTF2 embedding. A 60 ns AA simulation was performed to inspect the interactions arising (Fig. 6, Table 2).
Figure 6.
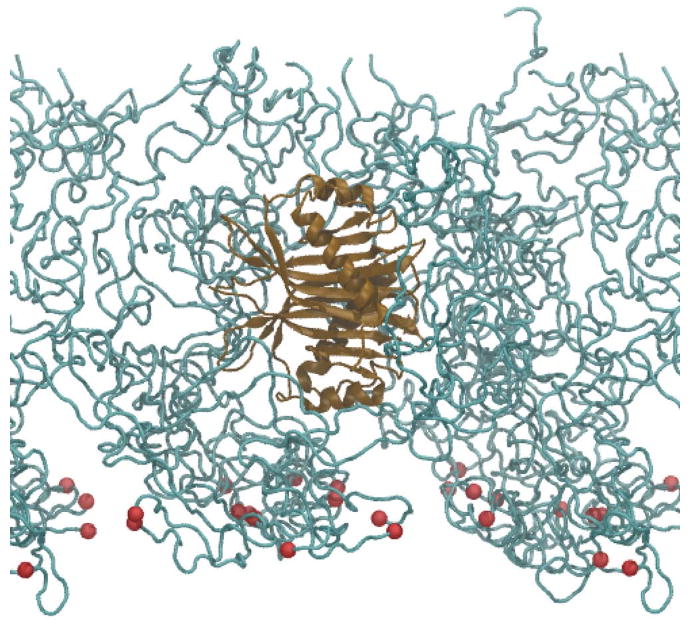
Side view of system B_NTF2 with NTF2 embedded. Only part of the system is shown with nsp1 segments in cyan, their constrained N-terminus Cα atoms as red spheres, and the embedded NTF2 in brown. Water and ions are not shown.
Within the 60 ns simulation, two NTF2 binding spots were seen bound to FG-repeat PHEs. Binding spot 2, also suggested by NMR experiments (Morrison et al., 2003) as described in (Isgro and Schulten, 2007a), became bound to PHE343 of segment D16 at about 15 ns (Fig. 7a). Subsequently at about 23 ns, PHE341 of the same segment and the same FG-repeat also bound to this spot, but to a slightly different location, yielding two PHEs bound to the area simultaneously (Fig. 7b). Eventually, at about 42 ns, PHE343 was pushed out and only PHE341 remained bound (Fig. 7c). This exchange of binding resulted in a motion of NTF2 along the direction of segment D16 as seen in Movie 9 of Supplementary Materials. Since the FG-repeat is initially quite close to the binding spot when NTF2 was embedded into the brush, this process happened quickly, i.e., PHE343 became bound to NTF2 already at 15 ns. Incidentally, this spot is where RanGDP binds when forming an import complex with NTF2 (Stewart et al., 1998).
Figure 7.

FG-repeat binding to NTF2. a) Binding of PHE343 to NTF2 binding spot 2 at 20 ns of Sim_NTF2. b) Binding of PHE343 and PHE341 to NTF2 binding spot 2 at 30 ns of Sim_NTF2. c) Binding of PHE341 to NTF2 binding spot 2 at the end of Sim_NTF2. d) Binding of PHE360 to NTF2 binding spot 1.3 at the end of Sim_NTF2. The NTF2 surface is colored according to residue type with polar basic residues colored in blue, polar acidic residues colored in red, polar neutral residues colored in green, and non-polar residues colored in white. Binding spots 2 and 1.3 are defined in (Isgro and Schulten, 2007a).
Binding spot 1.3, which is directly adjacent to experimentally observed (Bayliss et al., 2002a) binding spot 1.1 and 1.2 as described in (Isgro and Schulten, 2007a), was seen to bind to PHE360 of segment D15 at about 32 ns (Fig. 7d). This FG-repeat was initially more than 30 Å away from the surface of NTF2, and was drawn towards NTF2 during the simulation to finally bind to the surface of NTF2 (Supplementary Materials Movie 10). The ability to bind to more than one FG-repeat inside the brush-like environment and the ability to engage further away FG-repeats, even when the FG-repeat is constrained by a long segment forming the brushes, should be essential for the transport of NTF2 in NPCs.
Discussion
Individual and collective behaviors of nsp1 segments were studied combining CG and AA MD simulations. The CG simulations extended the simulation time scale to microseconds, permitting self-aggregation of nsp1 segments in a relaxation process from an artificial initially extended state. AA simulations were carried out to refine the obtained CG structures. The refined AA structures can be further used in the future to study the interaction of nsp1 with transport receptors. As a first step, NTF2 was embedded into the refined AA brush-like structure of Sim_WT2 to investigate their interaction.
Collective behaviors of both mutant and wildtype nsp1 were studied with 25 nsp1 segments tethered to a planar surface in a 5 × 5 array. The simulations revealed a bundle-based (involving 2-6 proteins), brush-like structure for arrays of wildtype and mutant nsp1 segments, with the FG-repeat density of wildtype brush-like structures close to the one encountered in the NPC central channel. The brushes exhibit a height much larger than the Rg of individual segments, i.e., the segments in the array are much more extended than equilibrated individual segments are. Indeed, a more extended conformation is expected for polymers attached close together, the extension arising from a competition between entropic and enthalpic energy contributions (Alexander, 1977; de Gennes, 1980; Milner, 1991). Experiments using atomic force microscopy (AFM) showed similar brush-like behaviors of a human FG-nup, namely Nup153 (Lim et al., 2006, 2007). However, one may argue that the particular structure seen in our simulations is a metastable intermediate reached only from the segments' initially extremely extended geometry. While this supposition cannot be ruled out since simulations much longer than 4 μs might be needed to establish a completely relaxed structure, the bundle-based brush form might be a key intrinsic property of nsp1 for several reasons: (1) the structure sports many surface-exposed FG-repeats; (2) the structure exhibits a degree of openness that readily permits entry of proteins as large as NTF2; (3) the structure has an FG-repeat density typical for the NPC central channel. The three properties, indeed, are ideally suited for selective transport in the NPC. It should also be noted that the structure reached assembled rapidly and spontaneously, reflecting clearly an intrinsic form of nsp1 dynamic association that deserves further scrutiny.
In the selective-phase model (Ribbeck and Görlich, 2002), a network resulting from FG-FG binding is proposed to form a selection barrier, while in the virtual-gate model (Rout et al., 2000) entropic exclusion is proposed to exclude inert molecules. The main difference between the two models is the degree to which FG-FG binding is involved in the barrier. Given that the mutant system described in simulation Sim_MT also forms a bundle-based brush-like structure, and that more than half of the FG-repeats are actually available at the bundle surface without any FG-repeat within 8 Å of themselves, our results support the virtual-gate model (Rout et al., 2000). One would expect that the mutant brush-like structure blocks all kinds of large molecules including transport receptor-cargo complexes due to a lack of FG binding opportunity, thus leading to the lethality of this mutant (Frey et al., 2006). The many exposed FG-repeats seen in simulations Sim_WT1 and Sim_WT2 also support the assumption of an FG surface inside the NPC in the reduction-of-dimensionality model (Peters, 2005), which proposes that transport receptors pass through the NPC by sliding along the FG surface. Indeed, a sliding of NTF2 due to dynamic binding and unbinding involving PHE343 and PHE341 of segment D16 at binding spot 2 (Isgro and Schulten, 2007a) was observed in our 60 ns AA simulation Sim_NTF2 as shown in Movie 9 of Supplementary Materials.
Although 60 ns is a very short time compared to NPC transport, NTF2 has already been seen bound to two PHEs, one (PHE360) even being engaged from further away (Supplementary Materials Movie 10). The observation that NTF2 binds to multiple FG-repeats belonging to different segments should be important for its transport through the NPC. PHE360 was seen to catch and bind to the NTF2 surface from further away, even though the segment containing it is constrained by the bundle-based structure. Longer and larger simulations are needed to further study the NTF2-nsp1 system. For example, with the introduction of transport receptor NTF2, our simulation does not exhibit the collapse of the brushes seen in experiments (Lim et al., 2007).
The methodological approach taken in the present study makes it possible to simulate large FG-nup systems for a long time, offering wide opportunities to transport-related structures and processes in the NPC. A recent structural model of the NPC has made detailed predictions about the stoichiometry of FG-nups and their anchoring spots, based on vast experimental data (Alber et al., 2007b,a); by anchoring the FG-nups to the spots suggested in this model, one can determine the “resting state” of FG-nups by simulating the system using the approach followed here.
Experimental Procedures
All-atom (AA) molecular dynamics (MD) as described in (Phillips et al., 2005) is a widely accepted modeling approach that presently permits simulations of about 1 million atoms over 100 ns. For the purpose of simulating the self-assembly of FG-nups, we needed to extend such simulations to several microseconds which is still unfeasible at AA resolution for large systems. However, coarse-grained (CG) simulation methods have proven to be well suited to describe the type of large scale assembly processes expected to occur among FG-nups and, accordingly, we adopt these methods here. Marrink and coauthors applied coarse graining successfully to the study of lipid assembly (Marrink et al., 2004, 2005). We have extended their approach to include proteins (Shih et al., 2006) and have employed the resulting CG MD method successfully in experimental-theoretical studies of the assembly of lipoproteins and lipids into disordered lipoprotein particles (Shih et al., 2007b,a,c).
Structures resulting from CG simulations can be “reverse-coarse-grained” to obtain corresponding AA structures, as introduced in (Shih et al., 2007c) and described in detail in (Freddolino et al., 2008; Shih et al., 2008). In the present study, CG MD was used to extend the time scale to microseconds while AA MD was used to refine final structures obtained through CG MD simulations and to investigate the interaction of NTF2 with FG-nup nsp1 in chemical detail.
Coarse-grained model
The coarse-grained (CG) model suggested in (Shih et al., 2006; Marrink et al., 2004) was used here to describe individual nsp1 segments and their arrays. For proteins represented through this model, each amino acid residue is mapped onto two CG beads (Fig. 8), a backbone bead and a sidechain bead, except for glycine which is represented by only a backbone bead. The sidechain beads vary between different amino acids. There are 19 different types of sidechain beads which belong to five different interaction classes. For water and ions, four water molecules are represented by one polar CG bead while each ion together with its hydration shell is mapped onto one charged CG bead. Compared to the previous CG model that described strictly α-helical proteins through suitable dihedral potentials (Shih et al., 2006), in the present study dihedral angles along the protein backbone were assumed completely flexible, consistent with the nsp1's disordered nature, i.e., the dihedral potential was set to zero.
Figure 8.

Nsp1 sequence (PAFSFG) in all-atom (AA, top) and in the equivalent coarse-grained (CG, bottom) description. The CG representation is shown with backbone beads in green, proline, alanine, phenylalanine and serine sidechains in tan, purple, orange and yellow, respectively. Glycine is represented by only a backbone bead.
Reverse-coarse-graining procedure
While each amino acid is mapped onto two CG beads in the coarse-graining procedure, each amino acid can be mapped back to an AA representation by replacing the CG beads with all the atoms it represents as detailed in (Shih et al., 2007c; Freddolino et al., 2008; Shih et al., 2008). The resulting AA structure was then annealed in an NVT ensemble according to the following protocol: with the center of mass of all the atoms belonging to one CG bead constrained, the system was first energy minimized at T = 610 K for 5 ps, followed by an 8 ps heating stage at T = 610 K, and then a cooling stage with a temperature decrement of 10 K every 2 ps until T = 300k was reached. Following this protocol, we performed AA dynamics (T = 298 K), keeping the Cα atoms constrained in harmonic wells and N-terminal/C-terminal Cα atoms fixed (N-termini for the arrays and C-termini for the individual segments), for a total of 190 ps in an NVT ensemble. The constraint strength was gradually decreased from 4 kcal/mole/Å2 to 0.4 kcal/mole/Å2 with a decrement of 0.2 kcal/mole/Å2 every 10 ps, allowing the protein backbone to relax gradually. Since NVT ensembles are used here, a constraint strength of 0.4 kcal/mole/Å2 was still kept at the end in order not to disturb the dynamics of the backbone. Simulations without any constraint to the Cα atoms (except the terminal Cα atoms tethered to the planar surface) were then performed in NPT ensembles to further refine these structures, as detailed below.
CG systems
The FG-repeat domain of nsp1 was built from nsp1 sequence 1-600 (Swiss-Prot P14907) using the 2004.03 release of Chemical Computing Group's Molecular Operating Environment (MOE) software. The backbone dihedral angles (φ, ψ) were set to (180, 180) so that an unstructured straight nsp1 was obtained. Twenty-five overlapping segments were then selected, each segment containing 100 amino acids (see Table 1).
With the C-terminus of each segment attached to the substrate and the rest of the segment fully extended in the direction normal to the substrate, the 6 representative segments (D1, D6, D10, D15, D20, and D25) were coarse-grained and solvated individually into CG water boxes of dimension 70 Å × 70 Å × 415 Å, which are large enough to avoid proteins to interact significantly with their periodic images. A total of 100 mM of NaCl was then added to the water box, adjusting the relative concentrations of Na+ and Cl− to render the whole system chargeless. This resulted in 16,814, 16,493, 17,511, 16,209, 15,811, and 17,400 CG beads for segments D1, D6, D10, D15, D20, and D25, respectively (Table 2).
All 25 segments listed in Table 1 were put together to form the wildtype 5 × 5 array (WT array), with the N-terminus of each segment attached to the substrate and the rest of the segment fully extended in the direction normal to the substrate (Fig. 2). The separation of adjacent segments was set to ∼26 Å as shown in Fig. 2a, with segments D1 - D25 randomly assigned inside the array. The array was then coarse-grained and solvated into a 130 Å × 130 Å × 416 Å CG water box, which was large enough to make sure the array was 13 Å from the box edge in the x,y-plane and, hence, 26 Å from their periodic (see Supplementary Materials) images. A total of 100 mM of NaCl was added to the water box, adjusting the relative concentrations of Na+ and Cl− to render the whole system chargeless. A mutant array (MT _array) was then obtained by mutating all PHEs (except the PHEs at amino acid numbers 3 and 129) of WT _array to SERs, inspired by experimental work (Frey et al., 2006). Since both PHE and SER have neutral sidechains, no adjustment of the ion concentration needed to be made. The wildtype and mutant arrays were each composed of 56,595 CG beads (Table 2).
All systems were allowed to equilibrate as follows: first, the water and ions were energy minimized for 2000 steps and molecular dynamics was performed for 2 ns with protein segments fixed in an NVT ensemble (T = 298 K), allowing water and ions to equilibrate; then, the protein segments were freed, but with their N-termini/C-termini (N-termini for the arrays and C-termini for the individual segments) constrained in separate harmonic wells (describing, thus, the grafting to the surface), and the entire system was again energy minimized for 2000 steps, allowing the system to relax locally. The resulting systems were then simulated, assuming an NPT ensemble, with their grafted termini constrained for periods listed in Table 2.
Reverse-coarse-grained AA simulations
The CG representation of nsp1 segments (array or single), after being mapped back to an AA representation, were solvated into AA water boxes. The box dimension was 90 Å × 90 Å × 100 Å for individual segments and 130 Å × 130 Å × 218 Å for arrays. Notice that the water boxes were smaller along the Z-axis than the CG water boxes, since the initially extended segments had coiled up and shortened. A total of 100 mM NaCl was then added to each water box, adjusting the relative concentrations of Na+ and Cl− to render each system chargeless. This resulted in 74,316, 76,630, 75,605, 78,286, 76,303, and 84,656 atoms for segments D1, D6, D10, D15, D20, D25, respectively; a total of 353,628, 355,574, and 355,618 atoms were included in the AA systems of Sim_WT1, Sim_WT2, and Sim_MT, respectively (Table 2). The systems were then annealed and relaxed according to the reverse-coarse-graining procedure outlined above. The resulting states were employed in the AA simulations listed in Table 2 in NPT ensembles.
The NTF2 simulation
Into the brush-like structure resulting from the AA simulation of Sim_WT2 we embedded the NTF2 dimer taken from the final state of simulation EX4 in (Isgro and Schulten, 2007a); the dimer exhibits 12 binding spots (6 binding spots for each monomer). The system was then solvated into a 30 Å × 130 Å × 218 Å AA water box with 100 mM NaCl, the relative concentrations of Na+ and Cl− adjusted to render the whole system chargeless. This resulted in a 329,162 atom system. With nsp1 atoms constrained in separate harmonic wells (a constraint strength of 20 kcal/mole/Å2 for N-terminal Cα atoms and a strength of 2 kcal/mole/Å2 for other nsp1 atoms), the system was energy minimized for 10,000 steps and subjected to a 500 ps MD equilibration carried out in an NPT ensemble. The nsp1 segments were subsequently released from the constraints, except that N-terminal Cα atoms of nsp1 segments remained constrained with a constraint strength of 0.2 kcal/mole/Å2; the system was again energy minimized for 10,000 steps and 60 ns AA dynamics was performed in an NPT ensemble.
Simulation details
CG and AA simulations were performed using the program NAMD 2.5/2.6 (Phillips et al., 2005). The simulations utilized periodic boundary conditions to avoid surface effects, i.e., the simulation cell in Figs. 4, 5, 2 was replicated in all directions. Van der Waals interactions were cut off at 12 Å, with a switching function beginning at 9 Å for CG simulations and 10 Å for AA simulations, to implement a smooth cutoff. Langevin dynamics was used to control temperature with a damping coefficient of 5 ps−1 and pressure was regulated via the hybrid Nose-Hoover (Martyna et al., 1994) Langevin (Feller et al., 1995) piston method. The piston oscillation period was set to 100 fs for AA simulations (Phillips et al., 2005) and 1000 fs for CG simulations; the damping time scale of the hybrid Nose-Hoover-Langevin piston method was set to 50 fs for AA simulations, and 500 fs for CG simulations. For CG simulations, the integration time step was set to 10 fs; electrostatic interactions were cut off at 12 Å with a shifting function throughout the interaction range to implement a smooth cutoff. For AA simulations, the Particle Mesh Ewald (PME) method (Darden et al., 1993) was used to calculate electrostatic forces without a cutoff; a multiple time-stepping algorithm (Grubmüller et al., 1991; Schlick et al., 1999) was utilized with a 1 fs step for bonded force evaluation, 2 fs for short range non-bonded forces (within the cutoff), and 4 fs for long range electrostatics (outside the cutoff) (Phillips et al., 2005).
Supplementary Material
Movie 1 shows the formation of a brush-like structure in Sim_WT1. The initially fully extended segments coiled and shortened quickly coming to a dynamic equilibrium.
Movie 2 shows the formation of a brush-like structure in Sim_WT2.
Movie 3 shows the formation of a brush-like structure in Sim_MT.
Movie 4 shows the final CG structure of Sim_WT1. The constrained N-termini are depicted as red spheres. The segments form bundles of 2-6 individual chains; different bundles exhibit inter-crossing of nsp1 segments.
Movie 5 shows the final CG structure of Sim_WT2. The constrained N-termini are depicted as red spheres.
Movie 6 shows the final AA structure of Sim_WT1 in surface representation. The FG-repeats are clolored with PHE in orange and GLY in green. Many FG-repeats are exposed on the surface of the structure, offering energetically favorable interaction spots to transport receptors.
Movie 7 shows the final AA structure of Sim_WT2 in surface representation.
Movie 8 shows the final CG structure of Sim_MT. The constrained N-termini are depicted as red spheres. The segments also form bundles with 2-6 individual chains, with a larger height compared to the wildtype case. The bundles inter-cross less with each other, leaving wider space for passage.
Movie 9 shows the process of FG-repeat binding to NTF2 binding spot 2. The process of binding to NTF2 binding spot 2 for PHE343 and PHE341 (both of segment D16) is shown with PHE343 and PHE341 in orange, and segment D16 in yellow. The exchange of binding between PHE343 and PHE341 resulted in a motion of NTF2 along the direction of segment D16; this motion can be clearly recognized in the movie. Ruler grids are also shown in the movie, with each grid being 10 Å × 10 Å.
Movie 10 shows the process of FG-repeat binding to NTF2 binding spot 1.3. The process of binding to NTF2 binding spot 1.3 for PHE360 of segment D15 is shown with PHE360 and PHE362 in orange, and segment D15 in yellow. PHE360 was drawn towards NTF2 from further away during the simulation. Ruler grids are also shown in the movie, with each grid being 10 Å × 10 Å.
Acknowledgments
The authors would like to thank Timothy A. Isgro who initiated this study and assisted us with advice. The authors are indebted also to Yi Wang and Peter L. Freddolino for help with simulations and analyses. The work was supported by the National Institutes of Health grants R01-GM067887 and P41-RR05969, as well as by the National Science Foundation grant PHY0822613. Supercomputer time was provided by the National Center for Supercomputing Applications, the Pittsburgh Supercomputer Center, and the Texas Advanced Computing Center through the National Science Foundation and the Large Resources Allocation Committee grant MCA93S028, as well as the National Center for Supercomputing Applications Abe cluster through the Institute for Advanced Computing Applications and Technologies. Molecular images in this paper were prepared with VMD (Humphrey et al., 1996). L. M. received a U. of Illinois Computational Science and Engineering fellowship.
Footnotes
Publisher's Disclaimer: This is a PDF file of an unedited manuscript that has been accepted for publication. As a service to our customers we are providing this early version of the manuscript. The manuscript will undergo copyediting, typesetting, and review of the resulting proof before it is published in its final citable form. Please note that during the production process errors may be discovered which could affect the content, and all legal disclaimers that apply to the journal pertain.
References
- Alber F, Dokudovskaya S, Veenhoff LM, Zhang W, Kipper J, Devos D, Suprapto A, Karni-Schmidt O, Williams R, Chait BT, et al. Determining the architectures of macromolecular assemblies. Nature. 2007a;450:683–694. doi: 10.1038/nature06404. [DOI] [PubMed] [Google Scholar]
- Alber F, Dokudovskaya S, Veenhoff LM, Zhang W, Kipper J, Devos D, Suprapto A, Karni-Schmidt O, Williams R, Chait BT, et al. The molecular architecture of the nuclear pore complex. Nature. 2007b;450:695–701. doi: 10.1038/nature06405. [DOI] [PubMed] [Google Scholar]
- Alexander S. Polymer adsorption on small spheres. a scaling approach. J Phys France. 1977;38:977–981. [Google Scholar]
- Bayliss R, Leung SW, Baker RP, Quimby BB, Corbett AH, Stewart M. Structural basis for the interaction between NTF2 and nucleoporin FxFG repeats. EMBO J. 2002a;21:2843–2853. doi: 10.1093/emboj/cdf305. [DOI] [PMC free article] [PubMed] [Google Scholar]
- Bayliss R, Littlewood T, Strawn LA, Wente SR, Stewart M. GLFG and FxFG nucleoporins bind to overlapping sites on importin-β. J Biol Chem. 2002b;277:50597–50606. doi: 10.1074/jbc.M209037200. [DOI] [PubMed] [Google Scholar]
- Beck M, Förster F, Ecke M, Plitzko JM, Melchior F, Gerisch G, Baumeister W, Medalia O. Nuclear pore complex structure and dynamics revealed by cryoelectron tomography. Science. 2004;306:1387–1390. doi: 10.1126/science.1104808. [DOI] [PubMed] [Google Scholar]
- Bednenko J, Cingolani G, Gerace L. Importin-β contains a COOH-terminal nucleoporin binding region important for nuclear transport. J Cell Biol. 2003;162:391–401. doi: 10.1083/jcb.200303085. [DOI] [PMC free article] [PubMed] [Google Scholar]
- Cronshaw J, Krutchinsky A, Zhang W, Chait B, Matunis M. Proteomic analysis of the mammalian nuclear pore complex. J Cell Biol. 2002;158:915–927. doi: 10.1083/jcb.200206106. [DOI] [PMC free article] [PubMed] [Google Scholar]
- Darden T, York D, Pedersen L. Particle mesh Ewald. An N·log(N) method for Ewald sums in large systems. J Chem Phys. 1993;98:10089–10092. [Google Scholar]
- de Gennes PG. Conformations of polymers attached to an interface. Macromolecules. 1980;13:1069–1075. [Google Scholar]
- Denning D, Rexach M. Rapid evolution exposes the boundaries of domain structure and function in natively unfolded FG nucleoporins. Mol Cell Proteomics. 2007;6:272–282. doi: 10.1074/mcp.M600309-MCP200. [DOI] [PubMed] [Google Scholar]
- Denning DP, Patel SS, Uversky V, Fink AL, Rexach M. Disorder in the nuclear pore complex: The FG repeat regions of nucleoporins are natively unfolded. Proc Natl Acad Sci USA. 2003;100:2450–2455. doi: 10.1073/pnas.0437902100. [DOI] [PMC free article] [PubMed] [Google Scholar]
- Feller SE, Zhang YH, Pastor RW, Brooks BR. Constant pressure molecular dynamics simulation — the Langevin piston method. J Chem Phys. 1995;103:4613–4621. [Google Scholar]
- Freddolino PL, Arkhipov A, Shih AY, Yin Y, Chen Z, Schulten K. Application of residue-based and shape-based coarse graining to biomolecular simulations. In: Voth GA, editor. Coarse-Graining of Condensed Phase and Biomolecular Systems. Chapman and Hall/CRC Press, Taylor and Francis Group; 2008. pp. 299–315. chapter 20. [Google Scholar]
- Frey S, Görlich D. A saturated FG-repeat hydrogel can reproduce the permeability properties of nuclear pore complexes. Cell. 2007;130:512–523. doi: 10.1016/j.cell.2007.06.024. [DOI] [PubMed] [Google Scholar]
- Frey S, Richter R, Görlich D. FG-rich repeats of nuclear pore proteins form a three-dimensional meshwork with hydrogel-like properties. Science. 2006;314:815–7. doi: 10.1126/science.1132516. [DOI] [PubMed] [Google Scholar]
- Gerace L, Burke B. Functional organization of the nuclear envelope. Annu Rev Cell Biol. 1988;4:335–374. doi: 10.1146/annurev.cb.04.110188.002003. [DOI] [PubMed] [Google Scholar]
- Görlich D, Kutay U. Transport between the cell nucleus and the cytoplasm. Annu Rev Cell Dev Biol. 1999;15:607–660. doi: 10.1146/annurev.cellbio.15.1.607. [DOI] [PubMed] [Google Scholar]
- Grubmüller H, Heller H, Windemuth A, Schulten K. Generalized Verlet algorithm for efficient molecular dynamics simulations with long-range interactions. Mol Sim. 1991;6:121–142. [Google Scholar]
- Gumbart J, Wang Y, Aksimentiev A, Tajkhorshid E, Schulten K. Molecular dynamics simulations of proteins in lipid bilayers. Curr Opin Struct Biol. 2005;15:423–431. doi: 10.1016/j.sbi.2005.07.007. [DOI] [PMC free article] [PubMed] [Google Scholar]
- Heller H, Schaefer M, Schulten K. Molecular dynamics simulation of a bilayer of 200 lipids in the gel and in the liquid crystal-phases. J Phys Chem. 1993;97:8343–8360. [Google Scholar]
- Humphrey W, Dalke A, Schulten K. VMD – Visual Molecular Dynamics. J Mol Graphics. 1996;14:33–38. doi: 10.1016/0263-7855(96)00018-5. [DOI] [PubMed] [Google Scholar]
- Isgro TA, Schulten K. Binding dynamics of isolated nucleoporin repeat regions to importin-β. Structure. 2005;13:1869–1879. doi: 10.1016/j.str.2005.09.007. [DOI] [PubMed] [Google Scholar]
- Isgro TA, Schulten K. Association of nuclear pore FG-repeat domains to NTF2 import and export complexes. J Mol Biol. 2007a;366:330–345. doi: 10.1016/j.jmb.2006.11.048. [DOI] [PubMed] [Google Scholar]
- Isgro TA, Schulten K. Cse1p binding dynamics reveal a novel binding pattern for FG-repeat nucleoporins on transport receptors. Structure. 2007b;15:977–991. doi: 10.1016/j.str.2007.06.011. [DOI] [PubMed] [Google Scholar]
- Lim R, Huang N, Köser J, Deng J, Lau K, Schwarz-Herion K, Fahrenkrog B, Aebi U. Flexible phenylalanine-glycine nucleoporins as entropic barriers to nucleocytoplasmic transport. Proc Natl Acad Sci USA. 2006;103:9512–7. doi: 10.1073/pnas.0603521103. [DOI] [PMC free article] [PubMed] [Google Scholar]
- Lim RYH, Aebi U, Fahrenkrog B. Towards reconciling structure and function in the nuclear pore complex. Histochem Cell Biol. 2008;129:105–116. doi: 10.1007/s00418-007-0371-x. [DOI] [PMC free article] [PubMed] [Google Scholar]
- Lim RYH, Fahrenkrog B, Koser J, Schwarz-Herion K, Deng J, Aebi U. Nanomechanical basis of selective gating by the nuclear pore complex. Science. 2007;318:640–643. doi: 10.1126/science.1145980. [DOI] [PubMed] [Google Scholar]
- Liu SM, Stewart M. Structural basis for the high-affinity binding of nucleoporin Nup1p to the Saccharomyces cerevisiae importin-β homologue, Kap95p. J Mol Biol. 2005;349:515–525. doi: 10.1016/j.jmb.2005.04.003. [DOI] [PubMed] [Google Scholar]
- Macara IG. Transport into and out of the nucleus. Microbiol Mol Biol Rev. 2001;65:570–594. doi: 10.1128/MMBR.65.4.570-594.2001. [DOI] [PMC free article] [PubMed] [Google Scholar]
- Marrink SJ, de Vries AH, Mark AE. Coarse grained model for semiquantitative lipid simulations. J Phys Chem B. 2004;108:750–760. [Google Scholar]
- Marrink SJ, Risselada J, Mark AE. Simulation of gel phase formation and melting in lipid bilayers using a coarse grained model. Chem Phys of Lipids. 2005;135:223–244. doi: 10.1016/j.chemphyslip.2005.03.001. [DOI] [PubMed] [Google Scholar]
- Martyna GJ, Tobias DJ, Klein ML. Constant pressure molecular dynamics algorithms. J Chem Phys. 1994;101:4177–4189. [Google Scholar]
- Milner ST. Polymer brushes. Science. 1991;251:905–914. doi: 10.1126/science.251.4996.905. [DOI] [PubMed] [Google Scholar]
- Morrison J, Yang J, Stewart M, Neuhaus D. Solution NMR study of the interaction between NTF2 and nucleoporin FxFG repeats. J Mol Biol. 2003;333:587–603. doi: 10.1016/j.jmb.2003.08.050. [DOI] [PubMed] [Google Scholar]
- Pemberton L, Paschal B. Mechanisms of receptor-mediated nuclear import and nuclear export. Traffic. 2005;6:187–198. doi: 10.1111/j.1600-0854.2005.00270.x. [DOI] [PubMed] [Google Scholar]
- Peters R. Translocation through the nuclear pore complex: Selectivity and speed by reduction-of-dimensionality. Traffic. 2005;6:421–427. doi: 10.1111/j.1600-0854.2005.00287.x. [DOI] [PubMed] [Google Scholar]
- Phillips JC, Braun R, Wang W, Gumbart J, Tajkhorshid E, Villa E, Chipot C, Skeel RD, Kale L, Schulten K. Scalable molecular dynamics with NAMD. J Comp Chem. 2005;26:1781–1802. doi: 10.1002/jcc.20289. [DOI] [PMC free article] [PubMed] [Google Scholar]
- Rexach M, Blobel G. Protein import into nuclei: Association and dissociation reactions involving transport substrate, transport factors, and nucleoporins. Cell. 1995;83:683–692. doi: 10.1016/0092-8674(95)90181-7. [DOI] [PubMed] [Google Scholar]
- Ribbeck K, Görlich D. The permeability barrier of nuclear pore complexes appears to operate via hydrophobic exclusion. EMBO J. 2002;21:2664–2671. doi: 10.1093/emboj/21.11.2664. [DOI] [PMC free article] [PubMed] [Google Scholar]
- Rout MP, Aitchison JD, Suprapto A, Hjertaas K, Zhao Y, Chait BT. The yeast nuclear pore complex: Composition, architecture, and transport mechanism. J Cell Biol. 2000;148:635–651. doi: 10.1083/jcb.148.4.635. [DOI] [PMC free article] [PubMed] [Google Scholar]
- Schlick T, Skeel R, Brünger A, Kalé L, Board JA, Jr, Hermans J, Schulten K. Algorithmic challenges in computational molecular biophysics. J Comp Phys. 1999;151:9–48. [Google Scholar]
- Shih AY, Arkhipov A, Freddolino PL, Schulten K. Coarse grained protein-lipid model with application to lipoprotein particles. J Phys Chem B. 2006;110:3674–3684. doi: 10.1021/jp0550816. [DOI] [PMC free article] [PubMed] [Google Scholar]
- Shih AY, Arkhipov A, Freddolino PL, Sligar SG, Schulten K. Assembly of lipids and proteins into lipoprotein particles. J Phys Chem B. 2007a;111:11095–11104. doi: 10.1021/jp072320b. [DOI] [PubMed] [Google Scholar]
- Shih AY, Freddolino PL, Arkhipov A, Schulten K. Assembly of lipoprotein particles revealed by coarse-grained molecular dynamics simulations. J Struct Biol. 2007b;157:579–592. doi: 10.1016/j.jsb.2006.08.006. [DOI] [PubMed] [Google Scholar]
- Shih AY, Freddolino PL, Arkhipov A, Sligar SG, Schulten K. Molecular modeling of the structural properties and formation of high-density lipoprotein particles. In: Feller S, editor. Current Topics in Membranes: Computational Modeling of Membrane Bilayers. Elsevier; 2008. pp. 313–342. chapter 11. [Google Scholar]
- Shih AY, Freddolino PL, Sligar SG, Schulten K. Disassembly of nanodiscs with cholate. Nano Lett. 2007c;7:1692–1696. doi: 10.1021/nl0706906. [DOI] [PubMed] [Google Scholar]
- Stewart M, Kent HM, McCoy AJ. Structural basis for molecular recognition between nuclear transport factor 2 (NTF2) and the GDP-bound form of the Ras-family GTPase Ran. J Mol Biol. 1998;277:635–646. doi: 10.1006/jmbi.1997.1602. [DOI] [PubMed] [Google Scholar]
- Strawn LA, Shen T, Shulga N, Goldfarb DS, Wente SR. Minimal nuclear pore complexes define FG repeat domains essential for transport. Nat Cell Biol. 2004;6:197–206. doi: 10.1038/ncb1097. [DOI] [PubMed] [Google Scholar]
Associated Data
This section collects any data citations, data availability statements, or supplementary materials included in this article.
Supplementary Materials
Movie 1 shows the formation of a brush-like structure in Sim_WT1. The initially fully extended segments coiled and shortened quickly coming to a dynamic equilibrium.
Movie 2 shows the formation of a brush-like structure in Sim_WT2.
Movie 3 shows the formation of a brush-like structure in Sim_MT.
Movie 4 shows the final CG structure of Sim_WT1. The constrained N-termini are depicted as red spheres. The segments form bundles of 2-6 individual chains; different bundles exhibit inter-crossing of nsp1 segments.
Movie 5 shows the final CG structure of Sim_WT2. The constrained N-termini are depicted as red spheres.
Movie 6 shows the final AA structure of Sim_WT1 in surface representation. The FG-repeats are clolored with PHE in orange and GLY in green. Many FG-repeats are exposed on the surface of the structure, offering energetically favorable interaction spots to transport receptors.
Movie 7 shows the final AA structure of Sim_WT2 in surface representation.
Movie 8 shows the final CG structure of Sim_MT. The constrained N-termini are depicted as red spheres. The segments also form bundles with 2-6 individual chains, with a larger height compared to the wildtype case. The bundles inter-cross less with each other, leaving wider space for passage.
Movie 9 shows the process of FG-repeat binding to NTF2 binding spot 2. The process of binding to NTF2 binding spot 2 for PHE343 and PHE341 (both of segment D16) is shown with PHE343 and PHE341 in orange, and segment D16 in yellow. The exchange of binding between PHE343 and PHE341 resulted in a motion of NTF2 along the direction of segment D16; this motion can be clearly recognized in the movie. Ruler grids are also shown in the movie, with each grid being 10 Å × 10 Å.
Movie 10 shows the process of FG-repeat binding to NTF2 binding spot 1.3. The process of binding to NTF2 binding spot 1.3 for PHE360 of segment D15 is shown with PHE360 and PHE362 in orange, and segment D15 in yellow. PHE360 was drawn towards NTF2 from further away during the simulation. Ruler grids are also shown in the movie, with each grid being 10 Å × 10 Å.