

Abstract
Introduction
The generation of new neurons occurs throughout adulthood in discrete brain regions, and may be regulated by neuropsychiatric diseases and therapeutic drug treatments. Most current methods that study this process measure the labeling of newborn cells by 5-bromo-2-deoxyuridine (BrdU) using immunohistochemical methods followed by the microscopic counting of BrdU positive cells. This method is time consuming and labor intensive, typically taking several weeks to analyze.
Methods
Therefore, we characterized a method to measure BrdU incorporation in the adult mouse hippocampus in vivo by using flow cytometry, which normally allows analysis of data within a single day.
Results
The present study compared multiple BrdU dosing and loading protocols to determine a dosing strategy that produced the best signal to noise ratio. BrdU incorporation was also compared across different brain regions. The method was sensitive to a number of experimental disease manipulations. Induction of type-1 diabetes and depletion of norepinephrine reduced hippocampal cell proliferation. In contrast, chronic administration of electroconvulsive shock, a somatic treatment for depression, as well as chronic treatment with the antidepressant fluoxetine elevated hippocampal cell proliferation. This increase in cell proliferation with fluoxetine was detected as early as 14 days into treatment. Moreover, comparing measures of cell proliferation obtained by immunohistochemical and flow cytometric methods within the same animals were convergent and significantly correlated to each other. Flow cytometry was also sufficiently sensitive to quantify the survival of newly born cells.
Discussion
These experiments validate the utility of flow cytometry in analyzing hippocampal cell proliferation and survival in a reliable and high-throughput fashion. The speedy analysis afforded by flow cytometry lends itself to be utilized in novel drug discovery and physiology.
Keywords: Antidepressants, Diabetes, DSP-4, Fluoxetine, Flow cytometry, Hippocampus
1. Introduction
The persistence of brain neurogenesis through the life span in different species of mammals and birds has now been well established (Gould, 2007). In the rodent, brain regions that support neurogenesis include the subventricular zone (SVZ), projecting a chain of neurons to the olfactory bulb, and the subgranular zone (SGZ) of the hippocampus, generating neurons that migrate within the granule cell layer (GCL). Neurogenesis is a general term that defines a complex process of cell generation, including proliferation of multipotent stem cells, differentiation into distinct neuronal subtypes, and survival of neurons for incorporation into cellular networks (Ehninger and Kempermann, 2008). The neurogenic zones are differentially regulated and under the control of specific neurotransmitters and hormones (Balu and Lucki, 2008; Zhao et al., 2008).
Various particular functions have been proposed for neurogenesis in different brain regions. The most generally significant role of neurogenesis, though, may be its participation in various psychiatric and neurodegenerative diseases. The neurogenic hypothesis of depression postulates that a reduced production or survival of new neurons in the hippocampus is associated with chronic stress and that chronic administration of antidepressant drugs increases cell proliferation leading directly to changes in behavior (Dranovsky and Hen, 2006; Duman and Monteggia, 2006). Schizophrenia is associated with disrupted cell proliferation in the hippocampus (Reif et al., 2006) and various genes associated with schizophrenia (e.g., disrupted in schizophrenia −1, DISC1) are also involved in the regulation of neurogenesis (Duan et al., 2007). Prolonged limbic seizures stimulate hippocampal neurogenesis in animal studies and disperse neurogenic cells to ectopic locations that could participate in recruiting additional seizures and lead to epilepsy (Parent, 2007). In most mouse models of familial Alzheimer’s disease, there is a decrease in basal hippocampal neurogenesis, which seems to be attributable to a reduction in the survival of the newborn cells (Thompson et al., 2008).
Understanding the pharmacological regulation of neurogenesis is important because it may lead to the discovery of new treatments for intractable diseases. However, the techniques commonly used to measure the effects of drug treatments on neurogenesis are quite slow and manpower intensive. Neurogenesis can be studied ex vivo, in culture, where the rate of cell proliferation can be measured over days under controlled conditions (Golmohammadi et al., 2008; Sato et al., 2008). In the brain, neurogenesis is commonly examined by measuring the incorporation BrdU into specific tissues hours to days after systemic injection of animals (Gratzner, 1982; Dolbeare, 1996). Neurogenesis is quantified by immunohistochemical development of BrdU and the number of incorporated cells in specific tissues is visually counted. This process is quite time consuming, a pharmacological study could take months for analysis. Subjective application of criteria for cell counting may vary between individuals requiring the same person to complete an entire experiment and making replication between laboratories more difficult. These aggregate technical restrictions have delayed and limited the process of drug discovery for neurogenesis.
The purpose of this paper is to describe the development of a method by our research group to measure BrdU incorporation in brain tissue using flow cytometry. It is similar in principle to techniques used to study the generation of peripheral lymphocytes by measuring BrdU incorporation in cells with flow cytometry (Allman et al., 1993). Techniques for the use of flow cytometry for examining hippocampal cell proliferation rapidly has been described recently by measuring BrdU incorporation (Bilsland et al., 2006) or incorporation of radiolabeled water (Shankaran et al., 2006). The advantage of flow cytometry is that it can measure neurogenesis rapidly and objectively, with most studies completed within a day. In this paper, we describe a series of characterization studies that measured BrdU incorporation with flow cytometry using methods, similar to those described by Bilsland et al (2006). These studies expanded on what had been previously published by establishing essential conditions for measuring BrdU incorporation, quantifying the proliferation and survival of progenitor cells in the hippocampus and other brain regions, and establishing the suitability of using flow cytometry for measuring changes in proliferative activity produced by lesions, disease models, and chronic drug treatments. Moreover, they establish the validity of using flow cytometry for measuring neurogenesis by comparing the results of experiments using flow cytometry with current and previously published findings using immunohistochemistry. Because studies of neurogenesis in the mouse can now be done rapidly, the development of flow cytometry to measure cell proliferation and survival in brain tissue may ultimately stimulate physiological and drug discovery research for psychiatric and neurologic diseases.
2. Methods
2.1. Animals
Adult male CD-1 (Harlan, Indianapolis, IN, USA), C57BL/6J and MRL/MpJ mice (Jackson Laboratories, Bar Harbor, ME, USA) were 8-9 weeks old at the beginning of all studies. The animals were housed in groups of five in polycarbonate cages and maintained on a 12-h light/dark cycle (lights on at 07:00 hours) in a temperature (22°C)- and humidity-controlled colony. The animals were given free access to food and water. Animal procedures were conducted in accordance with the guidelines published in the NIH Guide for Care and Use of Laboratory Animals and all protocols were approved by the Institutional Animal Care and Use Committee at the University of Pennsylvania and at Wyeth Research.
2.2. Drug treatments
2.2a. BrdU loading protocols
Different loading protocols were compared to establish the optimal conditions for measuring the incorporation of BrdU in brain tissue using flow cytometry. 5-Bromo-deoxyuridine (BrdU; Roche Applied Sciences Indianapolis, IN) was dissolved in warm saline at a concentration of 10 mg/ml and was administered by intraperitoneal (i.p.) injection in a volume of 10 ml/kg. C57BL/6J mice (n=5/group) were sacrificed 24 hours after the last BrdU injection. Using a four-day loading protocol, BrdU was given once daily for four consecutive days at 50, 100, or 200 mg/kg. To establish the effects of a single injection of BrdU, separate groups of mice were given 100, 200, or 400 mg/kg of BrdU. For all experiments involving the manipulation of hippocampal cell proliferation by drug treatments or lesions, mice were injected with 100 mg/kg of BrdU once daily for four consecutive days and sacrificed 24 hours after the last BrdU injection. To analyze cell survival, mice were loaded with BrdU (1 injection of 100 mg/kg per day for four days) and then sacrificed 1 day, 7 days, or 21 days after the last BrdU injection.
2.2b. Streptozotocin-induced diabetes
C57BL/6J mice were made diabetic by receiving a single i.p. injection of vehicle (n=12) or streptozotocin (STZ; Sigma St. Louis, MO; 195 mg/kg; n=8). STZ was dissolved in a 0.1M sodium citrate buffer (pH 4.5) and injected at a volume of 10 ml/kg (Beauquis et al., 2006). Blood glucose was measured in the morning without fasting, 10 days after the STZ injection to confirm the onset of diabetes. Three mice that did not meet the criterion (blood glucose higher than 250 mg/dl) were excluded from the study. Six weeks after injection of STZ, mice were administered BrdU and sacrificed for analysis.
2.2c. Depletion of norepinephrine
Forebrain norepinephrine was depleted in CD-1 mice by administering a single i.p. injection of vehicle (n=8) of the toxin N-Ethyl-N-(2-chloroethyl)-2-bromobenzylamine hydrochloride (DSP-4; Sigma St. Louis, MO; 50 mg/kg; n=8) at a volume of 10 ml/kg. DSP-4 was dissolved in deionized water (O’Leary et al., 2007). Four days after DSP-4 administration, mice received BrdU and were sacrificed for analysis. The contralateral hippocampal lobe from each animal was retained for verification of the depletion of monoamine content. The tissue was snap frozen in isopentane, and stored at -80°C until analysis of monoamine content by high pressure liquid chromatography (HPLC).
2.2d. Pharmacologic antidepressant treatments
MRL/MpJ mice were administered i.p. injections of vehicle or the selective serotonin reuptake inhibitor fluoxetine HCl (Anawa, Zurich; 5 mg/kg)twice daily for 21 days (n = 10 / group). The dose was calculated according to the base weight of the drug (Lagace et al., 2007) and given twice daily in a volume of 10 ml/kg because of its expected 12-hour half life (Hirano et al., 2005). Animals received once daily i.p. injections of BrdU (100 mg/kg) during the last four days of antidepressant treatment. Mice were sacrificed 24 hours after the last drug treatment. One lobe of the hippocampus was analyzed by flow cytometry and the other hemisphere was analyzed by immunohistochemistry and manual counting. Separate MRL/MpJ mice were administered fluoxetine (5 mg/kg, b.i.d.) for either 7, 14, or 21 days and received a single BrdU (200 mg/kg) injection one hour after the morning fluoxetine injection on the last day of treatment. Mice were sacrificed 24 hours after the last fluoxetine injection.
2.2e. Electroconvulsive shock
This experiment was performed at Wyeth Research in Princeton, NJ in accordance with animal protocols at Wyeth. The electroconvulsive seizure (ECS) procedure followed in this study was based on the protocol described by Pieper et al. (2005). MRL/MpJ mice were administered sham (n=10) or ECS (n=8) for five consecutive days. To administer the ECS, the mouse was lightly restrained by being wrapped in a paper towel with its head exposed. Conducting jelly was applied to the ears and electric current was administered between two earclip electrodes (11-15 mA, 0.5 sec) using an electroshock generator (Ugo Basile, Italy). Shock amperages were selected based on the minimum thresholds required to induce a full tonic-clonic seizure determined on the first day of treatment. Sham-stimulated animals received the same treatment, except that no current was administered. This level and duration of shock produces a seizure that lasts less than 1 min and is characterized by full extension of the hind limbs (tonic phase) for 10-15 sec, followed by repetitive flexion-extension of the forelimbs for 10-15 sec (clonic phase). After the cessation of the shock, each mouse was placed in a plastic cage where it remained singly housed for one hour, at which point it was returned to its home cage. Similar ECS protocols have been shown to elevate hippocampal cell proliferation in rats (Malberg et al., 2000) and in mice (Pieper et al., 2005). On days 2-5 of treatment, mice were also injected with BrdU (100 mg/kg; i.p.). Mice were sacrificed 24 hours after the last ECS administration, and the hippocampi were processed for flow cytometry at Wyeth Research.
2.3. Brain dissection and cell preparation
Mice were decapitated, their brains quickly removed, and dissected on ice. For measurement of cell proliferation in the hippocampus, a single hippocampal lobe was removed and placed in an eppendorf tube containing 30 μl of Hank’s Balanced Salt Solution (HBSS, Gibco Grand Island, NY). Other brain regions analyzed for BrdU incoroporation included the subventricular zone, amygdala, and cerebellum. The tissue was then finely minced in the eppendorf tubes using surgical scissors. To that tube, 0.5 ml of an enzymatic cocktail (1mg/mL papain, Roche Applied Sciences Indianapolis, IN; 0.1M L-cysteine, Sigma St. Louis, MO) was added, and incubated in a dry heat block at 37°C for 15 minutes. In order to stop the enzymatic digestion, an equal amount of Hibernate-A (Brain Bits Springfield, IL) containing 10% heat-inactivated fetal bovine serum (FBS; Gibco Grand Island, NY) was added to each tube. The tissue was mechanically triturated in a 5 ml flow cytometry tube using fire-polished nine-inch, glass Pasteur pipettes. A single-cell suspension was created by triturating 7-8 times with a large bore pipette, followed by trituration (7-8 times) with a small bore pipette. The samples were allowed to stand in order for the large debris to settle. The single-cell suspension was transferred to an eppendorf tube, and centrifuged at 300 × g for 5 minutes.
2.4. BrdU staining for flow cytometry
The supernatant was removed and the resultant cells were stained using the FITC BrdU Flow Kit (BD Biosciences San Jose, CA). The cells were fixed and permeablized by resuspending in 100 μL of Cytofix/Cytoperm (BD Biosciences) buffer at room temperature for 30 minutes, followed by the addition of 1 ml of wash buffer (BD Biosciences). The samples were spun at 300 × g for 5 minutes and the supernatant was aspirated. The cells were resuspended in 100 μl of Cytoperm Plus buffer (BD Biosciences) on ice for ten minutes. After washing and centrifuging, the cells were resuspended in 100 μl of Cytofix/Cytoperm buffer at room temperature for 5 minutes. The cells were then resuspended in 100 μL of DNAse (30 μg; stock from kit was diluted in PBS (Ca2+/Mg2+ free) containing 0.1 mM CaCl2 and 10 mM MgCl2) in a dry heat block at 37°C for 1 hour. Following washing and centrifuging, the cells were resuspended in 50 μl of FITC-conjugated anti-BrdU (1:50 dilution) in the dark, at room temperature for 20 minutes. After the samples were washed, they were resuspended with 20 μl of the nuclear marker, 7-AAD, at room temperature in the dark. The cells were then resuspended in 1 ml of staining buffer (PBS, 3% FBS, 0.09% sodium azide). Prior to analysis, cells were filtered through a cell strainer cap (30 μm) to remove debris. The data was collected the same day on a BD FACS Canto system at the University of Pennsylvania flow cytometry core facility. Background signal was based on data collected from animals that were not injected with BrdU. The data was analyzed using Winlist 6.0 software.
2.5. Cell preparation and BrdU staining for flow cytometry performed at Wyeth Research
The methods used at Wyeth Research were similar to those at the University of Pennsylvania except for the following procedural differences. First, the tissue was enzymatically digested in a dry heat block at 37°C for 30 minutes. Second, following the initial 30 minute incubation in Cytofix/Cytoperm buffer, the cells were suspended in 1 ml of staining buffer and stored overnight at 4°C. The staining of the cells and flow cytometric analysis was completed the next day. Finally, the data was collected and analyzed on a BD Vantage FACS system at Wyeth Research. Aliquots of the same samples were stored at 4°C and shipped via overnight courier to UPENN for subsequent analysis on a BD FACS Canto system the following day.
2.6. BrdU immunohistochemistry and manual counting
Contralateral hemispheres from the brains of mice used in the flow cytometry study were postfixed in 4% paraformaldehyde for 7 days. The brains were then transferred to a 30% sucrose solution for 5 days, at which point they were removed and placed in the −80°C until they were sliced.
Coronal sections (40 μm) from the entire rostrocaudal extent of the dentate gyrus were cut from a single hemisphere on a cryostat at -20°C. Every 6th slice was mounted in groups of 10-12 per slide (Superfrost plus), dried overnight, and processed for BrdU using peroxidase methods. Slide mounted tissue was heated in 0.1 M citric acid (pH 6.0), rinsed in 0.1M PBS (pH 7.4), and incubated in trypsin for 10 min. Slides were rinsed again, denatured in 2M HCL for 30 min, rinsed, and incubated overnight in primary mouse anti-BrdU (1:200 Becton Dickinson) and 0.5% Tween 20 (1:200) in PBS while stored at 4°C. The next day the slides were subjected to a series of PBS rinses and incubated for 1 hr in biotinylated antimouse antibody (1:200). After another series of rinses the sections were then incubated in avidinbiotin– horseradish peroxidase for 1 hour, and then stained with diaminobenzidine for 5 min. After rinsing in PBS, slides were counterstained with cresyl violet, dehydrated in a series of alcohol rinses, cleared with Xylene and coverslipped with Permount (Fisher Scientific, Fair Lawn, NJ)
Slides were coded prior to quantitative analysis and all cell counts were conducted blind to the experimental conditions. For peroxidase stained tissue, cells were visualized under 1000x (100x oil immersion objective with a 10x ocular) magnification on a Nikon eclipse E600 light microscope (Nikon Instruments, Melville, New York). Counts were recorded for the number of BrdU labeled cells on every 6th section in a single hemisphere of the entire rostrocaudal extent of the dentate gyrus. The number of BrdU-labeled cells was estimated using a modified unbiased stereology protocol that had previously been reported to successfully quantify BrdU labeling. Cell counts were obtained for the combined subgranular zone (SGZ) and granule cell layer (GCL) avoiding cells in the outermost focal plane. The number of counted cells was than multiplied by 12 (number of intervening slices × number of hemispheres) to give an estimate of the total number of BrdU labeled cells in the dentate gyrus. Only slides with between 8 and 10 countable sections were included for analysis.
2.7. Statistical analysis
Unpaired Student’s t-test was used to compare the effects of STZ, DSP-4, ECS, and chronic fluoxetine on cell proliferation with their corresponding control groups. Linear regression analysis was performed to determine the correlation between methods. For the fluoxetine time course experiment, comparisons were made using two-way analysis of variance (ANOVA) followed by Scheffe post-hoc analysis. The criterion for statistical significance used was p < 0.05.
3. Results
3.1. Comparison of BrdU loading protocols
The amount of BrdU labeling detected in the hippocampus was investigated following single and multiple injection loading paradigms. For a single injection of BrdU (Fig. 1a), there was a dose-dependent increase in the number of BrdU positive cells detected, with the 200 mg/kg dose producing a maximal signal. For the multiple injection loading protocol shown in Fig. 1b, (1 injection of BrdU × four days), increases in dose produced greater incorporation of BrdU, with the 100 and 200 mg/kg doses of BrdU defining the maximal effect. Since a single hippocampal lobe is sufficient to analyze BrdU incorporation using flow cytometry, proliferation in the two lobes from the same animal was compared. There were no differences in the proliferative rates between the left and right hippocampus (left: 35 ± 6, right: 28 ± 2; t(4) = 1.13, p = 0.32). For all experiments involving the manipulation of hippocampal cell proliferation by drug treatments or lesions, mice were injected with 100 mg/kg of BrdU once daily for four consecutive days and sacrificed 24 hours after the last BrdU injection.
Fig. 1.
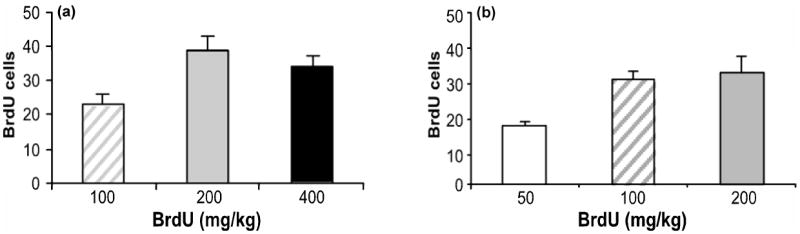
Comparison of BrdU loading protocols. (a) A single injection of BrdU (100, 200, 400 mg/kg; n = 5/dose) was given and mice were sacrificed 24 hours later. (b) BrdU (50, 100, 200 mg/kg; n = 5/dose) was injected once daily for four consecutive days and mice were sacrificed 24 hours later. Values are expressed as the number of BrdU positive cells per 10,000 7-AAD events. Bars represent mean values ± s.e.m.
3.2. Cell proliferation in multiple brain regions
BrdU incorporation using flow cytometry was examined in other brain regions. One area known to have a high level of proliferative activity is the subventricular zone (SVZ). Flow cytometry demonstrated that cell proliferation in the SVZ was 7–fold higher than in the hippocampus (Fig. 2; F3,15 = 64.44, p < 0.01), which is in agreement with a comparison of these regions reported using immunohistochemistry (Kim et al., 2006). BrdU incorporation also measured lower levels of proliferative activity in other brain regions (Fig. 2). Compared with the hippocampus (47 ± 8 cells), BrdU incorporation was lower in the cerebellum (25 ± 4 cells) and the amygdala (22 ± 5 cells).
Fig. 2.
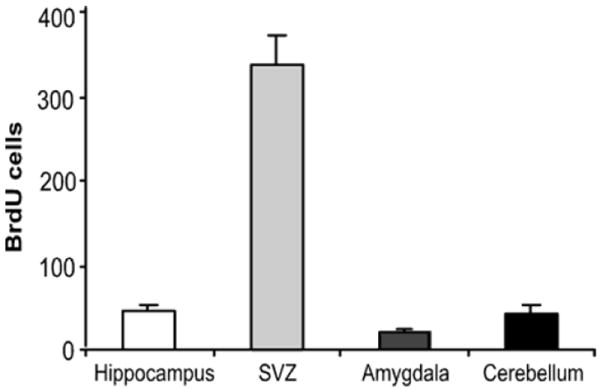
Comparison of BrdU incorporation across multiple brain regions. BrdU (100 mg/kg) was administered once daily for four consecutive days and mice were sacrificed 24 hours after the last injection. BrdU incoporation was measured in the hippocampus, subventricular zone (SVZ) amygdala, and cerebellum (n = 5/region). Values are expressed as the number of BrdU positive cells per 10,000 7-AAD events. Bars represent mean values ± s.e.m.
3.3. Measurement of survival of adult-born hippocampal cells
In order to determine the survival rate of the newly born cells, mice were sacrificed at various time points following the last BrdU administration (F2,20 = 23.88; p < 0.001). As shown in Fig. 3, 55% and 65% fewer BrdU positive cells remained seven and 21 days, respectively, after the last BrdU injection. This rapid decay function is in agreement with what has been reported using immunohistochemistry in the mouse (Cho et al., 2008; Navailles et al., 2008).
Fig. 3.
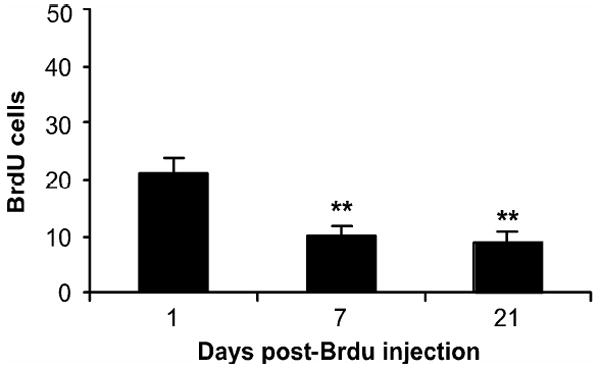
Survival curve for adult-born hippocampal cells. MRL/MpJ mice were injected with BrdU (100 mg/kg) once daily for four days and then sacrificed 1, 7, or 21 days (n = 5/group) following the last BrdU injection. Values are expressed as the number of BrdU positive cells per 10,000 7-AAD events. Bars represent mean values ± s.e.m. Asterisk indicates groups that differed significantly from the 1-day post BrdU injection group (** p < 0.005) according to Newman-Keul’s post-hoc analysis.
3.4. Type-I diabetes reduces hippocampal cell proliferation
In order to further validate the use of flow cytometry, changes in cell proliferation were examined after manipulations shown to reduce neurogenesis. Streptozotocin (STZ), which destroys the insulin producing cells of the pancreas, was used to induce experimental type-1 diabetes. Six weeks after the induction of diabetes, hippocampal cell proliferation was reduced by 25% (Fig. 4a; t(18) = 2.53, p = 0.02). The magnitude of decrease was consistent with what has been reported in the literature using immunohistochemistry (Beauquis et al., 2006). The mice that were treated with STZ had significantly higher blood glucose levels than vehicle treated mice (vehicle: 168 ± 7 mg/dl; STZ: 416 ± 28 mg/dl; t(18) = 9.34, p < 0.001).
Fig. 4.
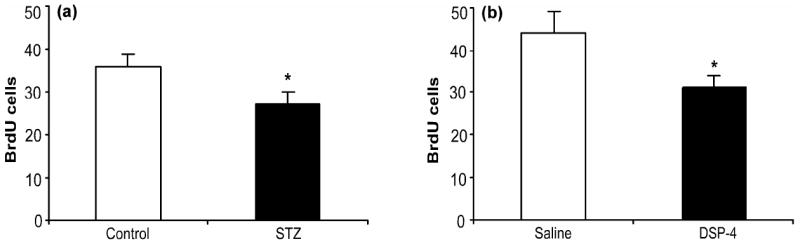
Type-I diabetes and norepinephrine depletion reduce hippocampal cell proliferation. (a) Mice were injected with vehicle (n = 12; open bar) or streptozotocin (STZ; 195 mg/kg; n = 8; black bar). Six weeks after induction of diabetes, mice received once daily injections (four days) of BrdU (100 mg/kg) and sacrificed 24 hours after the last injection. (b) Mice were injected with saline (n = 8; open bar) or DSP-4 (50 mg/kg; n = 8; black bar). On days 5-8 after saline or DSP-4 treatment, mice received once daily injections of BrdU (100 mg/kg) and were sacrificed 24 hours after the last injection. Values are expressed as the number of BrdU positive cells per 10,000 7-AAD events. Bars represent mean values ± s.e.m. Asterisk indicates groups that differed significantly from control (* p < 0.05) according to unpaired Student’s t-test.
3.5. Norepinephrine depletion reduces hippocampal cell proliferation
Administration of the toxin DSP-4, which destroys noradrenergic cell bodies in the locus coeruleus, was used to deplete norepinephrine in the forebrain. Eight days after depletion, cell proliferation in the hippocampus was decreased by 30% (Fig. 4b; t(14) = 2.26, p = 0.04). Again, this was in agreement with what has been found using conventional immunohistochemical methods (Kulkarni et al., 2002). This reduction in cell proliferation was paralleled by selective reductions in hippocampal norepinephrine content (saline: 404 ± 36 pg/g tissue, DSP-4: 60 ± 6 pg/g tissue; t(14) = 9.43, p < 0.001). There were no significant changes in the hippocampal tissue content of serotonin (saline: 368 ± 40 pg/g tissue, DSP-4: 352 ± 24 pg/g tissue, t(14) = 0.34, p = 0.74) and dopamine (saline: 96 ± 5, DSP-4: 93 ± 8 pg/g tissue, t(14) = 0.40, p = 0.70).
3.6. Regulation of hippocampal cell proliferation by electroconvulsive shock
Repeated administration of electroconvulsive shock (ECS) produces increases in hippocampal neurogenesis. Five days of ECS were administered to MRL/MpJ mice and cell proliferation in the hippocampus was quantified using flow cytometry. As shown in Fig. 5, repeated ECS treatment produced a two-fold elevation in proliferative activity when measured at the Wyeth site (t(17) = 3.97, p = 0.001). Analysis of samples at the University of Pennsylvania flow cytometry core facility confirmed this effect (t(17) = 5.40, p < 0.001). There was a significant correlation between the data collected at both sites across individual animals (r(17) = 0.70, p < 0.001). This demonstrates that similar results can be obtained from samples measuring BrdU incorporation at different sites on different flow cytometer systems and analyzed using different software. The magnitude of change was similar to that shown using immunohistochemistry in rats (Malberg et al., 2000) and in mice (Pieper et al., 2005).
Fig. 5.
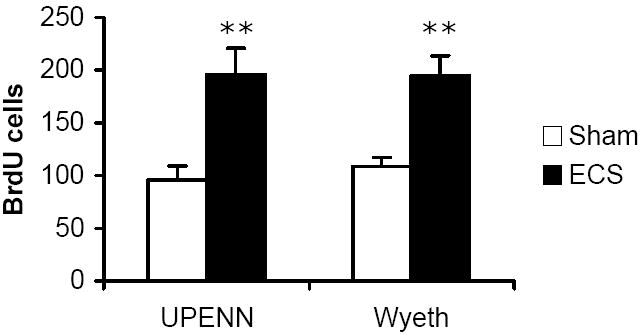
Chronic ECS increases hippocampal cell proliferation. Mice were administered sham (n = 10; open bar) or electroconvulsive shock (ECS; n = 8; black bar) for five consecutive days. On days 2-5 of treatment, animals received once daily injections of BrdU (100 mg/kg), and were sacrificed 24 hours after the last injection. Values are expressed as the number of BrdU positive cells per 10,000 7-AAD events. Bars represent mean values ± s.e.m. Asterisk indicates groups that differed significantly from control (** p < 0.005) according to unpaired Student’s t-test. Part of the sample from each animal was measured at Wyeth and the remaining sample was measured at the University of Pennsylvania flow cytometry core.
3.7. Regulation of hippocampal cell proliferation by pharmacologic antidepressant treatments
Chronic administration of antidepressants also increases hippocampal neurogenesis (Dranovsky and Hen, 2006). Treatment of MRL/MpJ mice for three weeks with the selective serotonin reuptake inhibitor, fluoxetine (5 mg/kg b.i.d), caused a three-fold elevation in hippocampal cell proliferation as measured by flow cytometry (Fig. 6a; t(17) = 6.61, p < 0.001). The contra-lateral hippocampus from each animal was fixed and used as an internal control to compare flow cytometry with immunohistochemical analysis across individuals. Measurement of BrdU positive cells by manual counting also produced a three-fold elevation in cell proliferation (Fig. 6b; t(12) = 17.71, p < 0.001). The results obtained by flow cytometry and manual counting across individual animals were significantly correlated (Fig. 6c; r(12) = 0.62, p < 0.01).
Fig. 6.
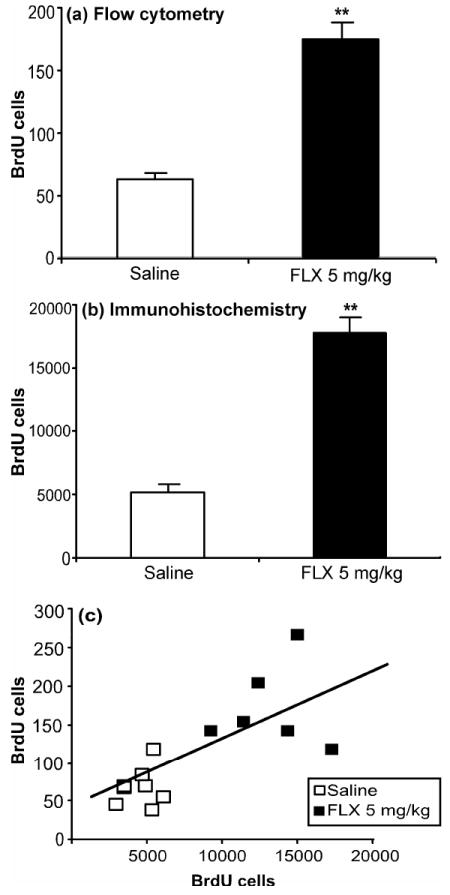
Chronic fluoxetine treatment increases hippocampal cell proliferation. Mice were administered saline (n = 10; open bar) or fluoxetine (FLX; 5 mg/kg b.i.d.; n = 10; black bar) for three weeks and BrdU (100 mg/kg) was given during the last four days of drug treatment. Animals were sacrificed 24 hours after the last drug treatment. (a) Cell proliferation was analyzed by flow cytometry and (b) immunohistochemistry from the same mice. (c) Results from both methods were significantly correlated (r = 0.67; p < 0.01). Values are expressed as the number of BrdU positive cells per 10,000 7-AAD events and per hippocampus for (a) and (b), respectively. Bars represent mean values ± s.e.m. Asterisk indicates groups that differed significantly from saline (** p < 0.005) according to Student’s t-test.
3.8. Onset of action for the proliferative effects of fluoxetine
Repeated administration of antidepressant drugs for is required to enhance hippocampal cell proliferation (Malberg et al., 2000). In order to demonstrate how flow cytometry can be used to determine the time course of antidepressant response, MRL/MpJ mice were administered fluoxetine (5 mg/kg) for either 7, 14, or 21 days. In addition, to more clearly assess the effects of fluoxetine on cell proliferation, a single injection of BrdU (200 mg/kg) was given to label dividing cells only on the last day of antidepressant treatment. There was a significant treatment × days interaction (F2,40= 9.52; p < 0.001). As shown in Fig. 7, fluoxetine produced a significant increase in proliferation only following 14 (60%; p < 0.05) or 21 (200%; p < 0.01) days of fluoxetine treatment. Fluoxetine was ineffective at changing proliferation when given up to 7 days. Scheffe post-hoc analysis (p = 0.04) also revealed that cell proliferation in mice treated with fluoxetine for 21 days was greater compared to the proliferation in mice that received 14 days of fluoxetine treatment.
Fig. 7.
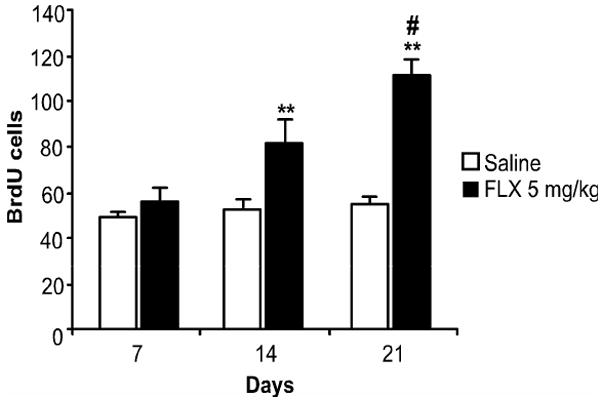
Onset of action for the proliferative effects of fluoxetine. Mice were administered saline (n = 10; open bar) or fluoxetine (FLX; 5 mg/kg; n = 10/treatment duration; black bar) for 7, 14, or 21 days. Mice were given a single injection of BrdU (200 mg/kg) on the last day of fluoxetine treatment and were sacrificed 24 hours later. Values are expressed as the number of BrdU positive cells per 10,000 7-AAD events. Bars represent mean values ± s.e.m. Asterisk indicates groups that differed significantly from their corresponding saline controls (** p < 0.005), and the pound sign indicates groups that differed significantly from the 14d fluoxetine group (# p < 0.05) according to Scheffe post-hoc analysis.
4. Discussion
A method for the quantification of in vivo BrdU labeling from adult murine brain tissue using flow cytometry was characterized. The assay was sensitive enough to detect BrdU incorporated into cells of the hippocampus and SVZ, as well as the amygdala and cerebellum, regions with less proliferative activity. Moreover, flow cytometry was able to quantify cells labeled with BrdU up to three weeks prior, allowing measurement of cell proliferation and survival. Several manipulations known to down or up-regulate neurogenesis were performed in an effort to validate the utility of the assay. A decrease in proliferation was produced by the induction of experimental type-I diabetes or following the depletion of hippocampal norepinephrine content. Increases in cell proliferation were measured following repeated administration of ECS. The magnitude of all these effects measured using flow cytometry were similar to what has been reported in the literature using immunohistochemistry. Moreover, chronic administration of fluoxetine for 14 and 21 days, but not 7 days, robustly elevated cell proliferation in the hippocampus. The results obtained by flow cytometry after fluoxetine administration for 21 days were correlated with those obtained from manual counting.
The first step in the characterization of this method of measuring proliferating cells was to determine the dose of BrdU that would produce maximal labeling, without producing toxic side effects that have been associated with high doses of BrdU (Taupin, 2007). The 100 and 200 mg/kg doses produced comparable labeling of hippocampal progenitors when given once daily for four days. Therefore, the lower dose was used for all validation experiments. The 200 mg/kg dose produced maximal labeling in a single-injection protocol, which is more appropriate for some experiments, and was therefore used in the fluoxetine time-course experiment.
The generation of new neurons into adulthood occurs most prominently in the dentate gyrus of the hippocampus and in the SVZ, which lines the lateral ventricles. In addition to these two neurogenic zones, other brain regions retain proliferative capacities into adulthood, albeit to a lesser extent than the hippocampus and SVZ. These include the hypothalamus, striatum, neocortex, and amygdala, although whether functioning neurons are created in these regions is still uncertain (Gould, 2007). Flow cytometry was utilized to make regional comparisons of BrdU incorporation. The rate of proliferation in the SVZ was seven-fold higher than in the hippocampus, which agrees with immunohistochemical comparisons (Kim et al., 2006). Moreover, this method was sensitive enough to detect BrdU incorporation in the amygdala and cerebellum, areas of much lower adult cytogenesis (Gould, 2007). In these brain regions, the progenitor cells are diffuse and not isolated to discrete neurogenic zones, a characteristic that makes manual counting difficult. The cellular resolution provided by flow cytometry makes this technology ideal for measuring proliferation in tissues with sparsely distributed cells.
Numerous physiologic factors regulate adult hippocampal neurogenesis (Balu and Lucki, 2008; Zhao et al., 2008). One such process is glucose homeostasis. Diabetes, which is characterized by elevated levels of circulating glucose, produces reductions in hippocampal neurogenesis that are associated with deficits in hippocampal-dependent tasks (Beauquis et al., 2006; Beauquis et al., 2008). Administration of STZ and induction of type-1 diabetes, reduced hippocampal cell proliferation as measured with flow cytometry.
Neurotransmitter systems are also involved in regulating the various stages of neurogenesis (Balu and Lucki, 2008; Zhao et al., 2008). There are extensive noradrenergic projections to the hippocampus originating from the locus ceruleus. In the rat, destruction of these noradrenergic cell bodies with DSP-4 reduced cell proliferation, but not survival, of hippocampal progenitors (Kulkarni et al., 2002). Quantification of BrdU by flow cytometry revealed a significant reduction in hippocampal cell proliferation following the administration of DSP-4. This is the first demonstration of noradrenergic tone regulating cell proliferation in the mouse. The decrease in proliferation was accompanied by the selective depletion of norepinephrine in the hippocampus. This suggests that hippocampal norepinephrine may in part, be involved in maintaining a basal rate of neurogenesis.
Hippocampal neurogenesis has been implicated in depression (Dranovsky and Hen, 2006), and is thought of as a potential target for therapeutic intervention. Although consistent with evidence for morphological deficits associated with depression, the generation of new neurons in the adult hippocampus might be more important for the therapeutic response produced by antidepressant treatments (Sahay and Hen, 2007). Flow cytometry successfully quantified elevations in BrdU incorporation following repeated administration of ECS, a somatic treatment for depression. Chronic treatment with the pharmacologic antidepressant fluoxetine produced robust elevations in cell proliferation. Moreover, the levels of cell proliferation after fluoxetine treatment obtained by immunohistochemical and flow cytometric methods within the same animals were convergent and significantly correlated to each other. This demonstration is similar to that provided by Bilsland et al. (2006) in their original characterization studies.
Hippocampal neurogenesis is a candidate biochemical readout for novel drug discovery in a number of disease areas, including depression, schizophrenia, epilepsy, diabetes and Alzheimer’s disease (Balu and Lucki, 2008; Zhao et al., 2008). However, conventional methods of BrdU quantification require the immunohistochemical detection and manual counting of BrdU positive cells from fixed tissue. This process is time consuming, labor intensive, intrinsically difficult when cell clustering is present, and therefore does not make neurogenesis an attractive target for the screening of potentially active compounds. Unlike immunohistochemistry, which depending on the sample size, can take weeks to months to analyze data, flow cytometry allows for the analysis of data in one to several days. The speedy analysis afforded by this technique makes hippocampal cell proliferation and survival a practical target in the drug discovery arena.
Inherent in the drug discovery process, is the requirement to know the treatment time required for compounds to produce their effects, as well as the time when maximum efficacy is reached. This type of experimental design requires large numbers of animals, which is made manageable with the use of flow cytometry. This study demonstrated that 14 days of fluoxetine administration was required to increase cell proliferation, as 7 days of treatment had no effect. This time-course for the onset of action of fluoxetine is similar to what has been reported in the mouse (Santarelli et al., 2003). Interestingly, 21 days of treatment did not produce a maximal effect, suggesting that longer durations of treatment might produce even larger augmentations of proliferative activity.
One important technical development of the method will be the ability to determine the phenotype of BrdU-positive cells. There are many immunohistochemically-validated antibodies used in conjunction with BrdU to identify cells from various lineages and in different stages of development (von Bohlen und Halback, 2007). These same cellular markers can be applied to flow cytometry. In addition to identifying cell phenotypes, flow cytometry also has the potential to measure other proliferative markers, such as the cell cycle associated protein Ki-67 and the transcription factor Sox-2.
In conclusion, this study has demonstrated the ability of flow cytometry to expeditiously and reliably measure cell proliferation and survival from adult murine brain tissue. Its inherent speed makes it an attractive method by which neurogenesis can be utilized as a platform for novel drug discovery. Moreover, it has the potential to greatly advance the neuroscience community’s understanding of the biological underpinnings of adult neurogenesis.
Acknowledgments
The study was funded by NIH grant MH72832 for a National Center for Drug Discovery Group in Mood Disorders established between the University of Pennsylvania and Wyeth Research. We would like to thank Dr. Julie Blendy, a principal member of the Group, for her generous advice. We are grateful to the University of Pennsylvania flow cytometry core, especially Charles “Hank” Pletcher, for his indispensable technical advice, as well as Gina Colaizzo for excellent technical assistance.
Footnotes
Conflict of Interest Statement Dr. Lucki is a member of the Neuroscience Scientific Advisory Board for Wyeth Research, and has received research support from Astra-Zeneca Pharmaceuticals, Forest Laboratories and Epix Pharmaceuticals during the past 3 years. Drs. Rahman, Bender, Ring, Dwyer, Rosenzweig-Lipson, Hughes, and Schechter are employees of Wyeth Research. There are no other disclosures.
Publisher's Disclaimer: This is a PDF file of an unedited manuscript that has been accepted for publication. As a service to our customers we are providing this early version of the manuscript. The manuscript will undergo copyediting, typesetting, and review of the resulting proof before it is published in its final citable form. Please note that during the production process errors may be discovered which could affect the content, and all legal disclaimers that apply to the journal pertain.
References
- Allman DM, Ferguson SE, Lentz VM, Cancro MP. Peripheral B cell maturation. II. Heat-stable antigen(hi) splenic B cells are an immature developmental intermediate in the production of long-lived marrow-derived B cells. J Immunol. 1993;151:4431–4444. [PubMed] [Google Scholar]
- Balu DT, Lucki I. Adult hippocampal neurogenesis: Regulation, functional implications, and contribution to disease pathology. Neurosci Biobehav Rev. 2008 doi: 10.1016/j.neubiorev.2008.08.007. [DOI] [PMC free article] [PubMed] [Google Scholar]
- Bilsland JG, Haldon C, Goddard J, Oliver K, Murray F, Wheeldon A, Cumberbatch J, McAllister G, Munoz-Sanjuan I. A rapid method for the quantification of mouse hippocampal neurogenesis in vivo by flow cytometry. Validation with conventional and enhanced immunohistochemical methods. J Neurosci Methods. 2006;157:54–63. doi: 10.1016/j.jneumeth.2006.03.026. [DOI] [PubMed] [Google Scholar]
- Dolbeare F. Bromodeoxyuridine: a diagnostic tool in biology and medicine, Part III. Proliferation in normal, injured and diseased tissue, growth factors, differentiation, DNA replication sites and in situ hybridization. Histochem J. 1996;28:531–575. doi: 10.1007/BF02331377. [DOI] [PubMed] [Google Scholar]
- Dranovsky A, Hen R. Hippocampal neurogenesis: regulation by stress and antidepressants. Biol Psychiatry. 2006;59:1136–1143. doi: 10.1016/j.biopsych.2006.03.082. [DOI] [PMC free article] [PubMed] [Google Scholar]
- Ehninger D, Kempermann G. Neurogenesis in the adult hippocampus. Cell Tissue Res. 2008;331:243–250. doi: 10.1007/s00441-007-0478-3. [DOI] [PubMed] [Google Scholar]
- Golmohammadi MG, Blackmore DG, Large B, Azari H, Esfandiary E, Paxinos G, Franklin KB, Reynolds BA, Rietze RL. Comparative analysis of the frequency and distribution of stem and progenitor cells in the adult mouse brain. Stem Cells. 2008;26:979–987. doi: 10.1634/stemcells.2007-0919. [DOI] [PubMed] [Google Scholar]
- Gratzner HG. Monoclonal antibody to 5-bromo- and 5-iododeoxyuridine: A new reagent for detection of DNA replication. Science. 1982;218:474–475. doi: 10.1126/science.7123245. [DOI] [PubMed] [Google Scholar]
- Hirano K, Kimura R, Sugimoto Y, Yamada J, Uchida S, Kato Y, Hashimoto H, Yamada S. Relationship between brain serotonin transporter binding, plasma concentration and behavioural effect of selective serotonin reuptake inhibitors. Br J Pharmacol. 2005;144:695–702. doi: 10.1038/sj.bjp.0706108. [DOI] [PMC free article] [PubMed] [Google Scholar]
- Kim SH, Won SJ, Mao XO, Ledent C, Jin K, Greenberg DA. Role for neuronal nitricoxide synthase in cannabinoid-induced neurogenesis. J Pharmacol Exp Ther. 2006;319:150–154. doi: 10.1124/jpet.106.107698. [DOI] [PubMed] [Google Scholar]
- Kulkarni VA, Jha S, Vaidya VA. Depletion of norepinephrine decreases the proliferation, but does not influence the survival and differentiation, of granule cell progenitors in the adult rat hippocampus. Eur J Neurosci. 2002;16:2008–2012. doi: 10.1046/j.1460-9568.2002.02268.x. [DOI] [PubMed] [Google Scholar]
- Lagace DC, Fischer SJ, Eisch AJ. Gender and endogenous levels of estradiol do not influence adult hippocampal neurogenesis in mice. Hippocampus. 2007;17:175–180. doi: 10.1002/hipo.20265. [DOI] [PubMed] [Google Scholar]
- Malberg JE, Eisch AJ, Nestler EJ, Duman RS. Chronic antidepressant treatment increases neurogenesis in adult rat hippocampus. J Neurosci. 2000;20:9104–9110. doi: 10.1523/JNEUROSCI.20-24-09104.2000. [DOI] [PMC free article] [PubMed] [Google Scholar]
- Parent JM. Adult neurogenesis in the intact and epileptic dentate gyrus. Prog Brain Res. 2007;163:529–540. doi: 10.1016/S0079-6123(07)63028-3. [DOI] [PubMed] [Google Scholar]
- Reif A, Fritzen S, Finger M, Strobel A, Lauer M, Schmitt A, Lesch KP. Neural stem cell proliferation is decreased in schizophrenia, but not in depression. Mol Psychiatry. 2006;11:514–522. doi: 10.1038/sj.mp.4001791. [DOI] [PubMed] [Google Scholar]
- Sato K, Hamanoue M, Takamatsu K. Inhibitors of p38 mitogen-activated protein kinase enhance proliferation of mouse neural stem cells. J Neurosci Res. 2008 doi: 10.1002/jnr.21668. [DOI] [PubMed] [Google Scholar]
- Shankaran M, King C, Lee J, Busch R, Wolff M, Hellerstein MK. Discovery of novel hippocampal neurogenic agents by using an in vivo stable isotope labeling technique. J Pharmacol Exp Ther. 2006;319:1172–1181. doi: 10.1124/jpet.106.110510. [DOI] [PubMed] [Google Scholar]
- Thompson A, Boekhoorn K, Van Dam AM, Lucassen PJ. Changes in adult neurogenesis in neurodegenerative diseases: cause or consequence? Genes Brain Behav. 2008;7(Suppl 1):28–42. doi: 10.1111/j.1601-183X.2007.00379.x. [DOI] [PubMed] [Google Scholar]
- Zhao C, Deng W, Gage FH. Mechanisms and functional implications of adult neurogenesis. Cell. 2008;132:645–660. doi: 10.1016/j.cell.2008.01.033. [DOI] [PubMed] [Google Scholar]