Abstract
The heme-containing Cytochrome P450s (CYPs) are a major enzymatic determinant of drug clearance and drug-drug interactions. The CYP3A4 isoform is inhibited by antifungal imidazoles or triazoles, which form low spin heme iron complexes via formation of a nitrogen-ferric iron coordinate bond. However, CYP3A4 also slowly oxidizes the antifungal itraconazole (ITZ) at a site that is ∼ 25 Å from the triazole nitrogens, suggesting that large antifungal azoles can adopt multiple orientations within the CYP3A4 active site. Here, we report a surface plasmon resonance (SPR) analysis with kinetic resolution of two binding modes of ITZ, and the related drug ketoconazole (KTZ). SPR reveals a very slow off-rate for one binding orientation. Multiphasic binding kinetics are observed and one of the two binding components resolved by curve-fitting exhibits ‘equilibrium overshoot’. Pre-loading of CYP3A4 with the heme ligand imidazole abolishes this component of the antifungal azole binding trajectories, and it eliminates the conspicuously slow off-rate. The fractional populations of CYP3A4 complexes corresponding to different drug orientations can be manipulated by altering the duration of the pulse of drug exposure. UV-vis difference absorbance titrations yield low spin spectra and KD values that are consistent with the high affinity complex resolved by SPR. These results demonstrate that ITZ and KTZ bind in multiple orientations, including a catalytically productive mode and a slowly-dissociating inhibitory mode. Most importantly, they provide the first example of an SPR-based method for the kinetic characterization of drug binding to any human CYP, including mechanistic insight not available from other methods.
Keywords: protein-ligand interactions, tight binding inhibitors, drug metabolism, drug interactions
The hepatic and intestinal heme-containing Cytochrome P450s (CYPs)1 oxidize most drugs, and thus play a critical role in their metabolism and disposition [1 - 3]. Among the various human CYP isoforms, CYP3A4 contributes most to drug metabolism. CYP3A4 exhibits complex allosteric kinetics, which may result from drug-drug interactions on a single CYP molecule through multiple drug binding, as suggested by steady state kinetic behavior [4 - 6], large active sites observed in crystal structures [7 - 10] and spectroscopic studies [11]. Complex kinetics may arise also from a slowly equilibrating population of singly-ligated CYP molecules with different kinetic properties, e.g. [E·S] ⇔ [S·E]. However, equilibrium binding parameters for individual CYP-drug complexes within a heterogeneous ensemble have been difficult to obtain by ‘traditional’ methods, which include steady state catalytic experiments combined with kinetic modeling [12-15], and equilibrium optical titrations that rely on the inhibitor- or substrate-dependent changes in ferric spin state equilibrium [16-18]. The complexity of CYP kinetics severely impedes prediction of drug clearance and drug-drug interactions [12-15, 19]. Clearly, new methods are required to elucidate the molecular basis of CYP allosterism and complex inhibitor or substrate binding.
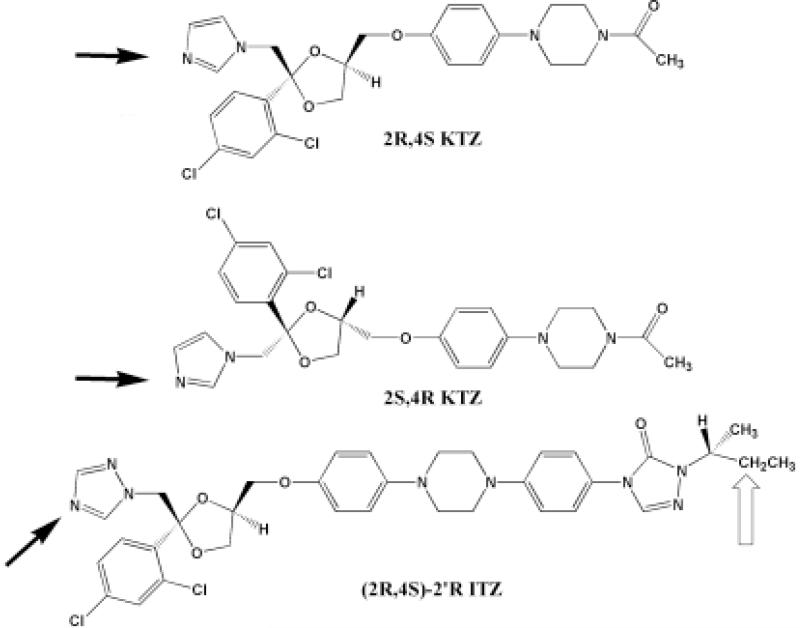
The antifungal azoles, including ketoconazole (KTZ) and itraconazole (ITZ), historically have been considered to be potent inhibitors of CYP3A4, wherein an azole moiety within the drug forms a heme iron-nitrogen coordinate bond. Inhibition of CYP3A4 by this class of drugs results in clinically relevant drug-drug interactions [20-23]. Antifungal binding to CYP3A4 is easily detected by optical spectroscopy as a shift from the substrate-free water-bound low spin heme spectrum toward the low spin, six-coordinate, nitrogen-iron complex [24, vide infra]. This interaction is directly observed in crystal structures of some antifungal azoles bound to CYP51 from M. tuberculosis [25]. However, with smaller azoles, such as phenyl-imidazole and fluconazole, Raman and EPR spectra suggest the possibility of heterogeneous binding to CYP51 [26]. The CYP3A4 active site is much more spacious, so even the larger antifungal drugs could conceivably adopt multiple orientations. Interestingly, it recently has become apparent that ITZ, and possibly KTZ, are not only inhibitors of CYP3A4, but are also slowly oxidized; that is, ITZ is metabolized, and KTZ may be metabolized, by CYP3A4 [27,28]. An enigmatic aspect of the metabolism of ITZ is that the site of oxidation is at the opposite end of the molecule, ∼ 20 Å, from the triazole group that coordinates to the heme iron (Figure 1). Apparently, ITZ, and possibly KTZ, can adopt multiple orientations within the large CYP3A4 active site, including an inhibitory mode and a ‘productive’ mode. Furthermore, the differential equilibrium and kinetic binding parameters for these putative orientations may control the rates of metabolism.
Figure 1.
Chemical structures of the antifungal azoles studied in this work. The azole or triazole ring that is responsible for the ‘low spin’ inhibitory complexes is indicated (black arrows). Also indicated is the site of metabolism for cis(2R,4S,2′R)-ITZ (open arrow).
Here we utilize surface plasmon resonance (SPR)2 to monitor antifungal azole interactions with CYP3A4. The SPR experimental design allowed for direct observation of a kinetically preferred mixture of ITZ or KTZ orientations, which subsequently relax to the true equilibrium distributions. The results demonstrate that each of these drugs adopts multiple orientations within the active site of CYP3A4, and that the slow dissociation of the inhibitory orientation can limit the rate of metabolism. Perhaps most importantly, these results demonstrate the utility of SPR to elucidate complex drug-protein interactions that have become the hallmark of CYPs.
Materials and Methods
Chemicals
The cis (2R, 4S, 2′R)-ITZ enantiomer was obtained from Sepracor (product #0314). Racemic KTZ was obtained from Ultrafine Chemicals (product #UC-280). The cis (2R, 4S)-KTZ and cis(2S, 4R)-KTZ enantiomers were resolved by chiral HPLC according to a previously published method [29]. SPR was performed with a Biacore 2000 optical biosensor equipped with either research-grade CM5 or NTA sensor chips (Biacore AB, Uppsala, Sweden). Amine-coupling reagents (EDC, NHS; and sodium ethanolamine HCl, pH 8.5) were obtained from Biacore AB. Supersomes containing cDNA-expressed CYP3A4 coexpressed with P450-reductase and cytochrome b5 were purchased from BD Gentest (Woburn, MA). Testosterone was purchased from Steraloids and all other supplies were obtained from SigmaAldrich (St. Louis).
Protein Expression and Purification
CYP3A4 NF14 construct was purified and expressed from Escherichia coli as described in [16, 30]. The purity was >95% by SDS-PAGE analysis. The CYP3A4 concentration (CO and Fe2+ - Fe2+) was determined by using the ε450 of 91 mM-1 cm-1 [31]. The P450 concentration was determined to be >99% with respect to the P420-associated absorbance peak, with less than 18% apo-enzyme, as determined by the pyridine hemochromogen assay [ref. 1, p. 465 and references therein], in the various CYP3A4 preparations used. CYP3A4 was stored in 100 mM phosphate (pH 7.4) with 20% glycerol at -80°C.
Surface Plasmon Resonance
Sensor surfaces were pretreated according to published methods and then normalized by standard Biacore protocols [32-34]. Drug binding to CYP3A4 was monitored in glycerol free running buffer (3% methanol, 100 mM potassium phosphate, pH of 7.4) and, in separate experiments, running buffer containing 10% glycerol (1% methanol, 10% glycerol, 100 mM potassium phosphate, pH 7.4). For CYP3A4 coupling to CM5 sensor surfaces, the surfaces were activated with a 5 minute pulse of EDC/NHS (5 μl/min in HBS-EP buffer), followed by injection of the protein and then deactivated by a 5 minute pulse of ethanolamine HCl pH 8.5 (5 μl/min). Protein injections were done for variable times to produce surfaces of variable protein densities, yielding responses that ranged from 3 to 10 kRU. For CYP3A4 binding interactions studied in glycerol free buffer, immobilization was conducted in HBS-EP buffer with CYP3A4 at a concentration of 400nM in 10 mM sodium acetate (pH 5.5). For binding interactions studied in 10% glycerol buffer, immobilization was conducted in 10% glycerol, 100 mM potassium phosphate (pH 7.4) with CYP3A4 at a concentration of 400nM in 10 mM sodium acetate (pH 5.5).
CYP reductase was utilized as a reference surface for experiments conducted in glycerol free buffer due to its similar response to higher concentrations of methanol. CYP reductase was immobilized under glycerol free conditions following the same procedure as described above for CYP3A4. Blank control surfaces (activated with EDC/NHS followed by deactivation with ethanolamine), were utilized for binding interactions conducted in the glycerol containing buffer and were conducted in 1% methanol, 10% glycerol, 100 mM potassium phosphate (pH 7.4) running buffer.
Drug analytes were dissolved in high-grade methanol and then diluted into either 100 mM potassium phosphate to yield solutions with a final methanol concentration of 3% or diluted into 10% glycerol, 100 mM potassium phosphate to yield solutions with a final methanol concentration of 1%. For imidazole and triazole experiments, the compound was added directly to running buffer and then the buffer pH was brought back to 7.4 with either phosphoric acid or potassium hydroxide, respectively. Other organic co-solvents were screened, including DMSO, ethanol, and acetonitrile, but methanol provided the best analyte solubility and chip compatibility. Concentrations of analyte samples were verified by HPLC before and after SPR. All experiments were conducted in 1% methanol, 10% glycerol, 100 mM potassium phosphate (pH 7.4), at flow rate of 100 μl/min, and at 10 °C unless stated otherwise. SPR data were double referenced [31-33] and analyzed with Biaevaluation software 4.1 (Biacore AB). Sensorgrams were corrected for organic co-solvent effects [35], but as witnessed by others the use of methanol as the organic co-solvent and the use of suitable control surfaces made correction factors negligible [36].
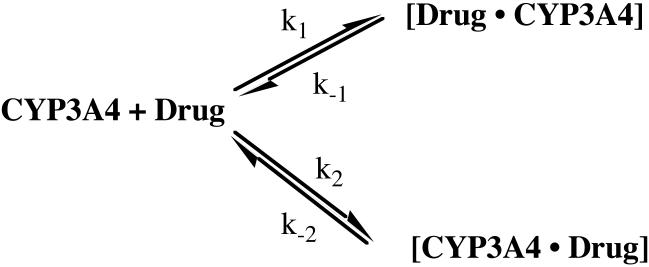
Data were fit both globally, with each parameter constrained to be constant at every concentration of drug, and ‘locally’ wherein the parameters varied with drug concentration. In all cases ‘global’ fits were better, based on standard statistical criteria. Equations relevant to Model 4, which is the model on which the discussion is based, are given here, where [P] is the total protein concentration, [L] is the drug concentration, [P·L] and [L·P] are the different complexes with different off-rate constants, k-1 and k-2, and formed with different on-rate constants, k1 and k2 are the binding rate constants, RU is the total SPR response, which is directly proportional to [L·P] + [P·L]: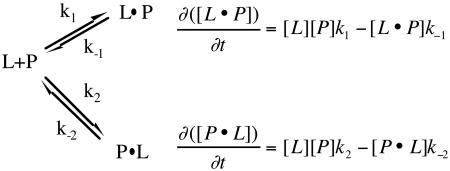
During curve fitting and modeling, it was observed that the ‘analyte heterogeneity’ model contained within the BIAevaluation software consistently fit best to the data, even though experiments were run with chromatographically pure, chirally-resolved, diastereomers of either ITZ or KTZ. This initially surprising result is easily understood upon comparison of the differential equations describing heteroanalyte binding and those describing parallel trajectories for a single analyte. A formal demonstration of the kinetic equivalence of these models is provided in Supporting Information. The kinetic equivalence of the parallel trajectory model (scheme 1) and the heteroanalyte model is only valid when the concentration of drug is time-independent. The analysis, as in nearly all SPR experiments, assumes that the concentration of free drug does not change during the binding phase. This is true in SPR experiments only if mass transfer is not rate limiting, as we have verified experimentally with standard protocols. Also, our model will only be valid if rebinding of drug is negligible during the dissociation phase, yielding apparent irreversible dissociation. This is also a common assumption in SPR experiments and has been verified experimentally in many cases . Based on the kinetic equivalence of the analyte heterogeneity model and the parallel trajectory model, the equations in the BIAevaluation software used for fitting are:
d[B]/dt = (k1[A1]*mw1*[B] - k-1*[A1B])/mw1*n1-(k2*A2*mw2*B - k-2*[A2B])/mw2*n2where [A1] = [A2] = Concentration of total drug, [B]0 is a baseline offset at time = 0 in RU’s, Rmax is the maximal response in RU, k1 and k-1 are the on and off-rate constants for one binding mode, and k2 and k-2 are the on and off-rate constant for the other binding mode , n1 and n2 are the stoichiometry for each binding orientation, mw1 = mw2 = the molecular weight of the analyte, [A1B]0 = [A2B]0 = the concentration of each complex at time zero, [A1B] and A2B] are their concentrations at time t, and [B]0 = Rmax/mw1, and:
[A1B]0 = 0
d[A1B]/dt = (k1*[A1]*mw1*[B] - k-1*[A1B])
d[A2B]/dt = (k2*[A2]*mw2*[B] - k-2*[A2B])
Total response: [A1B] + [A2B] + RI
Scheme 1.
Parallel Binding Trajectories.
UV-vis spectroscopy
Difference optical titrations were performed with 2 μM CYP3A4 in 100 mM potassium phosphate at a pH of 7.4, 20% glycerol at 37 °C, with an Aminco DW2 dual beam spectrophotometer as upgraded by Olis Instruments, Inc. [16-18]. The difference in absorbance maxima and minima for cis(2R,4s,2′R)-ITZ was calculated by subtraction of the average absorbance from 390 to 393 nm from that of the average absorbance from 424 to 426 nm. For cis(2R,4S)-KTZ, the maxima was determined by averaging the absorbance from 429 to 431nm, whereas, the minima was the average absorbance from 393 to 395 nm. The data were fit to the equation:
where [CYP] and [Drug] are the total concentrations in solution, [CYP*Drug] is the concentration of complex at each [Drug] and KD is the dissociation constant. The determination of the percentage of high spin CYP3A4 vs. that of low spin CYP3A4 in the presence of 30 μM cis(2R,4S,2′R)-ITZ or 30 μM cis(2R,4S)-KTZ was conducted as described in reference [16], at a temperature of 10 °C in 10% glycerol with 1 μM enzyme.
Catalytic studies
Production of 3′-hydroxy-ITZ from (2R, 4S, 2′R)-ITZ was measured as described previously for the commercially available mixture of substrate isomers [27]. Briefly, formation of OH-ITZ from ITZ was tested using heterologously expressed CYP3A4 Supersomes. Each incubation was performed in 1.8 ml of 100 mM potassium phosphate buffer (pH 7.4) and 1 mM NADPH with CYP3A4 at a concentration of 20 nM. The metabolic reactions were initiated with the addition of 1 μM cis(2R,4S)2′R-ITZ and 200 μl samples were removed and quenched by the addition of 200 μl of cold acetonitrile. The amount of product formed was quantitated by LC-MS.
Kinetic simulations
Simulations were done with Kinecyte (Raintown Biotech, Inc. Seattle, WA), using the kinetic parameters included in Table 2 for cis (2R,4S,2′R)-ITZ.
Table 2. Kinetic Parameters for ITZ and KTZ Binding to CYP3A4 in 3% Methanol, 100 mM Potassium Phosphate (pH 7.4).
| Drug | k1 (M-1sec-1) | k-1 (sec-1) | KD1 Inhibitory mode (μM) | k2 (M-1sec-1) | k-2 (sec-1) | KD2 Productive mode (μM) |
|---|---|---|---|---|---|---|
| (2R,4S,2′R)-ITZ | 1.4 ± 2.1 × 10⁴ | 2.0 ± 1.1 × 10⁻³ | 0.14 | 2.2 ± 0.3 × 10⁴ | 3.1± 0.3 × 10⁻² | 1.4 |
| (2R, 4S)-KTZ | 4.0 ± 1.4 × 10⁴ | 6.1 ± 1.7 × 10⁻³ | 0.15 | 6.0 ± 1.8 × 10⁴ | 8.0 ± 0.9 × 10⁻² | 1.3 |
| (2S,4R)-KTZ | 2.0 ± 0.5 × 10⁴ | 7.1 ± 3.8 × 10⁻³ | 0.36 | 8.1 ± 0.8 × 10⁴ | 6.1 ± 2.7 × 10⁻² | 0.75 |
| (2R,4S,2R’)-ITZ + 10 mM imidazole | 3.3 ± 0.8 × 10³ | 3.1 ± 1.0 × 10⁻³ | 0.94 | 8.4 ± 1.2 × 10³ | 7.7 ± 1.3 × 10⁻² | 9.1 |
| (2R,4S)-KTZ + 10 mM imidazole | 1.4 ± 1.5 × 10³ | 8.0 ± 2.2 × 10⁻³ | 5.7 | 1.0 ± 1.4 × 10⁴ | 1.8 ± 0.04 × 10⁻¹ | 20 |
For all drugs, the data were fit to the parallel binding trajectory model as described in Methods, and the resulting χ2 values were < 1.2. All experiments were run in triplicate.
Results
CYP3A4 immobilization
Because no SPR studies with human CYPs has been published, a characterization the CYP3A4-chips was warranted. Purified N-terminal truncated CYP3A4 was immobilized on CM5 chips via standard amine coupling reactions [32-33] in either of two buffering systems, one containing 10% glycerol, 1% MeOH and the other glycerol free, 3% MeOH, in separate experiments. The need for the co-solvents resides in the poor aqueous solubility of the drugs used here, and the comparison of the two systems was done in order to search for potential solvent-induced artifacts. The loading of CYP3A4 on CM5 chips is demonstrated in Supporting Information (Figures S1A and S1B). It is noteworthy that binding experiments were performed separately in each of the buffer systems described above, with essentially identical results. Direct comparison of the results demonstrates that MeOH does not contribute significantly to the response nor does it result in significant differences in recovered parameters.
The coupling reaction requires up to 30 minutes at pH 5.5. Therefore, it was necessary to ensure that these conditions were not denaturing for CYP3A4. To accomplish this, CYP3A4 in solution was diluted in buffer at pH 5.5 and maintained at 10 °C for 30 minutes. The sample was then exchanged back into buffer at pH 7.4 and a ‘standard’ CO-difference spectrum was obtained. The sample contained no significant P420, and yielded a spectrum consistent with intact P450 (data not shown). Moreover, after preparation of CYP3A4-CM5 chips, injections of 10 mM Acetate buffer pH 5.5, followed by re-equilibration at pH 7.4 did not reduce the binding capacity or change the kinetics of interactions. At 10°C, CYP3A4 surfaces were stable in both buffering systems for approximately 13 hours, as indicated by repetitive cycles of binding and dissociation in which less than 10% of the initial binding capacity was lost (Supporting Information, S1C). Furthermore, three consecutive 20 second injections (flow-rate 60 μl/min) of 0.05% SDS, followed by washing with detergent free buffer, completely eliminated binding responses. In short, CYP3A4 surfaces were found to be sufficiently robust to perform multiple experiments without degradation.
Drug screening: Slow off rates for azole inhibitors
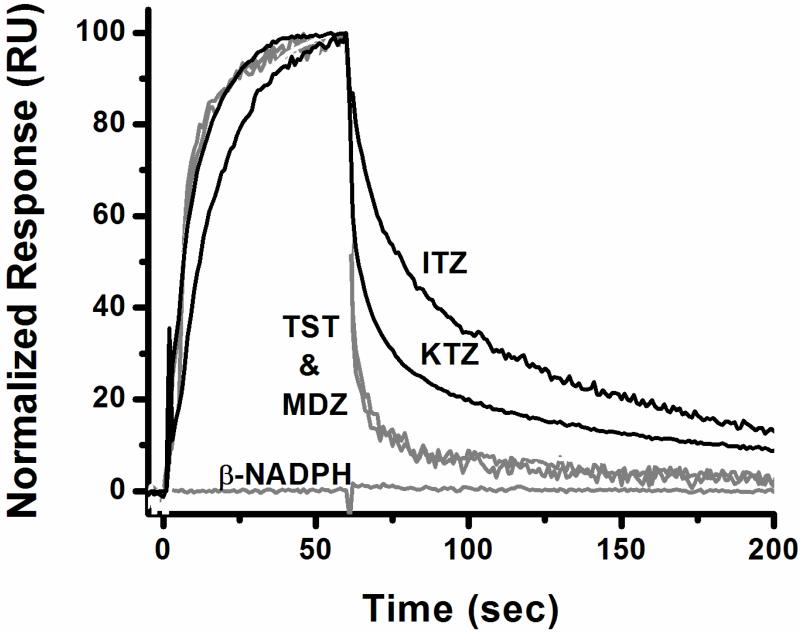
Before an in depth kinetic analysis of drug/CYP3A4 interactions could be conducted, we first ensured that response data reflected specific binding of analyte to CYP3A4. Therefore, we studied two well known CYP3A4 substrates, testosterone (TST) and midazolam (MDZ), two well known inhibitors of CYP3A4, itraconazole (ITZ) and ketoconazole (KTZ), and three control compounds (NADPH, glutathione, and ATP) in a qualitative screening format. Each compound was either dissolved in methanol and then diluted into glycerol containing running buffer for a final methanol concentration of 1% (substrates/inhibitors) or dissolved directly into running buffer containing 1% methanol (control compounds). The three control compounds showed no binding to the CYP3A4 surface over what was observed across the blank control surface (Figure 2, glutathione and ATP not shown). Both substrates and both inhibitors of CYP3A4 showed specific binding, with the azole containing inhibitors ITZ and KTZ exhibiting a complex and very slow off-rate compared to that of the substrates TST and MDZ (Figure 2). For the current study, we speculated that the slow off-rate observed with the two low- spin inhibitors of CYP3A4 corresponds to the slow scission of the nitrogen-iron bond or the subsequent reentry of water to the immediate coordination sphere of the heme iron. Two additional azole containing inhibitors of CYP3A4, fluconazole and miconazole, were also screened, and showed the same slow dissociation rate (data not shown) as observed for ITZ and KTZ, but with drastically different association kinetics. In summary, a slow off rate is a characteristic feature of each of the known low spin inhibitors we studied.
Figure 2.
Sensorgrams of compounds screened for binding to CYP3A4 at various concentrations ranging from 10 to 40 μM for the three classes of ligands; CYP3A4 type-I ligands midazolam and testosterone (gray), CYP3A4 type-II ligands cis (2R,4S,2′R) itraconazole and cis (2R,4S) ketoconazole, and control compound β-NADPH (gray). Responses were normalized by taking the response at two seconds before the end of the association as 100 percent (except for β-NADPH, which showed no binding.
Kinetic analysis of the binding interactions of ITZ and KTZ with CYP3A4
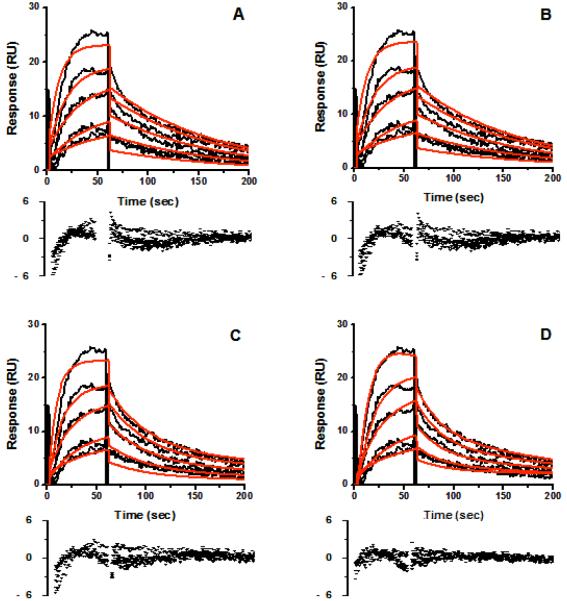
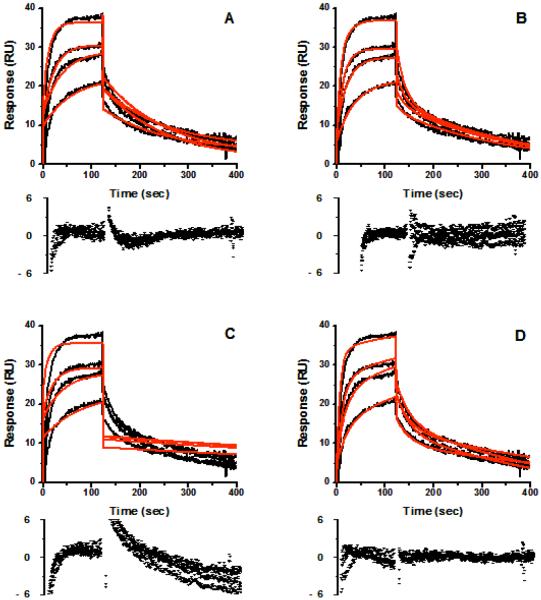
SPR sensorgrams for the single stereoisomer cis(2R,4S)2′R-ITZ and the single diastereomer cis(2R,4S)-KTZ are shown in Figures 3 and 4, respectively, at multiple concentrations of each drug. Several binding models were rigorously compared including: Model 1) Simple 1:1 binding, where drug/CYP3A4 interactions can be described by a single association rate and single dissociation rate (Fig. 3A, 4A). The known complexity of ITZ or KTZ/CYP3A4 interactions makes this model unlikely. Model 2) ‘Ligand heterogeneity,’ in which different protein populations on the chip surface have different kinetic properties (Fig. 3B, 4B). This could occur if different protein conformations were not in equilibrium on the surface (apo- versus holoenzyme), or if each CYP molecule had two independent binding sites with different kinetic properties. We refer to this model as the protein heterogeneity model. Model 3) Drug-induced protein ‘conformational change’, wherein the conformational change occurred on the same time scale as drug binding (Fig. 3C, 4C). This model could describe a system where drug binds to CYP3A4 in a simple 1:1 manner and can reorient in the active site to either the high-spin productive complex or coordinate to the heme iron for the low-spin inhibitory complex. Reorientation of the bound drug would cause some SPR observable conformational change in the protein/drug complex. Model 4) ‘Parallel binding trajectories,’ where a single drug binds with different rates and trajectories to a single site (Fig. 3D 4D). If bound drug is incapable of reorienting in the CYP3A4 active site, then the drug must dissociate and rebind to access the heme in the two orientations. Model 5) Sequential multiple drug binding where multiple drugs bind independently at nonidentical sites (not shown).
Figure 3.
Representative sensorgrams (black) obtained from injections of cis(2R,4S,2′R)-itraconazole at concentrations of 0.38, 0.75, 1.5, 3.0, 6.0 μM over an amine captured CYP3A4 surface in 1% methanol, 10% glycerol, 100 mM potassium phosphate buffer, pH 7.4. Red lines depict the global fits of the data to (A) a simple 1:1 bimolecular interaction model, (B) the parallel binding trajectory model, (C) the drug induced conformational change model, and the (D) the analyte heterogeneity or parallel binding trajectory model.
Figure 4.
Representative sensorgrams (black) obtained from injections of cis (2R,4S) ketoconazole at concentrations of 1, 2, 4, and 8 μM over an amine captured CYP3A4 surface in 1% methanol, 10% glycerol, 100 mM potassium phosphate buffer, pH 7.4. Red lines depict the global fits of the data to (A) a simple 1:1 bimolecular interaction model, (B) the ligand heterogeneity model, (C) the drug induced conformational change model, and (D) the parallel trajectory model.
For both ITZ and KTZ, the data fit best to Model 4, Parallel trajectories, based on χ2 and weighted residuals (Figure 3D and 4D). Both Model 1, simple 1:1 binding model, and Model 3, ‘drug-induced conformational change, fit the data poorly for ITZ (Figure 3A and 3C). The protein heterogeneity model (Figure 3B), showed systematic deviations in the dissociation phase and when fit locally, this model did not fit the data at all for either ITZ or KTZ at any drug concentrations measured. The drug-induced protein conformational change model (Model 3), was unable to fit the data for either ITZ (Figure 3C) or KTZ (Figure 4C). For KTZ, the Protein Heterogeneity model (Model 2, Fig. 4B) fit nearly as well as the parallel trajectory model (Model 4), although the latter model is a better description of the dissociation behavior based on χ2 and additional information from experiments described below. The simple 1:1 binding model, the drug-induced conformational change and sequential multiple binding site models appear to poorly describe the data. In short, the SPR data significantly narrow the possible schemes to consider.
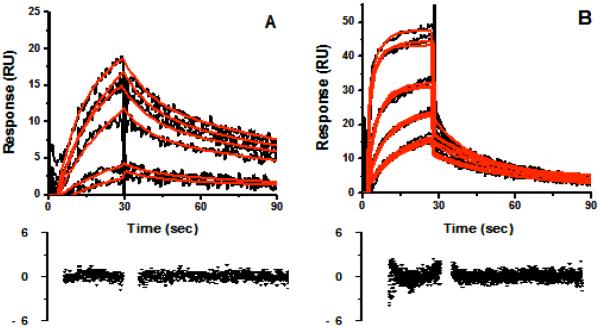
The recovered parameters for Model 4, as in Scheme 1, are summarized in Table 1. To ensure that we were measuring bimolecular interactions (drug binding to CYP3A4), we removed the glycerol from the running buffer. The sensorgram data still fit to Model 4, and as expected for a diffusive bimolecular reaction, the on rates increased rates with the off rates were practically unaffected (Figure 5 and Table 2).
Table 1. Kinetic Parameters for ITZ and KTZ Binding to CYP3A4 in 1% Methanol, 10% glycerol, 100 mM Potassium Phosphate (pH 7.4).
| Drug | k1 (M-1sec-1) | k-1 (sec-1) | KD1 Inhibitory mode (μM) | k2 (M-1sec-1) | k-2 (sec-1) | KD2 Productive mode (μM) |
|---|---|---|---|---|---|---|
| (2R,4S,2′R)-ITZ | 5.2 ± 3.9 × 10³ | 2.3 ± 0.5 × 10⁻³ | 0.44 | 9.0 ± 2.9 × 10³ | 4.0 ± 0.6 × 10⁻² | 4.4 |
| (2R, 4S)-KTZ | 5.0 ± 3.1 × 10³ | 1.8 ± .4 × 10-3 | 0.36 | 1.2 ± .8 × 104 | 2.9 ± 0.8 × 10⁻² | 2.4 |
For all drugs, the data were fit to the parallel binding trajectory model as described in Methods, and the resulting χ2 values were < 1.0. All experiments were run in triplicate.
Figure 5.
Representative sensorgrams (black) for cis (2R,4S,2′R)-itraconazole (A) and cis(2R,4S)-ketoconazole (B) binding to CYP3A4 in 3% methanol, 100mM KPi, 7.4. Itraconazole concentrations ranged from 0.31 to 9.8 μM and ketoconazole ranged from 2.4 to 19.2 μM. Red lines depict the global fits of the data to the parallel binding trajectory model. CYP reductase was utilized as a reference for binding interaction studies in this buffering system. The change in solvent composition has negligible effect on the results, although the on-rates are slower in buffer containing 10% glycerol, than with no glycerol.
On the basis of: 1) two apparent on-rates for each stereochemically pure azole; 2) an exceedingly slow off-rate for one of the analyte binding components observed for each azole, but not the ‘high spin’ drugs testosterone and ANF; and 3) the reported slow oxidation of ITZ at the opposite end of the molecule [27] we considered a model wherein the slow dissociation of drug was from a binding orientation that allowed an inhibitory heme iron-nitrogen bond, whereas the faster component resulted from the dissociation of the ligand bound in a productive orientation with the triazole or imidazole moiety pointed away from the heme iron (scheme 1).
This model predicts that, if the duration of the association phase (pulse) is varied, the relative fraction of the slowly dissociating component will increase with increasing pulse duration. This was confirmed experimentally with cis(2R,4S)-KTZ (Supporting Information, Fig. S2) and cis(2R,4S,2′R)-ITZ (not shown). The association time-dependent dissociation behavior is consistent with Models 2-4, and thus does not uniquely distinguish between them. However, Model 3, the drug-induced protein conformational change, fit the sensorgrams very poorly as shown above, so that model was not considered further. Model 2, for protein heterogeneity, fit the data reasonably well for KTZ (Figure 4B). The recovered kinetic parameters from that fit, predict that the two binding sites should be saturated at the concentration of KTZ used (17 μM). Therefore, because the two binding sites in the ‘protein heterogeneity’ model are independent of each other, and the concentration of drug is saturating for both binding sites, variation of the association time should not alter the dissociation profile. The dissociation profile is altered (Figure S2), however, giving further support to the parallel trajectory model as a better model to describe ITZ and KTZ/CYP3A4 interactions.
The linkage test (Fig. S2) further highlights the point that equilibrium is achieved very slowly in this system, even though the individual binding pathways allow the enzyme to be saturated with drug within ∼1.0 minute. Due to the fact that the two binding orientations are competitive, the distribution of orientations on the enzyme does not reach equilibrium for 3-4 minutes. Although this scenario may be sufficient to result in slower apparent dissociation after 1 minute binding compared to after 3, it is difficult to know whether the very modest difference between 3 minutes and 20 minutes is experimental error or indicative of an additional slow process; there may be additional slow processes that contribute to small changes in off rate at very long times.
The true mechanism of binding of these azoles may include components of several of the models tested. For example there could be parallel binding trajectories and zero-order conformational changes for either or both binding orientations. However, the goal in this type of modeling is to define the simplest model that reasonably fits the data without becoming over-parameterized. The SPR results indicate that that the simplest model requires two pseudo first-order binding constants (k1, k2) and two zero-order dissociation constants (k-1, k-2). Replacement of the second on-rate constant with a zero-order rate constant yields a poor fit. The parallel binding trajectory model is the simplest model with these criteria
Effect of imidazole preloading
As a further test of this model, we eliminated the coordination site on the heme iron by pre-loading the enzyme with imidazole, which is known to coordinate to the ferric heme in CYPs or other heme proteins [37]. Because of the low mass of imidazole (< 70 Da), it is expected to be nearly silent in the sensorgrams, and we experimentally validated this. Up to 1 mM imidazole, the expected slight positive response is observed (between 3 to 6 RU, not shown). At higher concentrations a modest negative response is observed. These effects are not due to imidazole-induced pH changes, as analyte samples were corrected for pH after the addition of imidazole. Furthermore, 1,2,4-triazole showed the same trends in response, a slight positive response until a low mM concentration was reached and then a modest negative binding response above 1 mM, but the pKas of imidazole and triazole are very different. The pKa’s of imidazole and 1,2,4-triazole are 6.95 and 2.45, respectively [38 and references therein]. Thus, the slight SPR response of these ligands is not related to pH. Possibly, coordination to the heme iron seems to not be a completely SPR silent phenomenon, as we initially expected, but a more detailed SPR analysis would be required to determine the cause of these small effects. Interestingly, conformational changes due to the reduction of cytochrome C have been reported to be SPR observable which could be a consequence of the change in spin-state of the heme iron [39], and our result may reflect a similar response.
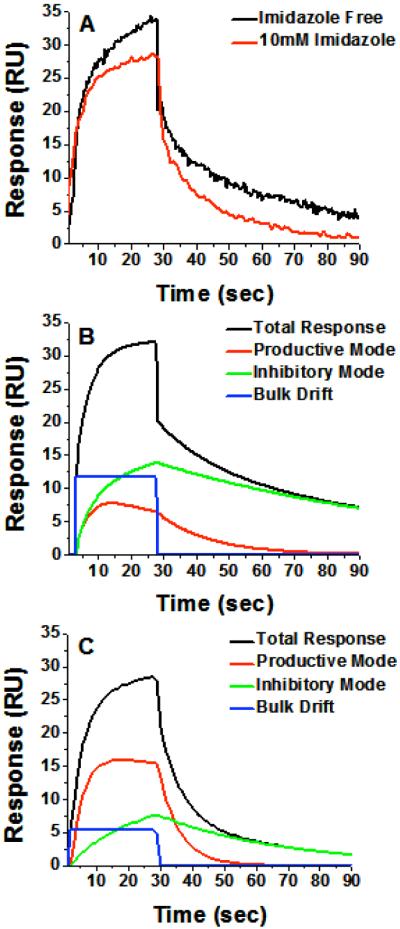
Pre-loading the enzyme with imidazole, followed by a stable baseline, and subsequent binding and dissociation of ITZ or KTZ resulted in sensorgrams that still fit best to Model 4, except the slowly dissociating component was nearly abolished (Figure 6). Recovered kinetic constants are included in Table 2. Both on-rates (k1, k2) recovered from curve fitting decreased by ∼5-8 fold, which is expected due to competition with the imidazole, or due to sterically restricted binding in its presence. The k-2, which is the faster off-rate of the putative productive mode, is moderately faster in the presence of imidazole. This may simply reflect simultaneous binding of the imidazole and drug in the productive mode, and a more crowded active site, consistent with the higher KD2. Most importantly, the value of the slow off-rate, k-1, does not change much in the presence of imidazole for either KTZ stereoisomer or ITZ (Table 2), consistent with nitrogen coordination to the heme iron by analyte in a small fraction of complexes. However, the relative fraction of inhibitory drug complex that forms is reduced upon pre-loading the enzyme with imidazole (Figure 6C and Table 2), so the apparent dissociation of the ensemble is faster. In the presence of the competing iron coordinating drug, a smaller fraction of KTZ or ITZ is ligated to the iron. Presumably, the inhibitory mode without the iron-nitrogen bond now dissociates at a rate similar to the productive mode.
Figure 6.
Binding of (2S, 4R, 2′R)-ITZ after preloading the enzyme with 10 mM imidazole. (A) Overlay of 9.6 μM (2R, 4S,2′R) KTZ binding to CYP3A4 in the presence (red) and absence (black) of 10 mM imidazole in 3% MeOH 100mM KPi, 7.4. The imidazole nearly eliminates the slowly dissociating component. (B) Component analysis for 9.6 μM ITZ binding to CYP3A4 in the absence of imidazole and (C) in the presence of 10 mM imidazole. For panels B and C, black is the total response, blue is the bulk refractive index change, red is the fast-dissociating component (productive), and green is the slowly dissociating component (inhibitory). Note that the productive mode (red) exhibits equilibrium overshoot, but this is nearly absent when the enzyme is pre-loaded with imidazole. The imidazole causes a decrease in the fraction of this slowly-dissociating component as evidenced by the inversion of relative contributions of ‘red’ and ‘green’ components.
These results are easily understood upon explicit analysis of the individual components, or binding pathways, that are recovered from the fitting of the data to Model 4. That is, the two pathways described by Model 4, can be individually derived and compared. The individual component behavior is shown also in Figure 6 for ITZ, with both association and dissociation sensorgrams. A clear maximum is observed for the minor fast-dissociating component prior to equilibrium. This is classic ‘equilibrium overshoot’ behavior in which a kinetically preferred mixture is transiently populated prior to achieving equilibrium; this is precisely the predicted result for the case in which a drug binds in either of two orientations in a single site or at two distinct sites with approximately equal on-rates, but the affinity of one orientation/site is much higher due to a significantly slower off-rate. It is particularly noteworthy that the equilibrium overshoot is nearly abolished upon pre-loading with imidazole, concomitant with the decrease in the contribution of the slowly-dissociating component.
UV-vis difference spectra of CYP3A4 with cis(2R,4S,2′R)-ITZ and cis(2R,4S)-KTZ
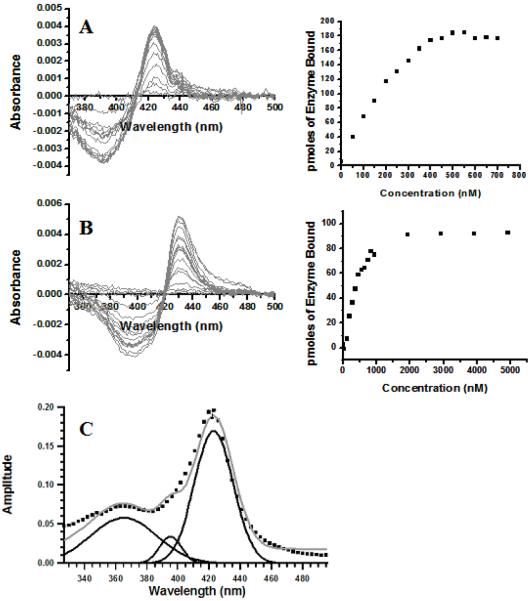
In order to compare the SPR experiments with the ‘traditional’ method for monitoring binding to CYPs, spectral titrations were performed with cis(2R,4S,2′R)-ITZ, cis(2R,4S)-KTZ, and cis(2S,4R)-KTZ (Figure 7A and B, respectively). The data were fit to a quadratic equation as described in Materials and Methods, which accounts for depletion of free drug at low total drug concentrations, when the concentration of CYP3A4 is above that of the KD. Based solely on the difference [Abs at 420nm - Abs at 390nm], the KD values are 19 nM, 210 nM, and 400 nM for cis(2R,4S,2′R)-ITZ, cis(2R,4S)-KTZ, and cis(2S,4R)-KTZ respectively. Figure 7 shows the spectral titrations for cis(2R,4S,2′R)-ITZ and cis(2r,4S)-KTZ along with typical binding curves. Interestingly, both KTZ isomers (cis(2S,4R)-KTZ not shown) yield spectra with red-shifted maxima and minima compared to the spectra obtained with ITZ, which may reflect the difference in heme ligation by imidazole vs. triazole. Regardless, the spectra clearly confirm that the low-spin complexes are formed in each case, and the KD values are in good agreement with the tight binding mode resolved by SPR. Most importantly, the spectral approach does not explicitly detect or quantify the high-spin orientation when the other binding mode dominates.
Figure 7.
UV-vis difference spectra of CYP3A4 with cis (2R,4S,2′R)-ITZ (A) and cis (2R,4S)-KTZ (B). The low-spin complex dominates for both compounds, with nitrogen-iron coordination yielding maxima at ∼ 420nm and minima at ∼ 390 nm (Note: the use of 420 nm as the maxima and 390 nm as the minima is standard terminology when discussing Type-II difference spectroscopy. See Materials and Methods for the exact wavelengths used in the absorbance difference determinations). However, the minor high spin component (9-10 %) agrees with the fraction of productive mode detected by SPR (9-10 %, Tables 1, 2). Typical titration of [Abs ∼420 nm - Abs ∼390 nm] at varying concentrations of drug for cis (2R,4S,2′R)-ITZ and cis(2R,4S)-KTZ are shown. The KD values for each drug, recovered from fitting to the quadratic equation in Materials and Methods, are included in the text. (C) Estimation of relative low spin and high spin concentrations of CYP3A4 by absorbance spectroscopy at 10 °C. The δ-band, low spin, and high spin associated Soret absorbances of 1 μM CYP3A4 were fit with Gaussian curves (black lines) in the presence of 20 μM cis (2R,4S,2′R)-ITZ. The sum of these Gaussian curves is shown (grey) with the raw absolute spectra data (black squares).
In addition, the KD’s for the two complexes determined by SPR predict the percentage of high spin CYP3A4 vs. low spin CYP3A4 when drug is saturating for both binding modes, inhibitory and productive. From Table 1, the inhibitory vs. productive dissociation constants for cis(2R,4S,2′R)-ITZ differ by 10-fold, with KD’s of 0.44 μM and 4.4 μM respectively, corresponding to a high spin fraction of 9%. Estimation of the relative low spin and high spin concentrations of CYP3A4 by a previously published method using absorbance spectroscopy and spectral component analysis (16) yielded 89.5% low spin and 10.5% high spin when saturated with 30 μM cis(2R,4S,2′R)-ITZ (Figure 7C). For KTZ, the absolute spectra yield 9% high spin and 91% low spin. Thus, the spin equilibria predicted by SPR are in excellent agreement with the optical titrations, and within the context of the parallel trajectory model (scheme 1) they indicate that the fast-dissociating component is mainly high spin. Of course, the spectral heterogeneity could be due to other causes and it may just be fortuitous that the two independent methods reveal heterogeneity with species with relative fractions populations of about 91:9.
Simulations of cis(2R,4S,2′R)-ITZ metabolic kinetics
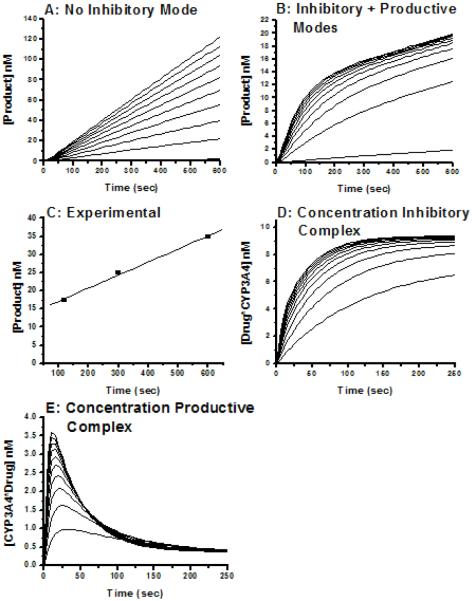
A further prediction of Model 4 is that ‘burst kinetics’ should be observed for product formation from (2R, 4S, 2′R)-ITZ or KTZ, in which an initial fast rate of hydroxylation is followed by the apparent true steady state rate. This prediction is easily demonstrated by further kinetic simulations based on the model in Scheme 2, which is an expansion of Scheme 1, in which a slow rate of (2R, 4S, 2′R)-ITZ hydroxylation is incorporated.
Scheme 2.
Multiple Binding Orientations with one Productive Mode.
In simulations using the experimentally obtained k1, k-1 and k-2, for (2R, 4S, 2′R)-ITZ, and a range of kcat rates that is 10 to 100-fold faster than the k-1, burst kinetics are observed when the rate of product formation is simulated (Figure 8B). In contrast, when only the productive orientation, [CYP3A4· Drug], is allowed (k1 = 0), the rate of product formation is linear as a function of time and the CYP behaves as a simple Michaelis-Menten enzyme (Figure 8A). The slowly-dissociating inhibitory mode is a sufficient condition for ‘burst’ kinetics when superimposed on an enzyme system that exhibits ‘linear’ kinetics. The slowly dissociating inhibitory mode is, however, not a necessary condition for burst kinetics. Interestingly, although the steady state rate of ITZ-OH formation may be complicated by further metabolism of the product ITZ-OH, the available published data do suggest ‘burst’ kinetics for the commercial mixture of ITZ diastereomers [27]. No published studies have examined the kinetic behavior of KTZ as a substrate.
Figure 8.
Burst kinetics for (2S, 4R, 2′R)-ITZ metabolism by CYP3A4 and kinetic simulations comparing steady state rates of drug oxidation with and without an inhibitory binding mode. Kinetic simulations (A, B, D, E) based on Scheme 2 were performed using [ITZ] = 1 μM and the parameters recovered from SPR for binding and dissociation of ITZ, and with kcat = 0.05/sec. The parameters are k1 = 1.4 × 10⁴ M-1sec-1, k-1 = 2 × 10⁻³ sec-1, k2 = 2.2 × 10⁴ M-1sec-1, and k-2 = 3 × 10⁻² sec-1. The concentrations of drug used in the simulations are 0.1, 0.6, 1.1, 1.6, 2.1, 2.6, 3.1, 3.6, 4.1, and 4.6 μM. When the mode with slow dissociation is allowed, the steady state rates are transformed from linear to ‘burst’ kinetics. The experimentally determined rate of product formation (C) reveals burst kinetics and the magnitude of the burst matches well with the simulations that include the slowly dissociating inhibitory mode. Panels D and E reflect the concentrations of inhibitory complex and productive complex, respectively, at varying ITZ concentrations. The productive complex exhibits a rise and fall analogous to the equilibrium overshoot of the productive complex resolved by SPR.
The simulations also clarify the basis for burst kinetics, wherein the concentration of the productive complex [CYP3A4·Drug] rises and falls before reaching the steady state concentration (Figure 8E), on a similar time scale as the rise and fall of the productive complex in the SPR experiments (Figure 6B). Also, the simulations indicate an approach to steady concentration of the inhibitory complex on the same time scale as suggested by the component analysis of the SPR results (Figure 8D).
cis(2R,4S,2′R)-ITZ burst kinetics
In order to examine further the behavior of (2R, 4S, 2′R)-ITZ, and to correlate these simulations with experiment, we conducted steady state catalytic assays in which the rate of ITZ-OH product formation was monitored, at a single concentration of (2R, 4S, 2′R)-ITZ = 100 μM. The results are shown in Figure 8C, and the experimentally determined rates reveal a clear ‘burst’ of product formation, followed by the steady state rate of 0.0016 sec-1, which is in reasonable agreement with the slow off rate measured by SPR, of 0.0023 sec-1. A complete analysis of the burst kinetics requires additional study, but it is reasonable to speculate on the basis of the SPR and the catalytic experiments that the rate of metabolism is partially limited by the slow dissociation of the azoles in the inhibitory orientation.
Discussion
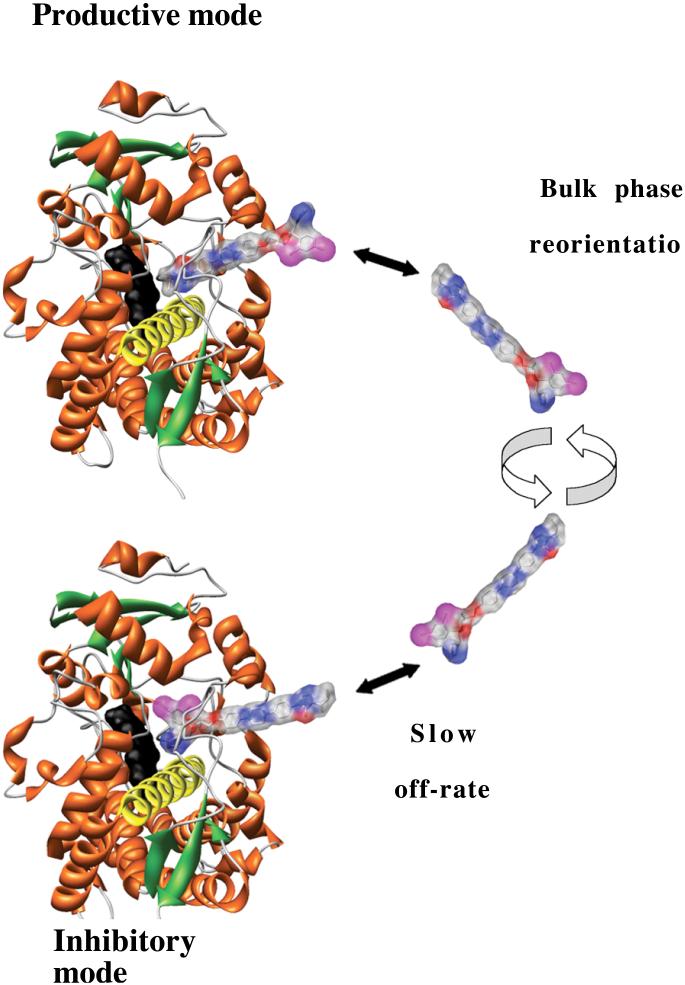
It is now widely accepted that ‘allosteric’ steady state CYP kinetics may result from multiple drugs binding to a single CYP molecule [4-6, 12-15]. In this case, each of the species present during steady state, [CYP·S], [CYP·S·S] etc., contributes to the rate of product formation and, therefore, to complex kinetics. However, an additional possible source of complex kinetics is the presence of distinct CYP species with a single drug bound, which have different properties, [CYP·S] vs. [S·CYP]. It has been suggested that persistent conformations of CYP3A4 exist [40], but complex kinetics arising from heterogeneous drug orientations have not been demonstrated. Note that these mechanisms are not mutually exclusive; both or neither may occur for any specific drug. Precedent for a nitrogenous drug binding in multiple orientations to a single CYP has been provided by crystal structures of P450cam with nicotine bound [41]. In that case, the reduction of the heme and CO binding caused a preference for the ‘productive orientation.’ Similarly, crystal structures suggest that a substituted benzensulfonamide can bind in two antiparallel orientations in CYP2C5 [42]. Our results demonstrate that, for the large antifungal azoles bound to CYP3A4, reorientation of the low spin inhibitory complex is rate limiting, at least for the ferric enzyme. It is widely suggested that many drugs bind with multiple orientations within CYP active sites, due to the multiplicity of products generated from a single substrate [43, 44]. In several cases, drugs appear to rapidly reorient near the heme iron, without dissociating from the active site, on the basis of intramolecular kinetic deuterium isotope effects [45, 46]. The present results reveal drug reorientation on a dramatically different, but functionally relevant, time scale. Based on intermolecular isotope effects, dissociative reorientation may also occur with testosterone binding to CYP2C11 [47]. The SPR, absorbance and catalytic studies, combined with the precedent for CYPs binding inhibitors or drugs in multiple orientations, results in our model for the interactions between ITZ and KTZ with CYP3A4 in Figure 9.
Figure 9.
Proposed scheme for the dynamics of ITZ or KTZ binding to CYP3A4. Highlighted structural features include heme (black), the I-helix (yellow), β-structures (green). The space filling model of ITZ is shown with: carbon atoms, white; chlorine atoms, magenta; nitrogens, blue; oxygens, red. ITZ is docked with a triazole nitrogen in position to coordinate with the heme iron (inhibitory mode, bottom) or with the site of oxidation near the heme iron (productive mode, top). These ‘docked’ orientations are for graphical purposes only and do not imply knowledge of the specific binding orientations. The ITZ is too large to allow reorientation within the active site. ITZ is relatively rigid and cannot bend significantly due to the phenyl-piperazine linkages.
The rate constants k1 and k2 obtained for (2R, 4S, 2′R)-ITZ and either KTZ stereoisomer are at the slow end of the range typically observed for many other protein-small molecule systems, 107 M-1 sec-1 - 104 M-1 sec-1. However, drug binding rates for other CYPs also have been reported in the range of 104- 105 M-1sec-1 [48-49]. For example, binding of imidazole and chlortrimazole to Thromboxane Synthase, a ‘non-classical’ CYP, exhibit rates of 8.4 × 10⁴ and 1.5 ×10⁵ M-1sec-1, based on stopped-flow [49]. Slow binding rates for ITZ and KTZ are not surprising in light of the shape of these molecule that deviate dramatically from ‘spheres,’ which would yield the fastest diffusion-rates. Also, the high axial ratio of ITZ and KTZ would yield many initial diffusive encounters between drug and CYP3A4 with the long axis of the drug perpendicular to the access channel leading to the heme. Thus, a relatively small percentage of diffusive encounters are of the right orientation to yield complexes with measurable stability. This also will decrease observed on-rates. So, although the observed rates are slow compared to many other protein binding events, they are not entirely unexpected. Moreover, we have eliminated the possibility that mass transfer of the analyte to the surface is rate limiting with established protocols and we have obtained similarly slow rates when the CYP3A4 is immobilized with a second surface capture method, using the CYP3A4 his-tag on Ni2+ -NTA chips. Therefore, it is unlikely that the slow rates reflect orientation effects or protein denaturation. Regardless of the absolute on-rates, these data are most consistent with the model depicted in Figure 9, which is further supported by each of the challenges presented. Importantly, the SPR and optical titration data also are consistent with many previous steady state inhibition studies with KTZ and ITZ that yield KI or IC50 values in the range 10 - 500 nM [50-51]. Notably, however, neither the inhibition studies nor the optical titrations by themselves reveal any information about the productive high-spin binding mode.
It is, possibly, necessary to comment of the general suggestion that a single drug can have multiple on-rates. Note that the assumption that k1 ≠ k2 is not a requirement of the parallel pathway model, but rather it is demonstrated by the recovered parameters. If k1 = k2, this would be revealed upon fitting of the data to the model: the recovered values for k1 and k2 would be the same. The essential point is that k1 = k2 is neither a requirement nor a constraint of the model. The possibility that k1 ≠ k2 is supported by a vast literature of theoretical treatments of drugs binding to proteins, wherein electrostatics, orientation, and hydrodynamic effects contribute to on-rates for drugs [52-56]. For example, electrostatic steering is well established as a factor of protein-drug interaction, even for neutral drugs [54, 56]. Electrostatic steering results from long range charge and dipole attractions and repulsion, and can alter the apparent rates of diffusion of drugs to their active sites. Most importantly here, theoretical studies of ‘dumbell-shaped’ or elongated drugs, such as ITZ, demonstrate that electrostatic effects and hydrodynamic effects control the orientation in which molecules initially dock. Further, the orientation of initial binding trajectory affects subsequent binding events such as diffusion of the molecule from the protein surface ‘through’ the protein to its actual binding site [53]. Together these theoretical studies clearly demonstrate that binding of a single drug to a protein is best described as a distribution, or continuum, of binding rates, rather than a simple bimolecular reaction described by a single rate constant [55-56]. Certainly, one source of such rate distributions is protein conformational heterogeneity. However, the modeling we have done includes comparison to the heteroligand model, which would include heterogeneity due to slowly equilibrating protein conformations. This protein heterogeneity model yields a less satisfactory fit of the data. Analytically, it is uncommon to attempt to resolve more than one diffusive on-rate for a single protein-ligand pair, but multiple on-rates are actually demanded by several theoretical models. More complex models, with more than two binding rate constants, would likely be over-parameterized and may not provide unique ‘best’ solutions.
In summary, the model derived from the SPR data is consistent with several observations concerning complex behavior of ITZ and KTZ. To our knowledge, these results are the first example of SPR to monitor drug interactions with CYPs and they demonstrate the potential utility of this approach for understanding other complex CYP-drug interactions. Although SPR, by itself, did allow for several possible binding mechanisms to be discounted, it predicted the parallel binding trajectory as only marginally better than the protein heterogeneity model. However, by exploiting novel experimental designs of SPR, such as preloading with a heme ligand and variation of association phase duration, and combined with other experimental approaches, this technique provides a powerful mechanistic probe of complex binding to CYPs.
Supplementary Material
ACKNOWLEDGMENT
The authors gratefully acknowledge Sepracor, Inc. for providing enantiomerically pure ITZ, and Lee Hendrickson of ICOS, Inc. and Kevin Lindquist of Biacore AB for invaluable assistance with SPR. The authors also acknowledge Professors Ken Thummel and Wendel Nelson for valuable discussions, and Mike Dabrowski for assistance with graphics.
Footnotes
This work was supported by NIH grants GM32165 (WMA, NI, KLK) and GM07750 (JTP).
- α-NF
- α-napthoflavone
- CM5
- carboxymethylated dextran matrix
- CYP
- cytochrome P450
- EDC
- 1-ethyl-3- (3-dimethylaminopropyl)carbodiimide
- ESI-MS
- electrospray ionization mass spectrometry
- FLZ
- fluconazole
- HBS-EP
- standard Biacore buffer containing 10 mM Hepes, pH 7.4, 150 mM NaCl, 3 mM EDTA, 0.005% (v/v) P20 surfactant
- ITZ
- itraconazole
- ITZ-OH
- the hydroxylated product of ITZ
- KTZ
- ketoconazole
- MDZ
- midazolam
- NHS
- N-hydroxysuccinimide
- SPR
- surface plasmon resonance
- TST
- testosterone
The literature concerning SPR usually denotes the molecule immobilized on the sensor chip as the ‘ligand’ and the molecule in the flowing solution as ‘analyte.’ We have adopted this nomenclature for consistency with the SPR literature. We use ‘inhibitor’, ‘substrate’ or ‘drug’ to denote the small molecules that bind to the protein.
REFERENCES
- 1.Ortiz de Montellano P. Cytochrome P450: Structure, Mechanism, Biochemistry. Springer; 2005. [Google Scholar]
- 2.Estabrook RW. A passion for P450s (remembrances of the early history of research on cytochrome P450) Drug Metab Dispos. 2003;31:1461–73. doi: 10.1124/dmd.31.12.1461. [DOI] [PubMed] [Google Scholar]
- 3.Guengerich FP. Cytochrome P-450 3A4: regulation and role in drug metabolism. Annu Rev Pharmacol Toxicol. 1999;39:1–17. doi: 10.1146/annurev.pharmtox.39.1.1. [DOI] [PubMed] [Google Scholar]
- 4.Shou M, Grogan J, Mancewicz JA, et al. Activation of CYP3A4: evidence for the simultaneous binding of two substrates in a cytochrome P450 active site. Biochemistry. 1994;33:6450–5. doi: 10.1021/bi00187a009. [DOI] [PubMed] [Google Scholar]
- 5.Galetin A, Clarke SE, Houston JB. Multisite kinetic analysis of interactions between prototypical CYP3A4 subgroup substrates: midazolam, testosterone, and nifedipine. Drug Metab Dispos. 2003;31:1108–16. doi: 10.1124/dmd.31.9.1108. [DOI] [PubMed] [Google Scholar]
- 6.Shou M. Kinetic analysis for multiple substrate interaction at the active site of cytochrome P450. Methods Enzymol. 2002;357:261–76. doi: 10.1016/s0076-6879(02)57684-9. [DOI] [PubMed] [Google Scholar]
- 7.Williams PA, Cosme J, Vinkovic DM, et al. Crystal structures of human cytochrome P450 3A4 bound to metyrapone and progesterone. Science. 2004;305:683–6. doi: 10.1126/science.1099736. [DOI] [PubMed] [Google Scholar]
- 8.Scott EE, He YA, Wester MR, et al. An open conformation of mammalian cytochrome P450 2B4 at 1.6-A resolution. Proc Natl Acad Sci U S A. 2003;100:13196–201. doi: 10.1073/pnas.2133986100. [DOI] [PMC free article] [PubMed] [Google Scholar]
- 9.Williams PA, Cosme J, Ward A, et al. Crystal structure of human cytochrome P450 2C9 with bound warfarin. Nature. 2003;424:464–8. doi: 10.1038/nature01862. [DOI] [PubMed] [Google Scholar]
- 10.Wester MR, Yano JK, Schoch GA, et al. The structure of human cytochrome P450 2C9 complexed with flurbiprofen at 2.0-A resolution. J Biol Chem. 2004;279:35630–7. doi: 10.1074/jbc.M405427200. [DOI] [PubMed] [Google Scholar]
- 11.Dabrowski MJ, Schrag ML, Wienkers LC, Atkins WM. Pyrene.pyrene complexes at the active site of cytochrome P450 3A4: evidence for a multiple substrate binding site. J Am Chem Soc. 2002;124:11866–7. doi: 10.1021/ja027552x. [DOI] [PubMed] [Google Scholar]
- 12.He YA, Roussel F, Halpert JR. Analysis of homotropic and heterotropic cooperativity of diazepam oxidation by CYP3A4 using site-directed mutagenesis and kinetic modeling. Arch Biochem Biophys. 2003;409:92–101. doi: 10.1016/s0003-9861(02)00484-8. [DOI] [PubMed] [Google Scholar]
- 13.Shou M, Lin Y, Lu P, et al. Enzyme kinetics of cytochrome P450-mediated reactions. Curr Drug Metab. 2001;2:17–36. doi: 10.2174/1389200013338784. [DOI] [PubMed] [Google Scholar]
- 14.Tracy TS. Atypical enzyme kinetics: their effect on in vitro-in vivo pharmacokinetic predictions and drug interactions. Curr Drug Metab. 2003;4:341–6. doi: 10.2174/1389200033489280. [DOI] [PubMed] [Google Scholar]
- 15.Kenworthy KE, Clarke SE, Andrews J, Houston JB. Multisite kinetic models for CYP3A4: simultaneous activation and inhibition of diazepam and testosterone metabolism. Drug Metab Dispos. 2001;29:1644–51. [PubMed] [Google Scholar]
- 16.Roberts AG, Campbell AP, Atkins WM. The thermodynamic landscape of testosterone binding to cytochrome P450 3A4: ligand binding and spin state equilibria. Biochemistry. 2005;44:1353–66. doi: 10.1021/bi0481390. [DOI] [PubMed] [Google Scholar]
- 17.Davydov DR, Kumar S, Halpert JR. Allosteric mechanisms in P450eryF probed with 1-pyrenebutanol, a novel fluorescent substrate. Biochem Biophys Res Commun. 2002;294:806–12. doi: 10.1016/S0006-291X(02)00565-X. [DOI] [PubMed] [Google Scholar]
- 18.Baas BJ, Denisov IG, Sligar SG. Homotropic cooperativity of monomeric cytochrome P450 3A4 in a nanoscale native bilayer environment. Arch Biochem Biophys. 2004;430:218–28. doi: 10.1016/j.abb.2004.07.003. [DOI] [PubMed] [Google Scholar]
- 19.Atkins WM. Non-Michaelis-Menten kinetics in cytochrome P450-catalyzed reactions. Annu Rev Pharmacol Toxicol. 2005;45:291–310. doi: 10.1146/annurev.pharmtox.45.120403.100004. [DOI] [PubMed] [Google Scholar]
- 20.Moody DE, Walsh SL, Rollins DE, Neff JA, Huang W. Ketoconazole, a cytochrome P450 3A4 inhibitor, markedly increases concentrations of levo-acetyl-alpha-methadol in opioid-naive individuals. Clin Pharmacol Ther. 2004;76:154–66. doi: 10.1016/j.clpt.2004.04.004. [DOI] [PubMed] [Google Scholar]
- 21.Colburn DE, Giles FJ, Oladovich D, Smith JA. In vitro evaluation of cytochrome P450-mediated drug interactions between cytarabine, idarubicin, itraconazole and caspofungin. Hematology. 2004;9:217–21. doi: 10.1080/10245330410001701585. [DOI] [PubMed] [Google Scholar]
- 22.Bates DW, Yu DT. Clinical impact of drug-drug interactions with systemic azole antifungals. Drugs Today (Barc) 2003;39:801–13. doi: 10.1358/dot.2003.39.10.799473. [DOI] [PubMed] [Google Scholar]
- 23.Katz HI. Drug interactions of the newer oral antifungal agents. Br J Dermatol. 1999;141(Suppl 56):26–32. doi: 10.1046/j.1365-2133.1999.00011.x. [DOI] [PubMed] [Google Scholar]
- 24.Jefcoate CR. Measurement of substrate and inhibitor binding to microsomal cytochrome P-450 by optical-difference spectroscopy. Methods Enzymol. 1978;52:258–79. doi: 10.1016/s0076-6879(78)52029-6. [DOI] [PubMed] [Google Scholar]
- 25.Podust LM, Poulos TL, Waterman MR. Crystal structure of cytochrome P450 14alpha -sterol demethylase (CYP51) from Mycobacterium tuberculosis in complex with azole inhibitors. Proc Natl Acad Sci U S A. 2001;98:3068–73. doi: 10.1073/pnas.061562898. [DOI] [PMC free article] [PubMed] [Google Scholar]
- 26.Matsuura K, Yoshioka S, Tosha T, et al. Structural diversities of active site in clinical azole-bound forms between sterol 14alpha-demethylases (CYP51s) from human and Mycobacterium tuberculosis. J Biol Chem. 2005;280:9088–96. doi: 10.1074/jbc.M413042200. [DOI] [PubMed] [Google Scholar]
- 27.Isoherranen N, Kunze KL, Allen KE, Nelson WL, Thummel KE. Role of itraconazole metabolites in CYP3A4 inhibition. Drug Metab Dispos. 2004;32:1121–31. doi: 10.1124/dmd.104.000315. [DOI] [PubMed] [Google Scholar]
- 28.Erve JCL, Dandeneau AA, Patten C, Stresser DM, Crespi CL. Metabolic stability of CYP isoform selective inhibitors in the presence of human liver microsomes; Paper presented at the 13th International Symposium on Microsomes and Drug Oxidations; Stressa, Italy. 2000. [Google Scholar]
- 29.Dilmaghanian S, Gerber JG, Filler SG, Sanchez A, Gal J. Enantioselectivity of inhibition of cytochrome P450 3A4 (CYP3A4) by ketoconazole: Testosterone and methadone as substrates. Chirality. 2004;16:79–85. doi: 10.1002/chir.10294. [DOI] [PubMed] [Google Scholar]
- 30.Gillam EM, Baba T, Kim BR, Ohmori S, Guengerich FP. Expression of modified human cytochrome P450 3A4 in Escherichia coli and purification and reconstitution of the enzyme. Arch Biochem Biophys. 1993;305:123–31. doi: 10.1006/abbi.1993.1401. [DOI] [PubMed] [Google Scholar]
- 31.Omura T, Sate R. The carbon monoxide-binding pigment of liver microsomes. II. solubilization, purification, and properties. J. Biol. Chem. 1964;239:2379–2385. [PubMed] [Google Scholar]
- 32.Rich RL, Myszka DG. Advances in surface plasmon resonance biosensor analysis. Curr Opin Biotechnol. 2000;11:54–61. doi: 10.1016/s0958-1669(99)00054-3. [DOI] [PubMed] [Google Scholar]
- 33.Rich RL, Myszka DG. Survey of the year 2003 commercial optical biosensor literature. J Mol Recognit. 2005;18:1–39. doi: 10.1002/jmr.726. [DOI] [PubMed] [Google Scholar]
- 34.Myszka DG. Kinetic, equilibrium, and thermodynamic analysis of macromolecular interactions with BIACORE. Methods Enzymol. 2000;323:325–40. doi: 10.1016/s0076-6879(00)23372-7. [DOI] [PubMed] [Google Scholar]
- 35.Frostell-Karlsson Å, Remaeus A, Roos H, Andersson K, Borg P, Hämäläinen, Karlsson R. Biosensor analysis of the interaction between immobilized human serum albumin and drug compounds for prediction of human serum albumin binding levels. J Medicinal Chemistry. 2000;43:1986–1992. doi: 10.1021/jm991174y. [DOI] [PubMed] [Google Scholar]
- 36.Karp NA, Edwards PR, Leatherbarrow RJ. Analysis of calibration methodologies for solvent effects in drug discovery studies using evanescent wave biosensors. Biosensors and Bioelectronics. 2005;21(1):128–134. doi: 10.1016/j.bios.2004.08.027. [DOI] [PubMed] [Google Scholar]
- 37.Sono M, Dawson JH. Formation of low spin complexes of ferric cytochrome P-450-CAM with anionic ligands. Spin state and ligand affinity comparison to myoglobin. J Biol Chem. 1982;257:5496–502. [PubMed] [Google Scholar]
- 38.Satchel JF, Smith BJ. Caluculation of aqueous dissociation constants of 1,2,4-triazole and tetrazole: A comparison of solvation models. Physical Chemistry Chemical Physics. 2002;4(18):4314–4318. [Google Scholar]
- 39.Boussadd S, Pean J, Tao NJ. High-Resolution Multiwavelength Surface Plasmon Resonance Spectroscopy for Probing Conformational and Electronic Changes in Redox Proteins. Analytical Chem. 2000;72:222–226. doi: 10.1021/ac990947n. [DOI] [PubMed] [Google Scholar]
- 40.Davydov DR, Halpert JR, Renaud JP, Hui Bon Hoa G. Conformational heterogeneity of cytochrome P450 3A4 revealed by high pressure spectroscopy. Biochem Biophys Res Commun. 2003;312:121–30. doi: 10.1016/j.bbrc.2003.09.247. [DOI] [PubMed] [Google Scholar]
- 41.Strickler M, Goldstein BM, Maxfield K, et al. Crystallographic studies on the complex behavior of nicotine binding to P450cam (CYP101) Biochemistry. 2003;42:11943–50. doi: 10.1021/bi034833o. [DOI] [PubMed] [Google Scholar]
- 42.Wester MR, Johnson EF, Marques-Soares C, et al. Structure of a substrate complex of mammalian cytochrome P450 2C5 at 2.3 A resolution: evidence for multiple substrate binding modes. Biochemistry. 2003;42:6370–9. doi: 10.1021/bi0273922. [DOI] [PubMed] [Google Scholar]
- 43.Shou M, Dai R, Cui D, et al. A kinetic model for the metabolic interaction of two substrates at the active site of cytochrome P450 3A4. J Biol Chem. 2001;276:2256–62. doi: 10.1074/jbc.M008799200. [DOI] [PubMed] [Google Scholar]
- 44.Cook DL, Atkins WM. Enhanced detoxication due to distributive catalysis and toxic thresholds: a kinetic analysis. Biochemistry. 1997;36:10801–6. doi: 10.1021/bi971284b. [DOI] [PubMed] [Google Scholar]
- 45.Korzekwa KR, Trager WF, Gillette JR. Theory for the observed isotope effects from enzymatic systems that form multiple products via branched reaction pathways: cytochrome P-450. Biochemistry. 1989;28:9012–8. doi: 10.1021/bi00449a009. [DOI] [PubMed] [Google Scholar]
- 46.Iyer KR, Jones JP, Darbyshire JF, Trager WF. Intramolecular isotope effects for benzylic hydroxylation of isomeric xylenes and 4,4′-dimethylbiphenyl by cytochrome P450: relationship between distance of methyl groups and masking of the intrinsic isotope effect. Biochemistry. 1997;36:7136–43. doi: 10.1021/bi962810m. [DOI] [PubMed] [Google Scholar]
- 47.Darbyshire JF, Gillette JR, Nagata K, Sugiyama K. Deuterium isotope effects on A-ring and D-ring metabolism of testosterone by CYP2C11: evidence for dissociation of activated enzyme-substrate complexes. Biochemistry. 1994;33:2938–44. doi: 10.1021/bi00176a025. [DOI] [PubMed] [Google Scholar]
- 48.Franke A, Stochel G, Jung C, Van Eldik R. Substrate binding favors enhanced NO binding to P450cam. J Am Chem Soc. 2004;126:4181–91. doi: 10.1021/ja038774d. [DOI] [PubMed] [Google Scholar]
- 49.Wang LH, Tsai AL, Hsu PY. Substrate binding is the rate-limiting step in thromboxane synthase catalysis. J Biol Chem. 2001;276:14737–43. doi: 10.1074/jbc.M009177200. [DOI] [PubMed] [Google Scholar]
- 50.Gibbs MA, Thummel KE, Shen DD, Kunze KL. Inhibition of cytochrome P-450 3A (CYP3A) in human intestinal and liver microsomes: comparison of Ki values and impact of CYP3A5 expression. Drug Metab Dispos. 1999;27:180–7. [PubMed] [Google Scholar]
- 51.Omar G, Whiting PH, Hawksworth GM, Humphrey MJ, Burke MD. Ketoconazole and fluconazole inhibition of the metabolism of cyclosporin A by human liver in vitro. Ther Drug Monit. 1997;19:436–45. doi: 10.1097/00007691-199708000-00013. [DOI] [PubMed] [Google Scholar]
- 52.Antosiewicz J, Wlodek ST, McCammon JA. Acetylchoinesterase: role of the enzyme’s charge distribution in steering charged ligands toward the active site. Biopolymers. 1996;39(1):85–94. doi: 10.1002/(SICI)1097-0282(199607)39:1%3C85::AID-BIP9%3E3.0.CO;2-R. [DOI] [PubMed] [Google Scholar]
- 53.Wade RC, Gabdoulline RR, Ludemann SK, Lounnas V. Electrostatic steering and ionic tethering in enzyme-ligand binding: insights from simulations. PNAS. 1998;95(1):5942–5949. doi: 10.1073/pnas.95.11.5942. [DOI] [PMC free article] [PubMed] [Google Scholar]
- 54.Antosiewicz J, McCammon JA. Electrostatic and hydrodynamic orientational steering effects in enzyme-substrate association. Biophys. J. 1995;69(1):57–65. doi: 10.1016/S0006-3495(95)79874-5. [DOI] [PMC free article] [PubMed] [Google Scholar]
- 55.Allison SA, Northrup SH, McCammon JA. Simulation of biomolecular diffusion and complex formation. Biophys. J. 1986;49(1):167–175. doi: 10.1016/S0006-3495(86)83632-3. [DOI] [PMC free article] [PubMed] [Google Scholar]
- 56.Brune D, Kim S. Hydrodynamic steering effects in protein association. PNAS. 1994;91(8):2930–2934. doi: 10.1073/pnas.91.8.2930. [DOI] [PMC free article] [PubMed] [Google Scholar]
Associated Data
This section collects any data citations, data availability statements, or supplementary materials included in this article.


