Abstract
Non-invasive blood perfusion measurement systems have been developed and tested in a phantom tissue and an animal model. The probes use a small sensor with a laminated flat thermocouple to measure the heat transfer and temperature response to an arbitrary thermal event (convective or conductive) imposed on the tissue surface. Blood perfusion and thermal contact resistance are estimated by comparing heat flux data with a mathematical model of the tissue. The perfusion probes were evaluated for repeatability and sensitivity using both a phantom tissue test stand and exposed rat liver tests. Perfusion in the phantom tissue tests was varied by controlling the flow of water into the phantom tissue test section, and the perfusion in the exposed liver tests was varied by temporarily occluding blood flow through the portal vein. The phantom tissue tests indicated that the probes can be used to detect small changes in perfusion (0.005 ml/ml/s). The probes qualitatively tracked the changes in the perfusion of the liver model due to occlusion of the portal vein.
Keywords: blood flow, perfusion, microcirculation, thermal sensor
1. Introduction
Blood perfusion is the local fluid flow through the capillary network and extracellular spaces of living tissue. It is characterized as the volumetric flow rate per volume of tissue. Blood perfusion is vital for normal tissue physiology and is responsible for the transport of oxygen, nutrients, and waste products. Also, blood perfusion is a principal part of the thermal regulatory system of the body. While perfusion is related to the overall blood flow in the arteries and veins, its local distribution in specific tissues can be crucial to the proper functioning of the body.
Since blood perfusion is so important in maintaining normal physiologic conditions, there is a vital need to be able to easily and accurately measure it. A large perfusion value range has been reported for human tissue (0.001 to 0.1 ml/ml/s), representing resting muscle to kidneys. There are many clinical applications for perfusion measurement because variations in blood perfusion can indicate abnormal physiologic or pathologic conditions. These conditions include the assessment of skin graft acceptance, tumor growth, and burn and other wound healing. Therefore, the measurement of blood perfusion is a valuable medical diagnostic tool.
One promising method provides non-invasive perfusion estimates based on the thermal energy of the perfusate using surface measurements of the tissue. The convective perfusion probe at Virginia Tech imposes a thermal event on a small surface area of tissue through convective cooling and measures the thermal response of the tissue using a small sensor placed on the surface [1]. Perfusion values are estimated by a minimization routine that compares the experimental heat flux measurements and those calculated from a corresponding mathematical model of the system. While the convective perfusion probe has been shown to be a viable perfusion measurement probe, it is limited in application due to the required pressurized air supply.
The objective of the current research is to develop an inexpensive non-invasive blood perfusion probe that can be used in a wider range of clinical applications. The specific goals are to develop a version of the blood perfusion probe that has greater ease of use and validate this new probe using both phantom and animal tissue systems.
2. Background on Perfusion Measuring Techniques
Both invasive and non-invasive methods have been developed to measure blood perfusion. Some of the invasive methods require the placement of microspheres within the tissue for one-time perfusion measurements [2] or probes that deposit thermal energy into the tissue and measure the thermal response of the tissue [3]. These methods not only disturb the tissue to be measured, but also cause discomfort and increase the risk of infection to the patient.
Techniques for deep tissue perfusion measurements include imaging and some thermal methods. Magnetic Resonance Imaging (MRI) is among the non-invasive imaging methods used to directly measure blood perfusion by injecting a tracer or using arterial blood as an internal tracer [4, 5]. Arterial Spin Labeling (ASL) is a MRI technique used to determine temporally and spatially resolved perfusion in tissue [5, 6]. While MRI provides accurate, repeatable and absolute perfusion measurements in deep tissue [7], it requires large, expensive equipment, and cannot be used in a surgical setting.
Positron Emission Tomography (PET) is another deep tissue imaging technique used to measure blood perfusion, but it requires that a radioactive tracer be introduced into the blood supply. A solution of glucose (sugar) that has been “tagged” with a radioactive chemical isotope (usually fluorine 18, N-ammonia, or O labeled water) is injected into the blood stream [8]. Images are created from the radioactive emissions [9,10]. While this imaging technique also provides perfusion measurements, it is limited by the cost, size, and processing time of the equipment.
Another technique for invasively measuring deep tissue blood perfusion uses a Thermal Diffusion Probe (TDP). This system works based on the clearance (removal) of thermal energy from the tissue by the blood [11,12]. A thermal diffusion probe uses a self-heated thermistor to measure the power as a function of time required to keep the probe temperature a constant offset higher than the tissue temperature [3]. Absolute perfusion values are obtained using solutions of the transient thermal energy equation.
Laser Doppler Flowmetry (LDF) is a non-invasive surface measurement technique that optically provides real-time measurement of red blood cell motion within tissue. LDF and Laser Doppler Imaging (LDI) illuminate the tissue with a laser and relate perfusion to the product of the mean velocity and concentration of the red blood cells within the volume of tissue being measured [13]. The results are only given in relative units and they are sensitive to the optical properties of the tissue. Applications for these systems include monitoring dialysis [14], assessing transplant rejection [15], and assessing the extent of burn wounds [16].
Several non-invasive thermal methods have also been developed. These methods usually have a heater and temperature sensor on the surface of the tissue, arranged to minimize heat loss. Castellana et al. [17] placed a thin-film resistor on the skin surface to provide heat and measure the temperature. Holti and Mitchell [18] placed a thermopile between a heated copper cylinder and a surrounding annulus of copper on the surface of the skin. They attempted to relate blood perfusion to the measured radial temperature difference established after several minutes of heating. These non-invasive thermal methods had limited success because of several problems. First, the heat losses to the ambient are typically large, making the actual heat flux going into the tissue difficult to determine. Second, the thermal contact resistance between the probe and the surface of the tissue is important in non-invasive probes and can be difficult to determine.
The convective perfusion probe at Virginia Tech [19], shown in Fig. 1, sits directly on the tissue (skin or any other organ that can be exposed). It uses room temperature compressed air to cool the tissue and elicits a measurable heat flux response non-invasively. Unlike previous thermal probes, the heat flux is measured directly and the tissue is cooled rather than heated, which is much safer to the tissue. The heat flux, along with temperature measurements, is used to estimate perfusion through a mathematical model of the thermal process and a parameter estimation routine.
Fig. 1.
The convective perfusion probe elicits a thermal response using compressed air.
While this probe showed good sensitivity and repeatability for both living and nonliving tissue tests, its need for compressed air limits its clinical application. The goal for the present research is to investigate other methods of providing the thermal event to simplify the system and improve its ease of use. A sensor system that could accurately and reliably estimate perfusion with a variety of thermal event sources, not just convection, was examined. The system was then tested on both non-living and living tissues and compared to the performance of the convective probe.
3. Pressed Sensor Technology
The heat flux measurement in the Virginia Tech convective perfusion probe is made using a BF-02 heat flux gage (Vatell, Corp., Christiansburg, VA). This is a thermopile-based heat flux sensor that is only 0.25-mm thick, but still rigid. A temperature measurement, however, is not provided at the location of the heat flux measurement on this gage. To improve the measurement capability of this sensor for the present work, it was modified by laminating a thin, flat thermocouple to the side of the sensor in contact with the tissue.
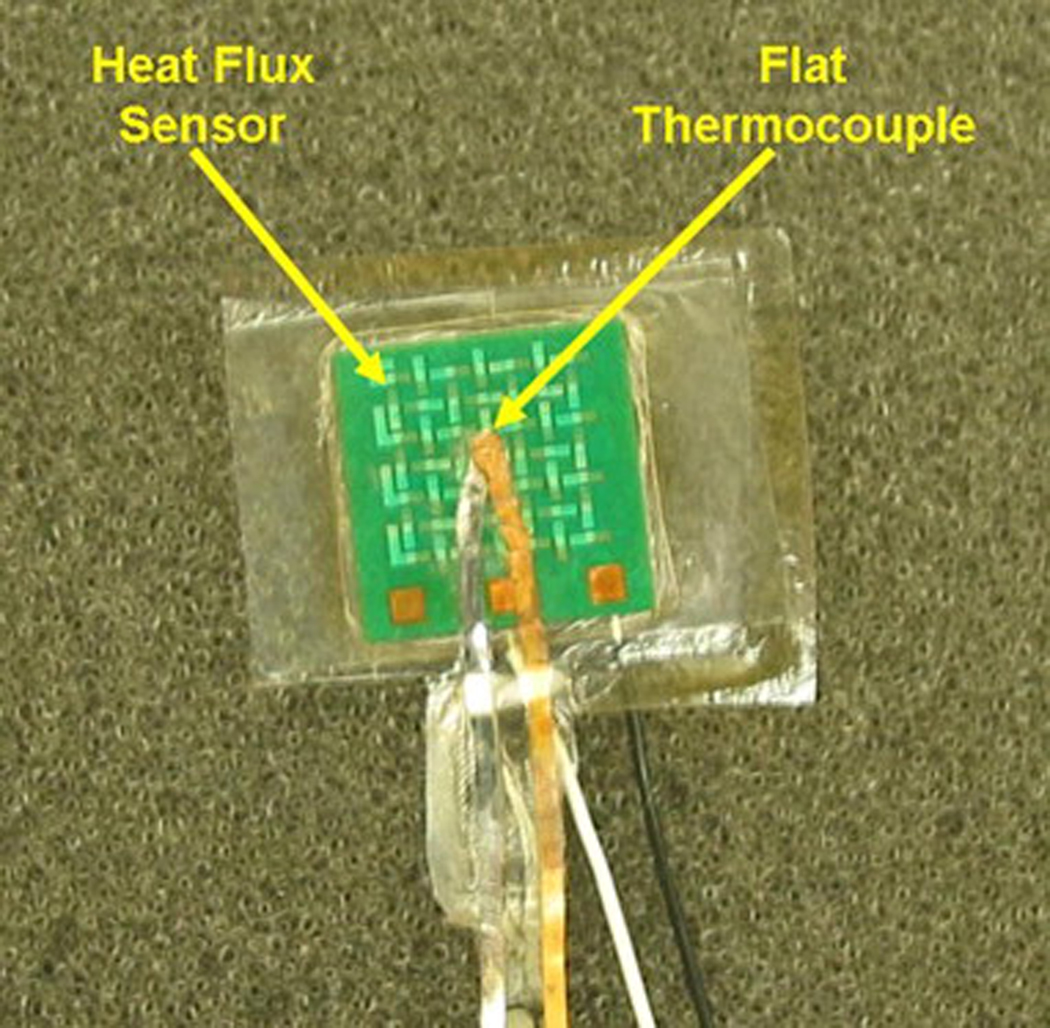
A foil thermocouple 0.0127-mm thick (RDF Corporation, Hudson, NH) was laminated to the 10 mm × 10-mm-square heat flux sensor using layers of thin plastic (0.005-mm thick) and a heat activated epoxy. A layer of thin plastic was placed over one side of the sensor using a layer of heat activated epoxy. On the “tissue” side of the sensor, a layer of epoxy was applied, then a thin layer of plastic, another layer of epoxy, the foil thermocouple, a layer of epoxy and a thin layer of plastic. This entire layered structure was placed in a hot press at 160°C for three hours. This resulted in a completely sealed sensor (0.28 mm thick) with a thin film thermocouple next to the test material. It provides a direct temperature measurement between the tissue and sensor, as well as a water tight seal to protect the sensor from moisture present in tissue. Fig. 2 shows the sensor with the laminated flat thermocouple.
Fig. 2.
Heat flux sensor with laminated flat thermocouple.
4. Perfusion Probe Designs
The pressed sensor provides continuous measurement of both the heat flux and corresponding temperature at the surface of a sample material. With both of these quantities continuously known, the appropriate analytical model of tissue can estimate perfusion regardless of the mechanism used to elicit a heat flux response from the tissue. Two different arrangements were tested and evaluated.
4.1 Convective Laminated Perfusion Probe
The previously described convective perfusion probe [1,19] was adapted to incorporate the use of the pressed sensor. The pressed sensor with a laminated flat thermocouple was attached to the probe housing instead of the original sensor without the thin film thermocouple. This adapted convective probe is referred to as the Convective Laminated Perfusion Probe. With the addition of the pressed sensor, the finite-difference model of the system was no longer confined to the use of a convective air boundary condition and conduction model of the heat flux sensor. The measured heat flux and temperature of the sensor surface in contact with the tissue is sufficient to specify the thermal boundary condition. In summary, the perfusion could be estimated in two ways: using the temperature of the air, the heat transfer coefficient and the thermal model of the sensor, or simply using the heat flux and pressed thermocouple temperature.
4.2 Passive Perfusion Probe
The passive probe utilizes a 10 mm cubic aluminum block as a heat sink to create the thermal event. The laminated sensor is affixed to one side of the aluminum block with double-sided tape, as shown in Fig. 3. The assembly is placed onto the tissue and the initial room temperature of the block elicits a heat flux response from the tissue. The system relies on the thermal capacitance of the block to provide the necessary difference in temperature to produce a measurable heat flux for the duration of the event. Aluminum was chosen because the product of its conductivity, density, and specific heat is much larger than that of the tissue. This large difference in thermal properties allows the aluminum to provide sufficient cooling for the tissue without causing discomfort to the patient. While the laminated thermocouple provides the sensor temperature, a thermistor is used to record the aluminum block’s temperature during testing. In between measurements the probe was placed on an aluminum plate to bring it back to room temperature conditions.
Fig. 3.
Passive perfusion probe assembly with the pressed sensor affixed to the aluminum block.
The passive perfusion probe provides an adequate thermal event from which to estimate perfusion without requiring additional equipment or complicated modeling. It is inherently safe to the patient and its simple and portable design allows it to be used widely in clinical and surgical situations.
5. Finite-Difference Modeling and Parameter Estimation
Perfusion is determined through parameter estimation techniques by comparing measured experimental and calculated heat flux data through a minimization routine [20]. A two-dimensional cylindrical finite-difference model of the tissue was used based on the Pennes [21] bioheat equation
| (1) |
where T is temperature, t is time, ρ is density, c is specific heat, k is thermal conductivity, and ω is blood perfusion. The subscripts t, b, v, and a, correspond to tissue, blood, venous and arterial, respectively. The first term on the left hand side is the transient storage term. On the right hand side, conduction in the tissue makes up the first term followed by the term for energy exchange due to blood perfusion. The key assumption of this perfusion term is that the blood fully equilibrates with the tissue temperature before leaving, therefore Tv = Tt in equation 1. It is assumed that the tissue is homogenous, and is supplied with arterial blood at the body’s core temperature. Metabolic heat generation is neglected in equation 1 because it is several orders of magnitude smaller than the thermal effect of perfusion for most tissues when the probe is used.
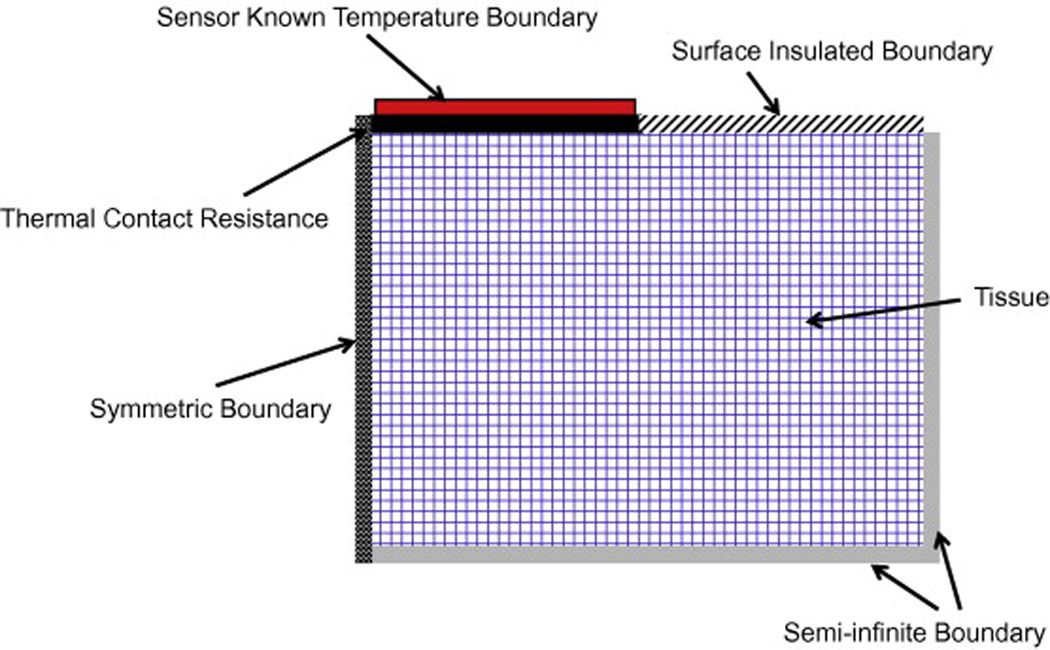
The input temperatures for the model include the recorded sensor, arterial and initial tissue temperatures. The heat flux and sensor temperature are recorded as functions of time throughout the thermal event. The initial arterial and tissue temperatures are averaged over the length of time prior to the start of the thermal event. The temperature boundary conditions of the model are shown in Fig. 4. All of the surfaces are adiabatic expect the known (measured) temperature boundary with the sensor. A thermal contact resistance is used between the sensor and the tissue,
| (2) |
Its value is determined from the parameter estimation process for each experimental test. The thermal penetration depth for the usual 60 s test with perfusion and a thermal diffusivity of 1.44 × 10⁻⁷ m2/s is only 1.25 mm. Therefore, a tissue thickness of 1 cm appears adiabatic (semi-infinite), as indicated in Fig. 4.
Fig. 4.
Schematic of the finite-difference tissue model.
An Alternating Direction Implicit (ADI) method is used to solve the discretized equations for the unknown temperature field. The heat flux is calculated across the thermal contact resistance. The Box-Kanemasu Method [20] is used to execute the minimization procedure for the parameter estimation as shown in Fig. 5. Both perfusion and thermal contact resistance at the interface between the probe and tissue are estimated.
Fig. 5.
Parameter Estimation method for blood perfusion, ω, and thermal contact resistance, Rc.
6. Experimental Methods
6.1 Experimental Equipment
The heat flux and temperature data were recorded using the data acquisition system shown in Fig. 6. The reference temperature for the thermocouple measurements is recorded using a Doric thermocouple reader. Thermistors were used to measure the temperature of the aluminum block and arterial and initial temperatures in the animal models. The signals from the heat flux sensor and the thermocouples were amplified, while the thermistor signals were not amplified. The thermistors were actuated by a voltage divider circuit that included a low-pass filter for each signal. All of these voltage signals were sampled at 12 Hz with a 16-bit, USB multifunction data acquisition system. The data acquisition process was controlled through National Instruments LabView 8.2 on a Pentium R-2 GHz laptop.
Fig. 6.
Data acquisition system used for the perfusion measurement system.
The heat flux voltage measurement is converted to heat flux using the calibrated sensitivity provided by the manufacturer, which was checked in our lab versus our standard heat flux sensors. The thermocouple voltage measurements are converted to temperature by multiplying by the standard thermocouple sensitivity (T-type) and adding the reference temperature. The thermistor resistance measurements are converted to temperature using a polynomial equation obtained from the thermistor calibration data sheet. All of the above conversions are programmed into a NI LabView VI so that the output is a text file containing only time, heat flux, and temperature measurements.
6.2 Phantom Tissue Tests
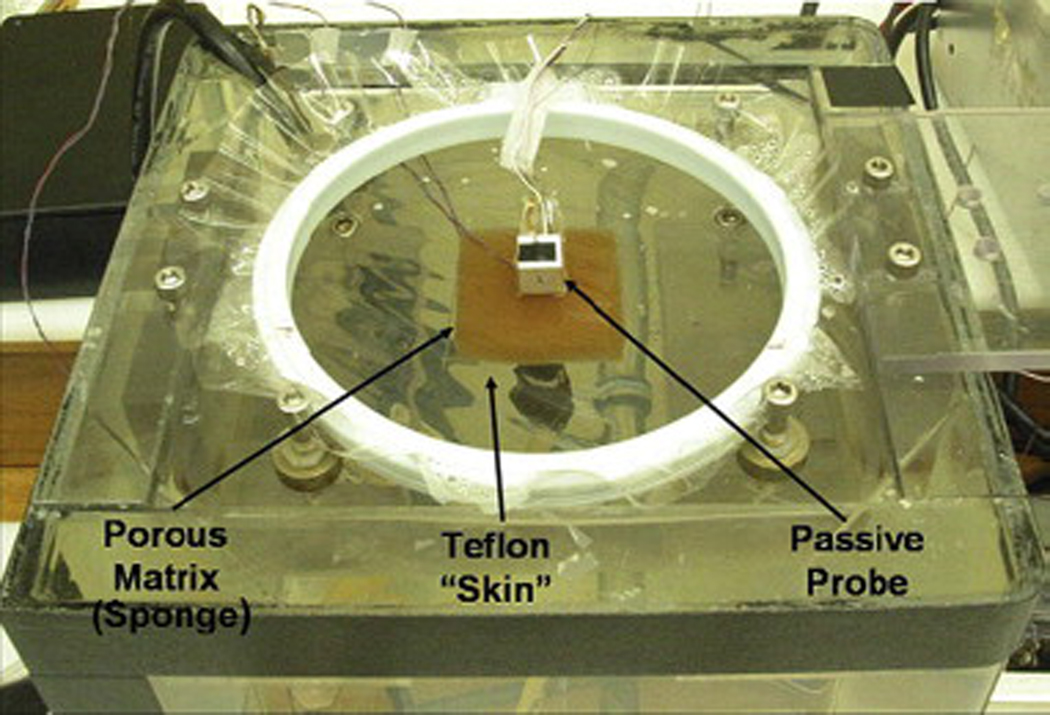
A three-dimensional drawing of the phantom tissue test stand [19] is shown in Fig. 7. This test stand allows for a wide range of known, repeatable perfusion flows while eliminating physiological uncertainty. It provides a controlled environment for perfusion estimation tests and minimizes animal usage, which is the only alternative. The test stand consists of a porous matrix (sponge) positioned directly above a water inlet monitored by a flow meter. The entire test section is enclosed in a water bath maintained at the core body temperature of 37°C. Figure 8 shows the assembled phantom tissue test stand in operation with the passive perfusion probe. This test method has been extensively validated both computationally (CFD) and experimentally with previous perfusion probes [19].
Fig. 7.
Three-dimensional model of phantom tissue test stand.
Fig. 8.
Phantom tissue test stand with passive perfusion probe in place.
Table 1 summarizes the experimental procedure timeline that was used for all phantom tissue tests. First, the flow rate is set and the system is allowed to equilibrate. Data acquisition begins and the first minute of data acquisition is used to determine the offset in the heat flux signal from the amplifier. Next, the thermal event is initiated after sixty seconds and continues for the second minute of data acquisition. After the data set is completed, the porous matrix is flushed at the maximum flow rate for two minutes to re-equilibrate the temperature within the porous matrix and the procedure is repeated. Tests were completed for flow rates ranging from 0 cc/min to 30 cc/min in increments of 5 cc/min. At each flow rate, twelve tests were completed to test repeatability.
Table 1.
Summary of the experimental procedure for the phantom tissue tests.
| Step | Convective Procedure | Passive Procedure | Time |
|---|---|---|---|
| 1 | Set desired flow rate for the experimental runs | Set desired flow rate for the experimental runs | Prior to test run |
| 2 | Start the data acquisition (heat flux and temperature) | Start the data acquisition (heat flux and temperature) | 0 sec |
| 3 | Turn the air supply on | Place the probe on the tissue | 60 sec |
| 4 | Turn the air supply off | Remove the probe from the tissue; Return probe to aluminum plate | 120 sec |
| 5 | Set the flow meter to maximum flow | Set the flow meter to maximum flow | 125 sec |
6.3 Exposed Rat Liver Tests
To validate the perfusion probe’s use on living tissue, an exposed liver of an anesthetized rat was used as a model. The rat was anesthetized and maintained under general anesthesia with isoflurane in 100% oxygen. Once anesthetized, the ventral abdomen was clipped from the xiphoid to the pubis and aseptically prepared for surgery. A sheet of ioban was used to drape the surgical site and an incision was made from the xiphpoid to the pubis using a number 15 scalpel blade. The portal vein was then identified and isolated for further manipulation. Occlusion of portal blood flow to the liver was temporarily performed using a microvascular clamp placed over the portal vein. The hepatic artery was not occluded at any time during the experimental procedure. To re-establish portal blood flow the microvascular clamp was removed from the portal vein.
Table 2 summarizes the experimental procedure timeline that was used for all exposed rat liver tests. First, the portal vein condition is set as fully occluded or fully open (non-occluded). Data acquisition begins and the first minute of data acquisition is used to determine the offset in the heat flux signal. Next, the thermal event is initiated after sixty seconds and continues for the second minute of data acquisition. Finally, the tissue is flushed by removing the occlusion and reestablishing portal blood flow within the tissue. After the two minutes of re-established blood flow, the procedure is repeated.
Table 2.
Summary of the experimental procedure for the exposed rat liver tests.
| Step | Convective Procedure | Passive Procedure | Time |
|---|---|---|---|
| 1 | Set desired portal vein condition (occluded or non-occluded) | Set desired portal vein condition (occluded or non-occluded) | Prior to test run |
| 2 | Start the data acquisition (heat flux and temperature) | Start the data acquisition (heat flux and temperature) | 0 sec |
| 3 | Turn the air supply on | Place the probe on the tissue | 60 sec |
| 4 | Turn the air supply off | Remove the probe from the tissue; Return probe to aluminum plate | 120 sec |
| 5 | Remove occlusion and reestablish portal blood flow within tissue | Remove occlusion and reestablish portal blood flow within tissue | 125 sec |
The first two tests were done without occluding the vein to ensure the repeatability of the measured heat flux data from the perfusion probe. The subsequent eight tests were conducted by alternately occluding the portal vein and then removing the clamp. Clamping the portal vein insures that blood flow both in and out of the tissue is ceased.
During all tests, the arterial and tissue temperatures were recorded with both thermocouples and thermistors. The arterial temperature of the rat was taken as the abdominal cavity temperature. The tissue temperature was taken as the temperature of the liver lobe on which the probe was placed. The tissue temperature also provided an initial temperature for the numerical model.
During both the convective and convective-laminated perfusion probe tests, the air temperature was recorded within the probe housing. The placement of the convective perfusion probe on the liver is shown in Fig. 9. During the passive perfusion probe tests, the pressed thermocouple temperature was recorded. The temperature of the aluminum block was recorded using a thermistor embedded in a hole deep into the block and monitored to ensure the block returned to room temperature (26°C) between experimental test runs. The placement of the passive perfusion probe on the liver is shown in Fig. 10.
Fig. 9.
Exposed rat liver model with the convective perfusion probe.
Fig. 10.
Exposed rat liver model with the passive perfusion probe.
7. Results and Discussion
Results are presented for both the passive and convective perfusion probes on the phantom tissue model and the exposed rat liver model. The results include both the experimental heat flux and parameter estimates of the perfusion and the thermal contact resistance.
7.1 Phantom Tissue Model
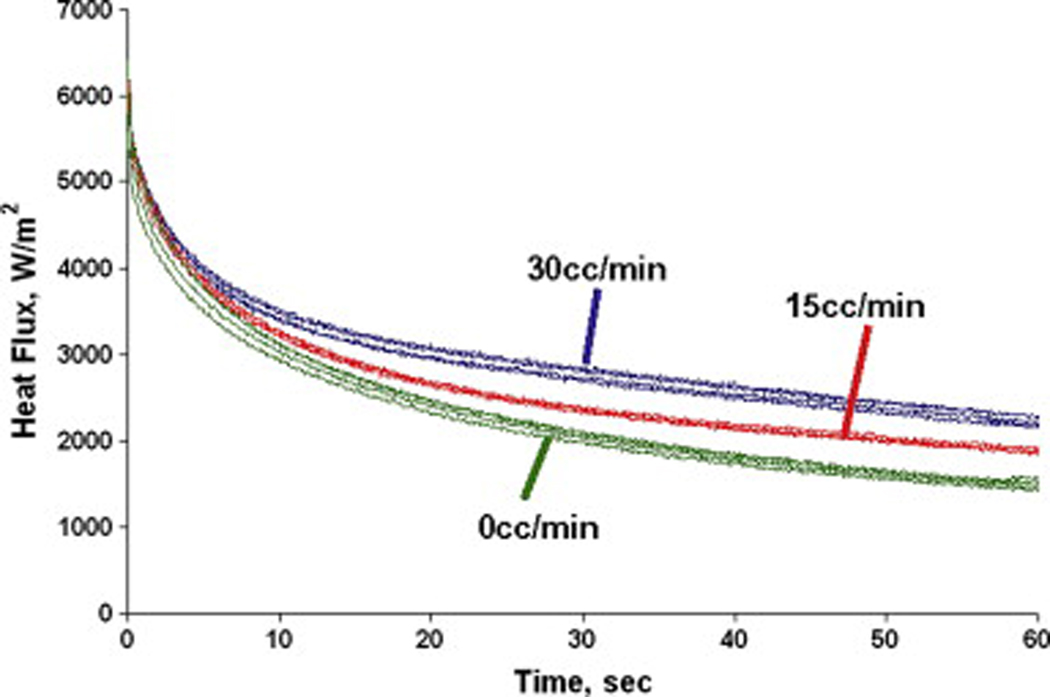
The phantom tissue test stand was designed to eliminate physiological uncertainty and produce repeatable results. A sample of the heat flux curves for the passive perfusion probe is shown in Fig. 11. It displays distinctly different trends in the heat flux over time for different flow rates and good repeatability from test to test. As the flow rate is increased from 0 to 30 cc/min, the heat flux remains higher at the longer times. Physically, the flow is able to supply more thermal energy to the surface. This clearance effect of the flow is what is measured through the perfusion term in equation 1.
Fig. 11.
Sample heat flux measurements for the passive perfusion probe on phantom tissue.
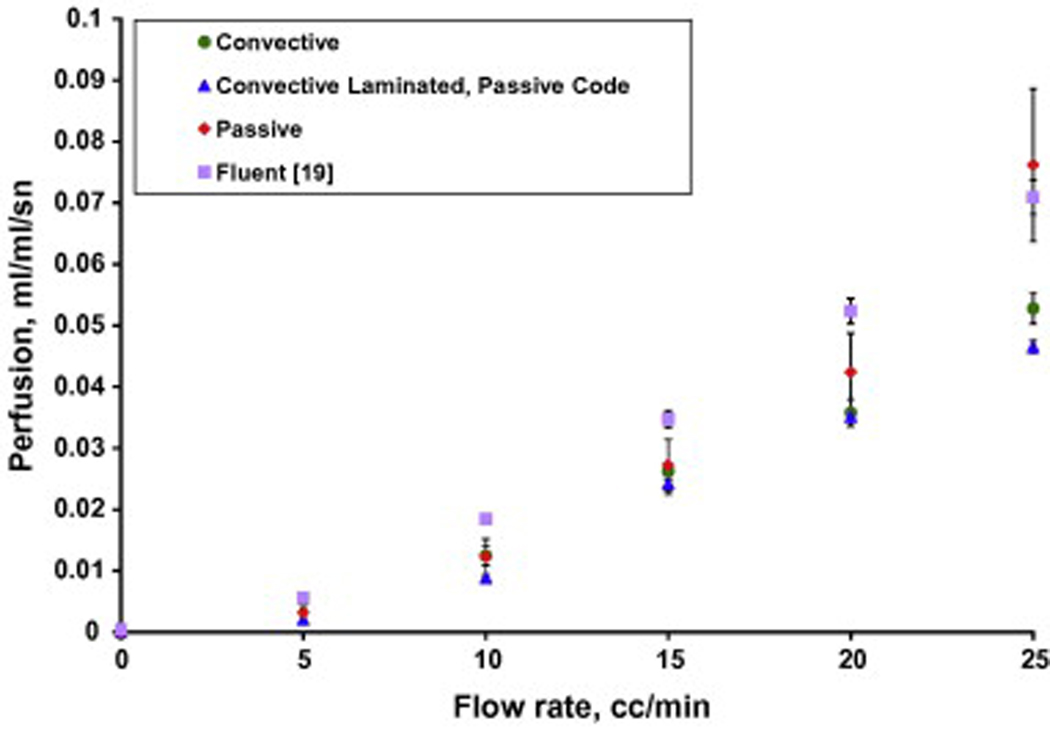
The parameter estimation code was used to determine the corresponding experimental perfusion in the phantom tissue test stand for all tests with the phantom perfusion probe. The average experimental perfusion values with 95% confidence intervals for three days of testing for flow rates ranging from 0 to 25 cc/min in 5 cc/min increments are shown in Fig. 12. The average perfusion estimates for both of the convective perfusion probes are also shown on Fig. 12 with 95% confidence intervals. The convective perfusion probe does not have the laminated thermocouple mounted on the heat flux sensor. Consequently, the convective results were obtained with two versions of the finite difference code: the convective and passive codes. The convective code models the convection above the sensor with the measured air temperature and given heat transfer coefficient. The passive code uses the model developed for the laminated sensor using the pressed thermocouple for the sensor boundary condition. For comparison the CFD (Fluent) results from Mudalier et al. [19] are also shown.
Fig. 12.
Perfusion estimates for the different probes on the phantom tissue test stand.
The perfusion estimates at 0 cc/min were slightly above or below zero for each probe. To adjust for this, the perfusion estimates at 0 cc/min were averaged and then used as a zero offset for each probe. These zero perfusion offsets have been subtracted from each set of probe data, resulting in an average perfusion of zero at the no flow condition. A summary of these zero offsets is given in Table 3.
Table 3.
Zero perfusion offsets for the phantom tissue model tests.
| Probe | Zero Perfusion Offset (ml/ml/s) |
|---|---|
| Convective Probe | 0.00122 |
| Convective Laminated Probe Air Code | −0.00380 |
| Convective Laminated Probe Passive Code | −0.00364 |
| Passive Probe | 0.00613 |
The perfusion estimates in Fig. 12 for the different probes all show the same trends, but with some differences in values at specific flow rates. The results are consistent with previous perfusion measurements on the phantom model [19], although with slightly lower perfusion values and larger confidence intervals. Overall, the passive results match the CFD model and the previous measurements [19] better than the convective probes. These results provide both an experimental and theoretical validation of the passive perfusion probe for obtaining perfusion estimates.
The perfusion uncertainties are higher for the passive probe than for the convective probes. One important difference in the tests is that the passive probe is necessarily taken off and re-positioned onto the tissue for each measurement. The convective probes are attached with double sided tape and left on the tissue for the entire series of measurements. This may explain some of the higher measurement uncertainty of the passive probe.
The average thermal contact resistances estimated for the passive perfusion probe on the phantom tissue model with the 95% confidence intervals are shown in Fig. 13. It can be seen from this figure that there is no correlation between contact resistance and flow rate, as would be expected. The convective perfusion probes display similar results for thermal contact resistance estimates.
Fig. 13.
Contact resistance estimates for the passive perfusion probe on phantom tissue.
7.2 Exposed Rat Liver Model
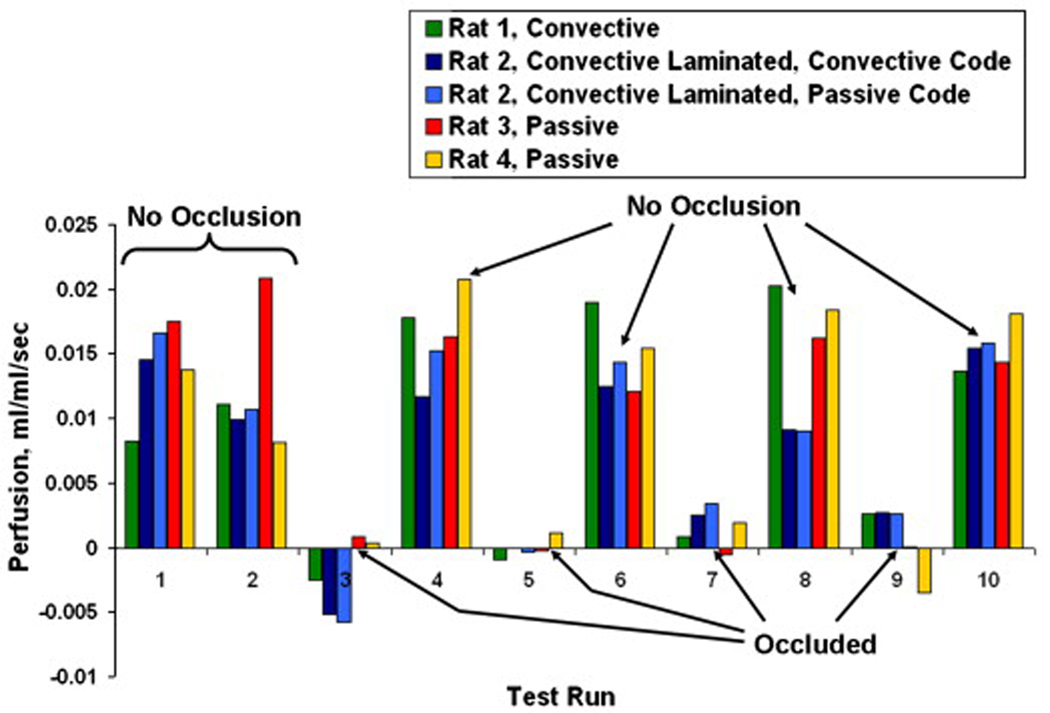
In vivo tests were conducted using the rat liver model to evaluate the qualitative performance of the perfusion probes. The heat flux response was similar to that seen on the phantom tissue test stand, as illustrated in Fig. 11. The parameter estimation results for the passive perfusion probe over two days of testing with two different rats are shown in Fig. 14. As with the phantom tissue tests, each day of testing resulted in a slight offset in perfusion values. These zero perfusion offsets were calculated by averaging the perfusion estimates for the occluded tests (Tests 3, 5, 7 and 9). These offsets (listed in Table 4) were then subtracted from all of the tests for each data set, resulting in near zero perfusion for the occluded cases.
Fig. 14.
Perfusion estimates for the exposed rat liver model with the passive perfusion probe.
Table 4.
Zero Perfusion Offsets for exposed rat liver tests.
| Probe | Zero Perfusion Offset (ml/ml/s) |
|---|---|
| Convective Probe | 0.00088 |
| Convective Probe with Pressed Sensor Air Code | 0.00198 |
| Convective Probe with Pressed Sensor Passive Code | −0.00471 |
| Passive Probe Day 1 | −0.01413 |
| Passive Probe Day 2 | −0.01019 |
The perfusion estimates for the initial non-occluded cases are typical values for living tissue. The subsequent tests exhibit the effects of occluding the portal vein. The perfusion drops substantially, as expected, for the occluded cases and then rises back to approximately the initial value when the occlusion is removed.
These results were compared to those obtained from the convective perfusion probes for the same testing regimen with two additional rats. The summary of these results are shown in Fig. 15. The first set of data is that obtained with the convective perfusion probe. The second and third sets of data were obtained with the convective laminated perfusion probe. The addition of the pressed sensor allowed perfusion to be estimated from the same data set by both the convective code and the passive code for the parameter estimation routine. The fourth and fifth sets of data are the passive perfusion probe results from Fig. 14. As discussed previously, the perfusion estimates of the occluded cases were averaged and subtracted from all results for each probe. Table 4 lists each of the zero perfusion offsets from the exposed rat liver tests for each probe. Statistical analysis showed that the probability that the means of the occluded and non-occluded cases will be equal is less than a tenth of a percent. Therefore, the probes were able to reliably distinguish perfusion changes due to occlusion in living tissue.
Fig. 15.
Perfusion estimates for the exposed rat liver model with all probes.
8. Conclusions
Several new types of thermal perfusion probes were evaluated and tested. The probes were based on a pressed sensor which combined a measurement of heat flux and surface temperature. The advantage of the passive probe is that no power or external thermal input is required for operation. It relies on the normal temperature difference between the body and the surroundings. The performance of the probes was successfully demonstrated on both a nonliving (phantom tissue) and a living tissue model. The tests on the phantom tissue model showed good repeatability and sensitivity of the perfusion measurements. The passive perfusion probe’s results were similar to those of the convective and convective laminated perfusion probes.
The rat liver was used as an experimental model to provide living tissue characteristics. The passive perfusion probe qualitatively measured perfusion changes in the rat liver caused by the occlusion of the portal vein. The results matched well with the perfusion changes measured by the convective and convective laminated probes for the rat liver model. These results demonstrate that the passive perfusion probe can quantitatively and qualitatively measure perfusion non-invasively.
Acknowledgments
This work has been supported by Grant No. EP03943-01 from the National Institutes of Health.
Glossary
Nomenclature
- c
specific heat, kJ/kg-K
- k
thermal conductivity, W/m-K
- q
heat flux, W/cm2
- Rc
thermal contact resistance, m2-K/W
- t
time, s
- T
temperature, °C
- ω
perfusion, mlb/mlt-s
- ρ
density, kg/m3
Subscripts
- a
artery
- b
blood
- g
gage
- t
tissue
- v
vein
Footnotes
Publisher's Disclaimer: This is a PDF file of an unedited manuscript that has been accepted for publication. As a service to our customers we are providing this early version of the manuscript. The manuscript will undergo copyediting, typesetting, and review of the resulting proof before it is published in its final citable form. Please note that during the production process errors may be discovered which could affect the content, and all legal disclaimers that apply to the journal pertain.
References
- 1.Mudaliar AV, Ellis BE, Ricketts PL, Lanz OI, Lee CY, Scott EP, Diller TE. Non-invasive blood perfusion measurements of an isolated rat liver and an anesthetized rat kidney. doi: 10.1115/1.2978989. submitted to Journal of Biomechanical Engineering. [DOI] [PMC free article] [PubMed] [Google Scholar]
- 2.Prinzen FW, Bassingthwaighte JB. Blood flow distributions by microsphere deposition methods. Cardiovascular Research. 2000;45:13–21. doi: 10.1016/s0008-6363(99)00252-7. [DOI] [PMC free article] [PubMed] [Google Scholar]
- 3.Khot MB, Maitz PKM, Phillips BR, Bowman HF, Pribaz JJ, Orgill DP. Thermal diffusion probe analysis of perfusion changes in vascular occlusions of rabbit pedicle flaps. Plastic Reconstructive Surgery. 2005;115:1103–1109. doi: 10.1097/01.prs.0000156546.45229.84. [DOI] [PubMed] [Google Scholar]
- 4.Montet X, Ivancevic MK, Belenger J, Jorge-Costa M, Pochon S, Pechér A, Terrier F, Vallé J-P. Noninvasive measurement of absolute renal perfusion by contrast medium enhanced magnetic resonance imaging. Investigative Radiology. 2003;38:584–592. doi: 10.1097/01.RLI.0000077127.11949.8c. [DOI] [PubMed] [Google Scholar]
- 5.Barbier EL, Lamalle L, Décorps M. Methodology of brain perfusion imaging. Journal of Magnetic Resonance Imaging. 2001;13:496–520. doi: 10.1002/jmri.1073. [DOI] [PubMed] [Google Scholar]
- 6.Willams DS, Detre JA, Leigh JS, Koretsky AP. Magnetic resonance imaging of perfusion using spin inversion of arterial water. Proceedings of the National Academy of Sciences of the United State of America; 1992. pp. 212–216. [DOI] [PMC free article] [PubMed] [Google Scholar]
- 7.Dias M, Hadgraft J, Glover PM, McDonald PJ. Stray field magnetic resonance imaging: A preliminary study of skin hydration. J. Phys. 2003;36:364–368. [Google Scholar]
- 8.Schelbert HR. PET contributions to understanding normal and abnormal cardiac perfusion and metabolism. Annals of Biomedical Engineering. 2000;28:922–929. doi: 10.1114/1.1310216. [DOI] [PubMed] [Google Scholar]
- 9.Nuutilia P, Kalliokoski K. Use of positron emission tomography in the assessment of skeletal muscle and tendon metabolism and perfusion. Scandinavian Journal of Medicine & Science in Sports. 2000;10:346–350. doi: 10.1034/j.1600-0838.2000.010006346.x. [DOI] [PubMed] [Google Scholar]
- 10.Boellaard R, Knaapen P, Rijbroek A, Lutersema GJJ, Lammertsma AA. Evaluation of basis function and linear least squares methods for generating parametric blood flow images using 15O-water and positron emission tomography. Molecular Imaging and Biology. 2005;7:273–285. doi: 10.1007/s11307-005-0007-2. [DOI] [PubMed] [Google Scholar]
- 11.Valvano JW, Allen JT, Bowman HF. The simultaneous measurement of thermal conductivity, thermal diffusivity, and perfusion in small volumes of tissue. Journal of Biomechanical Engineering. 1984;106:192–197. doi: 10.1115/1.3138482. [DOI] [PubMed] [Google Scholar]
- 12.Bowman H. ch. 9. In: Shitzer A, Eberhart R, editors. Estimation of tissue blood flow, Heat Transfer in Medicine and Biology. New York: Plenum Press; 1985. [Google Scholar]
- 13.Svedman C, Cherry GW, Strigini E, Ryan TJ. Laser Doppler imaging of skin microcirculation. Acta Dermato-Venereologica. 1998;78:114–118. doi: 10.1080/000155598433430. [DOI] [PubMed] [Google Scholar]
- 14.Niwayama J, Sanaka T. Development of a new method for monitoring blood purification: The blood flow analysis of the head and foot by laser Doppler blood flow meter during hemodialysis. Hemodialysis International. 2005;9:55–62. doi: 10.1111/j.1492-7535.2005.01118.x. [DOI] [PubMed] [Google Scholar]
- 15.Oltean MA, Aneman A, Dindelegan G, Mölne J, Olausson M, Herlenius G. Monitoring of the intestinal mucosal perfusion using laser Doppler flowmetry after multivisceral transplantation. Transplantation Proceedings; 2005. pp. 3323–3324. [DOI] [PubMed] [Google Scholar]
- 16.Mileski WJ, Atiles L, Purdue G, Kagan R, Saffle JR, Herndon DN, Heimbach D, Luterman A, Yurt R, Goodwin C, Hunt JL. Serial measurements increase the accuracy of laser Doppler assessment of burn wounds. Journal of Burn Care & Rehabilitation. 2003;24:187–191. doi: 10.1097/01.BCR.0000076091.79370.56. [DOI] [PubMed] [Google Scholar]
- 17.Castallena FS, Skalak R, Cho JM, Case RB. Steady state analysis and evaluation of new thermal sensor for surface measurement of tissue perfusion. Annals of Biomedical Engineering. 1983;11:101–115. doi: 10.1007/BF02367494. [DOI] [PubMed] [Google Scholar]
- 18.Holti G, Mitchell KW. Estimation of the nutrient skin blood flow using a non-invasive segmented thermal clearance probe, ch. 5. In: Rolfe EP, editor. Non-Invasive Physiological Measurements. London: Academic Press; 1979. [Google Scholar]
- 19.Mudaliar AV, Ellis BE, Ricketts PL, Lanz OI, Scott EP, Diller TE. A phantom tissue system for the calibration of a perfusion system. doi: 10.1115/1.2948417. accepted for publication in the Journal of Biomechanical Engineering. [DOI] [PMC free article] [PubMed] [Google Scholar]
- 20.Scott EP, Robinson PS, Diller TE. Development of methodologies for the estimation of blood perfusion using a minimally invasive probe. Measurement Science and Technology. 1998;9:888–897. [Google Scholar]
- 21.Pennes HH. Analysis of tissue and arterial blood temperatures in the resting human forearm. J. Appl. Physiol. 1948;1:93–122. doi: 10.1152/jappl.1948.1.2.93. [DOI] [PubMed] [Google Scholar]


