

Summary
Cortico-hippocampal interactions during sleep are believed to reorganize neural circuits in support of memory consolidation. However, spike timing relationships across cortico-hippocampal networks, which are key determinants of synaptic changes, are not well understood. Here we show that cells in prefrontal cortex fire consistently within 100 ms after hippocampal cells in naturally sleeping animals. This provides evidence at the single cell-pair level for highly consistent directional interactions between these areas within the window of plasticity. Moreover, these interactions are state-dependent: they are driven by hippocampal sharp-wave/ripple (SWR) bursts in slow-wave sleep (SWS) and are sharply reduced during REM sleep. Finally, prefrontal responses are non-linear: as the strength of hippocampal bursts rises, short-latency prefrontal responses are augmented by increased spindle band activity and a secondary peak ~100 ms later. These findings suggest that SWR events serve as an atomic unit of hippocampal-prefrontal communication during SWS, and that the coupling between prefrontal and hippocampal areas is highly attenuated during REM sleep.
Introduction
Many lines of evidence have shown that the hippocampus is critical for the formation of long-term memories and that this hippocampal involvement is time-limited [1, 2, 3]. The predominant conjecture is that memories are gradually established across neocortical circuits under the influence of the hippocampus [4, 5]. This circuit reorganization is believed to result from coordinated activity between and within the hippocampus and the neocortex not only during awake behavior, but also during sleep [6, 7, 8, 9, 10]. Consistent with this conjecture, cortical and hippocampal networks remain highly active and plastic during sleep. One of the most striking features of mammalian sleep is the existence of discrete stages—slow-wave sleep (SWS) and rapid eye movement (REM) sleep—with different electrical and biochemical profiles. In particular, SWS and REM sleep differ drastically in the level of synchronous firing in the hippocampus (Fig. 1). Given the importance of synchrony and spike timing in synaptic plasticity, and given the putative role of sleep in learning and memory, a key open question is whether there exist consistent spike timing relationships across cortico-hippocampal circuits during sleep, and whether these differ in SWS versus REM sleep.
Figure 1. Hippocampal and prefrontal spiking activity during sleep.
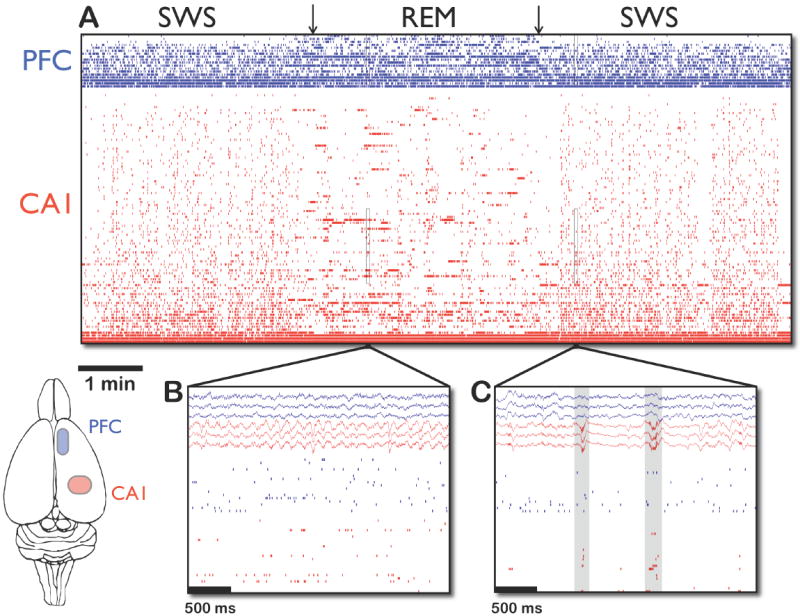
A: Spikes from 86 CA1 (red) and 18 mPFC (blue) simultaneously recorded units during approximately 11 minutes of sleep. Note the abrupt transition in CA1 between the vertical stripes of synchronous bursting during SWS to the horizontal stripes of theta-modulated firing in REM. B,C: Close-up views of REM and SWS, respectively, of the subsets of cells marked by rectangles in (A), as well as simultaneously recorded local field potentials. Note the prominent theta oscillations in the hippocampal (red) traces during REM (B) and the sharp-wave/ripple events with population bursts in SWS (C), marked by gray rectangles.
The hippocampal-prefrontal circuit is of particular interest given its importance in spatial and associative learning [11, 12], as well as the known interactions between the two areas during awake behavior [13, 14, 15] and sleep [7, 16]. Previous work has shown that hippocampal and prefrontal multi-unit activity are significantly correlated during SWS, with the hippocampus leading the prefrontal cortex [7, 16]. However, key questions remain open concerning the interactions between these areas: How common are directional interactions across prefrontal-hippocampal cell pairs? Is there diversity in their directionality, time lag, and strength? How are these interactions structured relative to prominent electrophysiological events in the sleeping brain, such as hippocampal ripples and neocortical spindles? Do they differ during SWS and REM sleep? The present study addresses these questions.
Results
Directionality in prefrontal-hippocampal spike timing relationships
In order to assess hippocampal-prefrontal timing relationships at the single cell-pair level during all stages of sleep, we used chronic multi-tetrode recordings to monitor the simultaneous activity of CA1 and medial prefrontal (mPFC) cells of freely behaving rats during long intervals of natural sleep (Fig. 1). We computed cross-covariances between all pairs of simultaneously recorded prefrontal and hippocampal single units (219 CA1, 76 mPFC cells). We restricted our analysis to putative pyramidal cells in the hippocampus (183 CA1 cells), using a mean firing rate criterion of less than 1 Hz, and we considered only pairs where the firing rates of both cells exceeded 0.05 Hz in SWS and REM (2779 total mPFC-CA1 pairs).
Figure 2 shows an example of the cross-covariances computed between one mPFC cell and all of the simultaneously recorded CA1 cells in one dataset during SWS and REM sleep. Each row in Figure 2(ii) represents the cross-covariance between the given mPFC cell and one CA1 cell as a function of lags ranging from -500 to 500 ms, where positive lags signify that prefrontal activity follows hippocampal activity.
Figure 2. State-dependent cross-covariances between single cells in the hippocampus and prefrontal cortex.
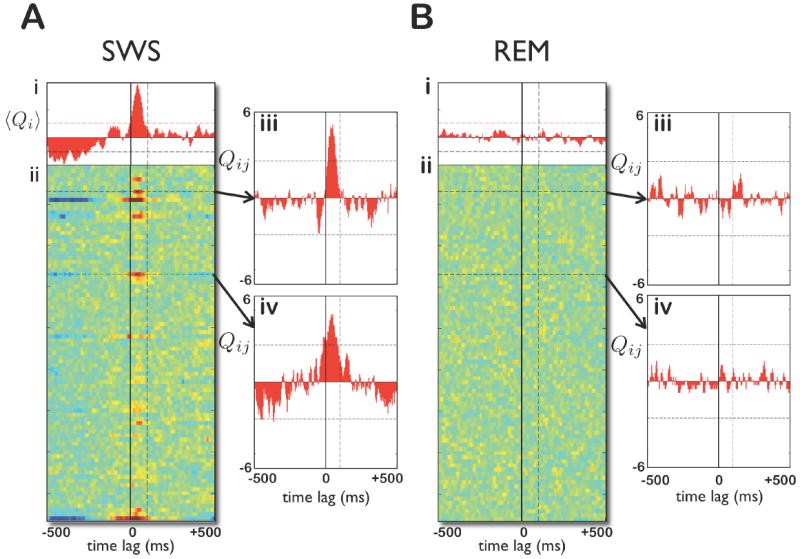
A: (i) The standardized mean cross-covariance between a single mPFC cell and all of the simultaneously recorded CA1 cells during SWS. Horizontal dashed lines indicate significance at the p = 0.01 level. (ii) Each row shows the standardized cross-covariance between the mPFC cell and a single CA1 cell. Note that several rows show high cross-covariances between 0 and 100ms (CA1 leads mPFC). (iii,iv) The rows marked by the horizontal dashed lines in (ii), showing two examples of prefrontal-hippocampal cell pairs with significant cross-covariance. B: (i-iv) The same cells and dataset as in (A) but during REM. Note the absence of significant cross-covariances in REM. The calculation of standardized and mean standardized cross-covariances is described in [13] (see also Methods).
We note three features from this example. First, several CA1 cells show significant positive cross-covariances during SWS (Fig. 2A(ii)), indicating that they tended to exhibit consistent spike timing relative to this prefrontal cell. Second, the significant cross-covariances have peaks at positive time lags, between 0-100 ms. This shows that this prefrontal cell tended to fire 0-100 ms after these hippocampal cells. Third, the same cell pairs with significant correlations in SWS are uncorrelated in REM sleep (Fig. 2B(ii)).
To test the generality of these observations, we computed all cross-covariances between mPFC cells and simultaneously recorded CA1 cells in both SWS and REM sleep across all datasets. First, we found that 11% (304 out of 2779) of prefrontal-hippocampal cell pairs were significantly correlated in SWS (false discovery rate of 1%; see Methods.) Second, we observed that, for these correlated cell pairs, the distribution of peak lags deviated from uniformity in several key respects. Prefrontal cells tended to fire after hippocampal cells for 70% of correlated cell pairs, a significant directional bias (p < 10-11, binomial test; Figure 3A(iii)). More specifically, prefrontal firing followed hippocampal firing by an average of 36 ms (n = 304; s.e.= 12 ms). The concentration of peak lags in the range of 0-100 ms (39% of pairs) was also highly significant (p < 10-20; binomial test).
Figure 3. Population analysis of state-dependent prefrontal-hippocampal interactions.
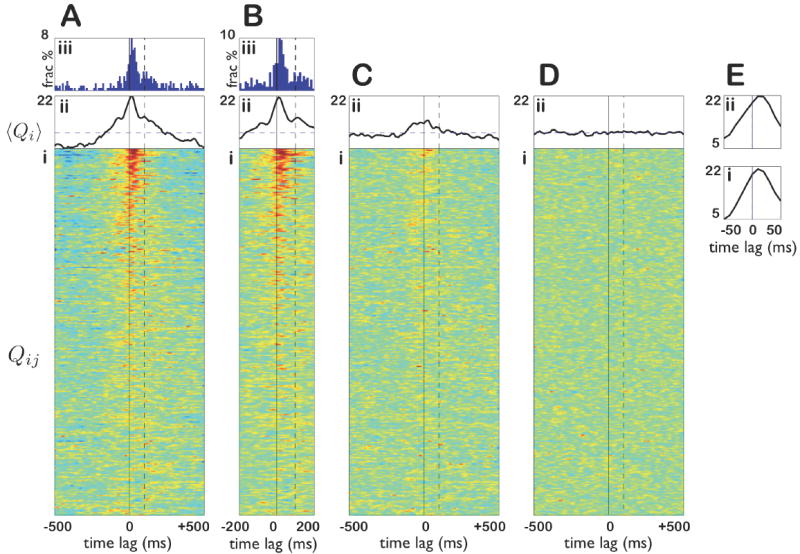
A: (i) Each row shows the standardized cross-covariance between a single mPFC and CA1 cell during SWS. Cell pairs are sorted from top to bottom by the significance of their cross-covariance (p values increasing from top to bottom). Only the top 304 rows out of 2779 pairs are shown, corresponding to the pairs deemed significant using a false discovery rate of q = 0.01. (ii) The standardized mean cross-covariance of the cell pairs in (i). (iii) Distribution of time lags of peak cross-covariance for significantly covarying pairs during SWS. Note the concentration between 0-100 ms. B: (i-iii) The same calculations as in A(i-iii) restricted to spikes that occur during sharp-wave/ripple (SWR) events. Cell pairs are shown in the same order as in A. Note the similarity of pairwise correlations (i), standardized mean cross-covariance (ii), and distribution of peak lags (iii). C: (i,ii) The same calculations as A(i,ii) restricted to spikes that occur during SWS outside of SWR events. Cell pairs are shown in the same order as A. Note the near-absence of significantly correlated pairs in (i) and substantial diminution in mean cross-covariance in (ii). D: The same calculations as A(i,ii) restricted to REM sleep. Note the absence of significant cross-covariance, either for individual cell pairs (i) or in the mean (ii). E: (i) and (ii) are zoomed in views of A(ii) and B(ii) respectively.
State-dependence of prefrontal-hippocampal spike timing
In order to understand better the origin of these correlations, we tested the hypothesis that they are driven by coordinated activity during hippocampal sharp-wave/ripple (SWR) events. We therefore computed cross-covariances using only the subset of spikes from both brain areas during ±250 ms windows around the center of SWR events (ripple band power > mean + 2 s.d.; see Methods). These subsets comprised 26% of overall SWS and contained 28% of prefrontal and 50% of hippocampal spikes, respectively. We found that 141 out of 304 pairs still showed significant cross-covariances (Fig. 3B) during this subset. In contrast, only 32 of the 304 showed significant cross-covariances when this subset of SWR-driven spikes was excluded from SWS (Fig. 3C). Focusing on the correlated cell pairs in SWS with peak lags between 0 and 100 ms, 78% (94/120) were also correlated in SWS restricted to SWR events, while only 14% (17/120) were correlated in SWS excluding SWR events.
We next addressed the question of whether the cell pairs that were significantly correlated in SWS also exhibited strong correlations during REM sleep. Surprisingly, we found that these significant prefrontal-hippocampal covariances were nearly abolished in REM sleep. In particular, only 3 of the cell pairs that were significantly correlated in SWS showed significant correlations during REM sleep (Fig. 3D). Finally, only 19 out of all 2779 pairs showed significant correlations in REM sleep. The restriction of prefrontal-hippocampal interactions to discrete episodes during SWR events is also apparent in the time evolution of the short-term cross-covariance of mPFC and CA1 multi-unit activity (Fig. 4).
Figure 4. Illustration of discrete interactions between mPFC and CA1 across sleep stages.
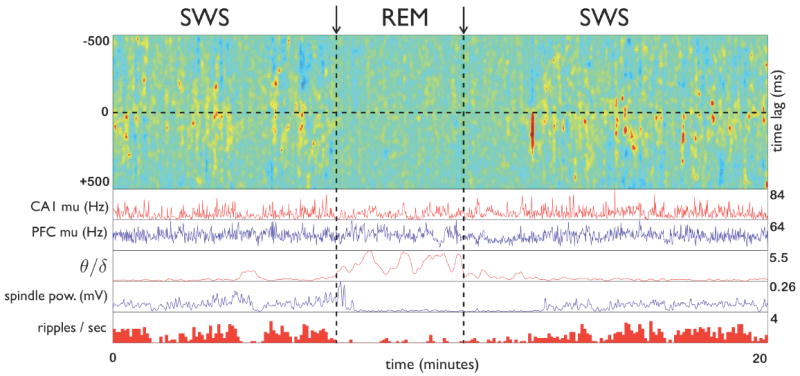
The top panel shows the standardized cross covariance over rolling 5 second windows between prefrontal and hippocampal multiunit activity for a 20 minute segment of sleep that includes a transition from SWS to REM sleep and back. From top to bottom, other panels show: the multiunit firing rates in CA1 and mPFC respectively, in 1 sec bins smoothed over 5 bins; the ratio of theta to delta amplitudes in the hippocampal local field, indicating the onset of REM sleep; the amplitude of the prefrontal local field filtered in the spindle band (7–15 Hz); and the density of sharp-wave/ripple events in 5 second bins. Theta, delta, and spindle band amplitudes were computed using the Hilbert transform of the local field filtered in the appropriate band. Hot colors in the top panel indicate episodes of higher cross-covariance. Note that these hot spots are short, strongly biased to positive lags (CA1 leads prefrontal cortex), and restricted to SWS. Meanwhile, spindle power and ripple density diminish greatly during REM, while mean firing rates in CA1 and mPFC do not.
Detecting correlations depends on the number of events, and rats spend 7-8 times longer in SWS than in REM sleep. We therefore examined whether the absence of significant correlation during REM might be due to this imbalance. First, we verified that firing rates during REM sleep and SWS do not differ grossly, neither on the whole (Fig. 5) nor for cell pairs that are significantly correlated in SWS in particular (Fig. 5, red points). Second, we computed all cross-covariances during SWS using randomly drawn subsets of SWS of the same duration as REM sleep (Fig. S1). We then confirmed that the significant covariances identified by analyzing all of SWS (Fig. 3A(i)) are still apparent when using REM-sized subsets of SWS (Fig. S1A(i)), and these differ significantly from the scarcity of correlations observed during REM sleep (Fig. S1A(ii)). As additional verification that SWS and REM differ in their overall short-term correlation structure, for each cell pair we counted the number of prefrontal spikes arriving within 0-100 ms of a CA1 spike and found significantly higher standardized counts in SWS compared to REM (p < 10-15, paired t-test; see Methods).
Figure 5. Mean firing rates across SWS and REM sleep.
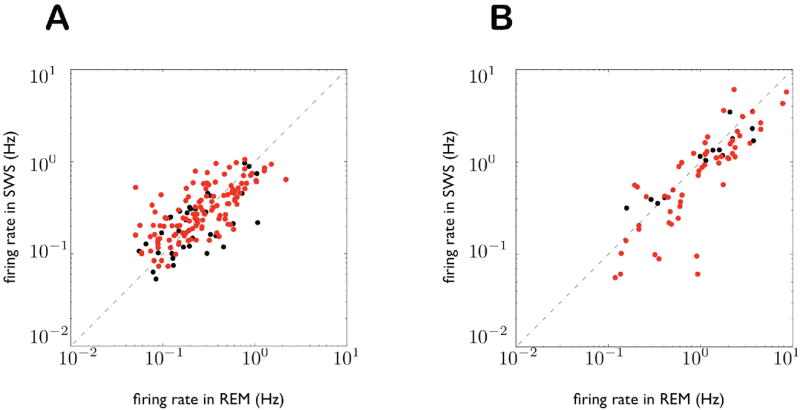
A: Scatter plot of firing rates in REM and SWS for all 183 CA1 pyramidal cells used in the analysis. The diagonal represents equal firing rates in SWS and REM. Each point is one cell; red points are cells that are significantly correlated with one or more cells in the other brain region. Note that deviations from the diagonal are much smaller than the variation in firing rates across cells. CA1 firing rates in REM and SWS are significantly correlated (ρ = 0.66; least-squares slope of SWS versus REM = 0.74). B: Same as (A) for all mPFC cells (ρ = 0.86; least squares slope = 0.70).
To measure the prevalence of significant correlations at the level of single cells, as opposed to cell pairs, and to verify that our results were not driven by a handful of highly interacting cells, we computed a functional connectivity matrix between mPFC and CA1 for all datasets, including every cell used in this study (Figure 6). We defined the interaction rate of a cell as the fraction of cells in the other brain area with which it is significantly correlated. Interaction rates show a continuum of values in both brain regions, with median values of 10% and 7% for hippocampal and prefrontal units respectively. Moreover, interaction matrices (Fig. 6A) show that the significant interactions are distributed widely (though not uniformly) across cells in both brain regions and not dominated by a few cells in either region.
Figure 6. Incidence of prefrontal-hippocampal interactions during SWS.
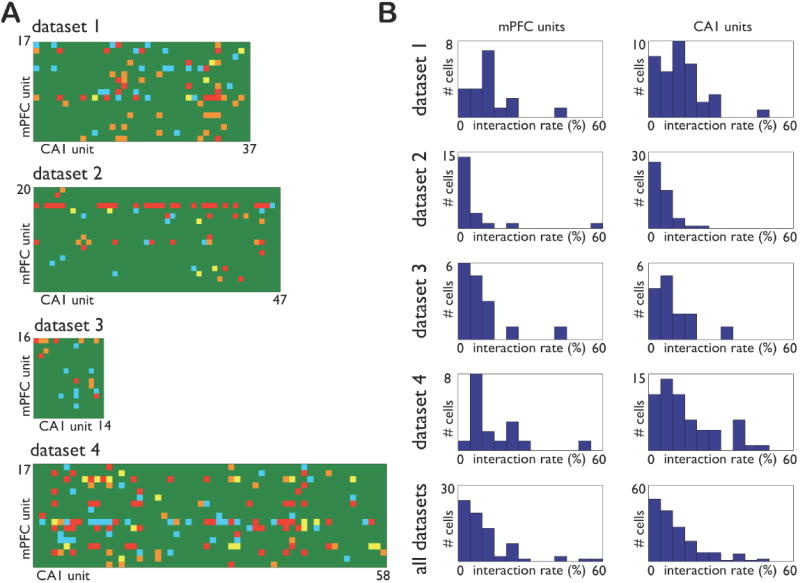
A: Matrix of cross-covariances between all mPFC and CA1 units. For each dataset, the color of the square in row i and column j summarizes the cross-covariance between mPFC unit i and CA1 unit j over lags from -500 to 500 ms during SWS. Green indicates no significant cross-covariance at any lag. The remaining colors indicate significant cross-covariance at the following peak lag: red, 0 to 70 ms; yellow, 70 to 130 ms; orange, 130 to 500 ms; blue, -500 to 0 ms. B: For each single unit in one brain area, we define its interaction rate as the fraction of cells in the other brain area with which it has significant cross-covariance between -500 and 500 ms. The distribution of interaction rates for each dataset and the population are summarized in histograms in the left (mPFC) and right (CA1) columns. At the population level, the median interaction rates are 7% and 10% for mPFC and CA1, respectively.
Biphasic structure of prefrontal responses
Finally, we investigated the fine temporal structure of prefrontal responses to the firing of pyramidal cells in the hippocampus. Consistent with the result that significantly correlated prefrontal cells fire in a tight window after hippocampal cells, the aggregate cross-covariance of the 304 significantly correlated cell pairs (Figs. 3, 7A(ii), red) shows a single peak at approximately 10 ms. Surprisingly, the aggregate cross-covariance of all 2779 cell pairs shows two peaks: the first at 10 ms and a second prominent peak at approximately 100 ms (Fig. 7A(i), gray). Consistent with this observation, the aggregate cross-covariance of all but the 304 most correlated pairs reveals the second peak at 100 ms but not the first (Fig. 7A(ii), black). Thus, the prefrontal response to hippocampal SWR events consists of two phases: a few highly correlated cell pairs at short latency followed by many cell pairs with weak but coherent interactions 100 ms later. These latter interactions at 100 ms are not statistically significant for individual cell pairs (Fig. 7A(iii), black) but their aggregate cross-covariance is.
Figure 7. Multi-phase prefrontal response to hippocampal spiking.
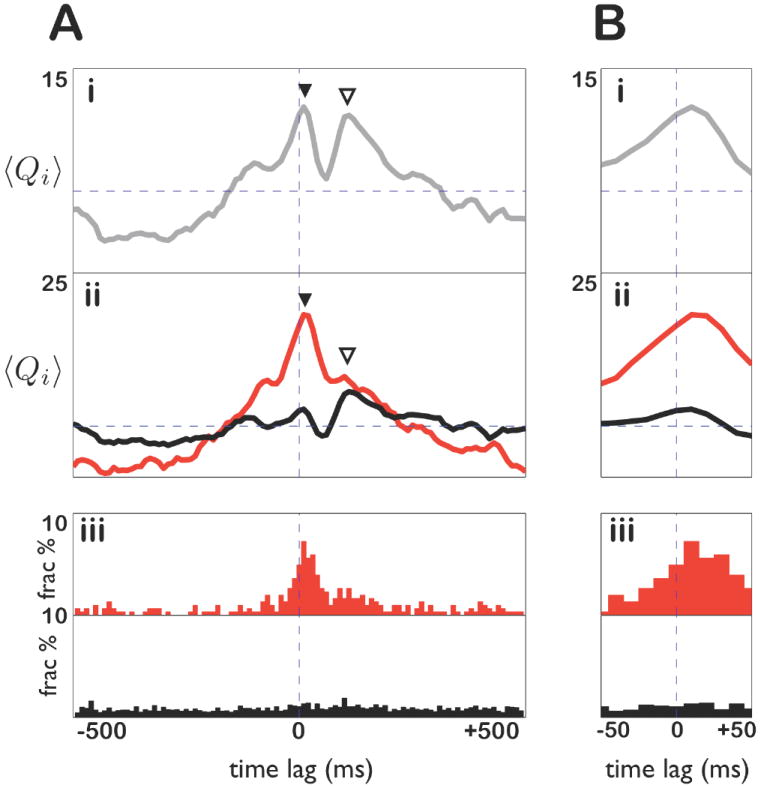
A: Mean standardized cross-covariance between prefrontal and hippocampal cells for: (i) all cell pairs; (ii) The 304 significantly correlated pairs (red) and all remaining pairs (black). Note the early peak in the red curve (▼), the late peak in the black curve (▽), and both peaks in (i). (iii) Distribution of peak lags in cross-covariances of the 304 significantly correlated pairs (red) and all other pairs (black). Note that the early peak in cross-covariance (▼) is matched by a core of strongly correlated cell pairs with peak lags at the same time (red histogram). By contrast, the distribution of peak lags for weakly correlated cell pairs is flat (black histogram). B: (i-iii) Zoomed-in views of A(i-iii) respectively.
Next, we tested the hypothesis that the form of the prefrontal response to hippocampal bursts depends on the strength of the excitatory drive from the hippocampus. To study this question, we used multi-unit spiking activity to identify hippocampal bursts (see Methods). We then sorted all bursts in order of their strength, measured as the total number of spikes in the burst divided by the number of CA1 cells in the dataset (Fig. 8A(i)), and plotted the corresponding multi-unit prefrontal response to each burst (Fig. 8B(i)). This arrangement reveals a systematic change in the prefrontal response: smaller hippocampal bursts lead to a single-peaked, short-latency prefrontal response, while sufficiently large hippocampal bursts lead to an additional prefrontal response 100 ms later. These more powerful hippocampal bursts are associated with significantly higher power in the spindle band of prefrontal LFPs, consistent with increased spindle activity surrounding these events. Moreover, this increase in spindle power is significantly biased after the onset of these events (Fig. 8C). While stronger hippocampal bursts lead to increasingly asymmetric prefrontal spiking, in the form of a second peak (Fig 8B), the hippocampal bursts themselves show no such trend (Fig. 8A(ii)). This argues that the second peak is not simply due to asymmetric hippocampal drive, and suggests instead that it emerges from spindle band activity within sufficiently excited cortical or cortico-thalamic circuits, as supported by Figure 8C. We note that for one of the datasets, the aggregate prefrontal response to hippocampal bursts also grew with burst strength but with an opposite, inhibitory sign, and without a secondary peak (Fig. S3).
Figure 8. Prefrontal and hippocampal responses to hippocampal bursts as a function of burst strength.
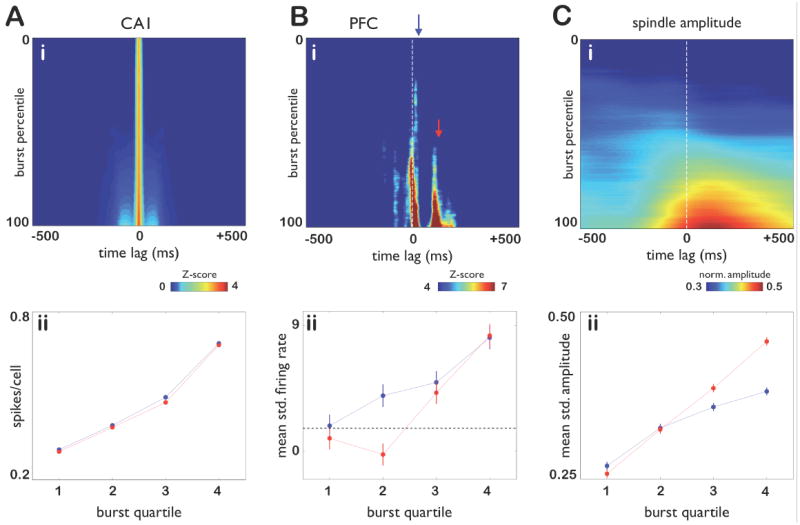
A: (i) Each row is the multi-unit firing rate of CA1 pyramidal cells triggered by a hippocampal burst event at t = 0; all multi-unit rates are computed using 5 ms bins and smoothed with a σ = 17 ms window, then converted to Z scores. Rows are sorted from top to bottom in order of increasing burst size, defined as the mean multiunit CA1 firing rate, divided by the number of cells in each dataset, integrated between -100 and 100 ms around the peak of the burst, and converted to a percentile for each dataset. Rows are averaged using a rolling 20000 trial window. (ii) Mean hippocampal firing in the 500 ms interval before (blue) and after (red) the center of each burst. Note that hippocampal firing is nearly symmetric in time around bursts. B: (i) Prefrontal responses to the corresponding hippocampal bursts in A(i) displayed in the same manner. Blue and red arrows indicate the onsets of the first (0–30 ms) and second (80–110 ms) peaks, respectively, of the prefrontal response. Note that the short first peak arises even for weaker hippocampal bursts while the second peak only emerges in response to hippocampal bursts of sufficient strength (red arrow). (ii) Mean standardized prefrontal firing at the first (blue) and second (red) peaks. The dashed line indicates the one-sided p = 0.05 significance level. Note that the first peak is significant for all four quartiles while the second becomes significant only for the third and fourth quartiles of bursts. C: (i) Mean standardized amplitude of spindle band activity in the prefrontal cortex for each of the bursts in A(i) (see Methods). (ii) Mean standardized spindle band amplitude in the 500 ms interval before (red) and after (blue) the center of each burst. Vertical bars indicate one standard error of the mean. Note that spindle power increases significantly with the size of hippocampal bursts (p < 0.01 for each quartile; unpaired t-test). In addition, for hippocampal bursts of sufficient size, spindle power becomes directional, with post-burst spindle power significantly exceeding pre-burst levels (p < 5 × 10⁻³; p < 7 × 10⁻¹², in Q3 and Q4 respectively; unpaired t-test).
Discussion
These results demonstrate the existence of consistent spike timing relationships between the hippocampus and the neocortex within the window of plasticity during sleep that can be detected at the single cell-pair level. Previous work has shown monosynaptic projections from CA1 to mPFC [17] that are excitatory [18] and plastic [19]. Combined with these studies, our results show in a naturally sleeping animal that the hippocampus and mPFC satisfy two major requirements of activity-dependent plasticity mechanisms as they are currently understood: synaptic contact and consistent spike timing.
In addition to plasticity at CA1-mPFC synapses, the combination of population bursts in CA1 and consistent CA1-mPFC spike timing could lead to precise timing in cortico-cortical networks within the window of plasticity, perhaps under the additional organizing influence of contemporaneous cortical spindles [7, 16]. Such hippocampus driven reorganization of cortical circuits is a key building block of current models of memory consolidation. The potential link between prefrontal-hippocampal interactions and systems-level consolidation is further strengthened by evidence that the mPFC is differentially activated [20] and required [12] for the recall of remote, but not recent, hippocampus-dependent memories.
A critical parameter for any theory of memory consolidation is the direction of signal flow during sleep, namely, whether the hippocampus leads the neocortex or vice-versa. In particular, a prominent model of memory consolidation requires evidence for information flow from the hippocampus to the neocortex during sleep [21]. Our data provide a clear answer at the single cell-pair level, at least for mPFC and area CA1, to this key question, on time scales relevant to synaptic plasticity.
Over longer time scales, recent studies have found that neocortical activity, in turn, can bias the timing of SWR events relative to cortical “slow” oscillations (0.5-1.5 Hz) or up and down states [16, 22, 23, 24, 25, 26, 27]. Because of the differences in time scales (tens versus hundreds of milliseconds), these results are not inherently incompatible with those presented here. Taken together, they are consistent with a hippocampal-prefrontal dialog over many time scales [26, 28]. In addition, the current results may be specific to the CA1-mPFC circuit, and the timing of cortico-hippocampal interactions may differ in other cortical areas [26]. Studying these differences in multiple cortical areas using the experimental and analysis framework presented here could substantially enrich our understanding of how hippocampal activity effects circuit-level changes across the neocortex.
A unitary role for hippocampal population bursts in memory consolidation has been previously proposed based on their ability to drive cortical targets and engage plasticity mechanisms [29]. Our data confirm the critical importance of these population events for establishing consistent lead-lag relationships between hippocampal and prefrontal unit activity during sleep. Moreover, our results identify a non-linear relationship between the magnitude of hippocampal bursts and the patterning of the prefrontal response, with more potent bursts leading to biphasic cortical responses and an increase in spindle band activity after the burst. Thus, while SWR bursts are unitary events in the hippocampus, variations in their strengths lead to qualitatively different cortical responses that may serve different functions.
In one of the four datasets we found a low-latency prefrontal response that grew with burst strength but with an inhibitory sign (Fig. S3). A possible explanation for this difference is that this dataset samples disproportionately from prefrontal cells receiving inhibitory input from other prefrontal units that are highly correlated with hippocampal cells [30]. In this case one would expect an aggregate prefrontal response resembling that of correlated cell pairs (Fig. 7A(ii), red curve) but with an opposite sign. This hypothesis could also explain the absence of a secondary response around t = 100 ms for this dataset. Despite this difference in aggregate prefrontal response, the incidence of correlated cell pairs and their characteristics are not atypical of the other three (Fig. 6).
Given the relatively short duration of REM sleep, its resemblance to the awake state in the hippocampus, and its association with dreaming, the function of REM sleep has been a persistent mystery, and its possible role in memory formation has been a longstanding controversy [8, 9]. This study identifies a major distinction in cortico-hippocampal interactions between SWS and REM sleep. Computational theories of memory consolidation have identified the needs both for gradual transfer of memory traces from the hippocampus to the neocortex [31] as well as reorganization of the memory traces themselves driven by intrinsic activity rather than external input [10, 32, 33, 34]. The former requires concerted activity in the hippocampus and neocortex; by contrast, the latter benefits from a functional disconnection of the two brain areas. One possibility consistent with our findings, therefore, is that these two needs—transfer and reorganization—are met by SWS and REM sleep, respectively. We note the possibility that although correlated cell pairs in REM sleep are rare, both overall and relative to SWS, they may play an important role in memory consolidation. Nevertheless, we speculate that the scarcity of coordinated cortico-hippocampal spiking during REM sleep may explain why the awake-like neural activity in prefrontal cortex during REM does not interact strongly with the hippocampus and therefore why dreams are, on the whole, forgotten.
Experimental Procedures
Electrophysiological recordings
Electrophysiological signals were acquired using tetrode recordings [35]. Three male Long-Evans rats from 3-5 months old (weight = 350-450g) were implanted with a custom-built microdrive array allowing the independent adjustment of 24 individual tetrodes and four single-channeled reference electrodes. Twelve tetrodes targeted the prelimbic and infralimbic regions of the mPFC (AP: 1.5-3.5mm from bregma; ML: 1-1.75mm, angled at 15 degrees from the saggital plane) and twelve tetrodes targeted the dorsal CA1 subfield of the hippocampus (AP: -3.75 to -4.75mm from bregma; ML: 1.5-3.5mm). Individual tetrodes were gradually lowered to their targets over several days and further microadjusted to optimize yield and stability. Each tetrode signal was buffered by a unity-gain headstage preamplifier and further differentially amplified with a gain of 2000. The broadband amplified signals were digitally acquired at 25KHz as 24-bit samples (National Instruments PXI-4472) and stored to disk using custom acquisition software that we have developed. A skull screw above the ipsilateral cerebellum served as an electrical reference for all signals. Three light-emitting diodes were fixed to the top of the microdrive array to allow tracking of the animal’s position from video recordings. Each frame of video was time-stamped by the acquisition system in order to synchronize position and neuronal data. All recordings were conducted immediately after the animal had performed a variety of spatial tasks (linear track traversal, T-maze) in a sleep box that was highly familiar to the animal. All animal procedures were done in accordance with NIH guidelines and with approval of the Caltech Institutional Animal Care and Use Committee.
Sleep sessions
Sleep sessions lasted several hours (n = 4 sessions, 222±19 min; range = 166 to 246 min) and contained multiple SWS and REM epochs, with a total of nearly one half-hour per session spent in REM sleep (n = 4, 29±3 min; range = 23 to 38 min) and the rest in SWS. We concatenated all SWS and REM episodes to create aggregate SWS and REM epochs for each sleep session.
Spike and local field analysis
Spikes and LFP traces were obtained by digitally filtering the broadband signal. For spikes, a bandpass filter was designed using the Parks-McClellan algorithm with transition bands of 500-600Hz and 6000-6100Hz and maximal ripple of 10-5 in the stopband and 10-3 in the passband. LFPs were computed by downsampling the broadband signal by a factor of 12 in three stages (2,2,3); each stage used a 500-tap FIR linear-phase lowpass filter designed using the window method. Spikes were clustered into single units on the basis of their amplitudes recorded on each of the four tetrode channels.
Sleep stage identification
Sleep sessions were segmented into periods of SWS and REM using custom software on the basis of three physiological criteria: (1) muscle tone, recorded from a bipolar EMG electrode in the animal’s neck and bandpass-filtered to 100-300Hz; (2) theta power; (3) the ratio of delta / theta power. Theta and delta power were measured by computing the energy of a selected hippocampal LFP in the theta (4-10Hz) and delta frequency bands (0.5-2Hz), respectively. Plotting these three features over the course of sleep typically reveals two clusters whose boundary can be cleanly selected by the user. One cluster of relatively low muscle tone, high theta, and low delta / theta power was designated as REM; the remainder was designated as SWS. REM sleep segments separated by less than 10 seconds were merged into one; following this step, putative REM sleep segments shorter than 30 seconds were eliminated. Brief periods of awake behavior during sleep sessions were identified by thresholding the speed of the animal using position data and removed from the analysis.
Cross-covariance analysis
Cross-covariances between two cells were first computed as raw spike counts using 10 ms bins. These counts were then normalized to unit normal Z-scores at each lag; this computation is described in [13] as a standardized cross-covariance. This standardized cross-covariance was smoothed using a 3-bin boxcar centered around 0. The average cross-covariance between multiple cell pairs was computed by summing the standardized cross-covariances between all of the pairs and dividing by the square-root of the number of pairs. This computation is described in [13] as the standardized mean cross-covariance. For a given cell pair (i, j) we defined the peak lag time τij as the time bin of maximal cross-covariance, and the peak value Cij as the median of the cross-covariance at the peak lag and neighboring ±3 bins. This peak value was used as the test statistic for the interaction strength of cell pair(i, j). To convert Cij to a p value (i.e., to find a cumulative density function for Cij), we used one of two Monte-Carlo estimates for each cell pair depending on the value of λ = TΔtRiRj, where T is the total length of the dataset in seconds, Δt is the bin size in seconds, and Ri, j are the mean firing rates of cells i and j in spikes per second. Under the null hypothesis of independent Poisson spiking, λ is the intensity of the Poisson process governing the number of spikes in a given bin of the cross-covariance histogram. When λ > 10, the Poisson process can be approximated with a normal distribution and each bin of the standardized cross-covariance will be distributed as a unit normal. To compute the effect of the smoothing and median filtering that goes into the computation of Cij, we generated 107 101-dimensional vectors of unit normals and computed peak values for each, as defined above, to build an empirical distribution of Cij. The dimensionality of the vectors comes from the number of 10 ms histogram bins centered at 0, ±10, ±20, …, ±500 ms. The empirical distribution of Cij could be approximated very closely by a Gaussian with and . When λ < 10, the normal approximation is invalid; for these cases we generated 108 101-dimensional vectors with values , where J is Poisson with intensity λ.
Multiple Comparison Corrections
In order to manage Type I error in the face of multiple comparisons while maintaining statistical power, we used the false discovery rate (FDR) framework [36] to compute a single p value threshold for all individual cell pairs such that the expected number of false positives as a function of all positives is a desired fraction q . Because of the dependencies, both positive and negative, between cell pairs, we used a version of FDR that does not assume independence nor positive dependence between tests [37]. In all of this work, we use q = 0.01. This criterion led to p values for individual tests of 1.3 × 10⁻⁴ for SWS and 7.9 × 10⁻⁶ for REM sleep.
Population tests of interactions across sleep stages
To compare the cross-covariance of all prefrontal and hippocampal cell pairs over short timescales across SWS and REM, for each cell pair (i, j) we computed , defined as the number of prefrontal spikes from prefrontal unit i falling 0-100 ms after hippocampal unit j during sleep stage m, where m = (1,2) for SWS and REM, respectively. Under the null hypothesis of independent Poisson firing, is Poisson with intensity , where is the total number of spikes from the hippocampal unit i (or prefrontal unit j) in sleep stage m, T(m) is the duration of sleep stage m, and Δt = 100 ms. Because for all pairs, we used the normal approximation to the Poisson to create standardized counts ; under the null hypothesis, are standard normal variables. We then compared the samples to using a paired t-test.
Sharp-wave/Ripple (SWR) event identification
For each CA1 tetrode, we filtered the broadband signals between 80-250 Hz using Parks-McClellan FIR filters, and extracted the instantaneous amplitude and phase of the filtered signals using the Hilbert transform. We identified candidate events as deviations in the amplitudes of the filtered traces that exceeded a threshold set as the mean plus twice the standard deviation. Candidate events separated by less than 15 ms were merged. From the remaining events, we identified ripples as candidate events that exceeded 20 ms in duration and that were consistently detected across multiple CA1 tetrodes (average amplitude from all CA1 tetrodes exceeding 30 μV).
Hippocampal burst analysis
Hippocampal bursts were identified by using the peaks of the mean multi-unit firing rate, rH(t), which was computed by binning the multi-unit activity of putative CA1 pyramidal cells in 5 ms bins, smoothing the counts with a Gaussian window with 3σ = 50 ms, and dividing by the number of single units. The peaks of the resulting time series, t̂i, were identified as local maxima with amplitudes at least two standard deviations above the mean. Each row of Figure 8A was computed by sorting bursts by their spiking integrated ±100 ms around their peak value, in ascending order, extracting rH(t) at intervals to form each row, and standardizing each row by subtracting its mean and dividing by its standard deviation. Each row of Figure 8B was computed in the same way as A, substituting mPFC firing for CA1, but using the same time intervals Ti. Finally, spindle amplitudes in Figure 8C were computed by filtering the LFP signal from a selected prefrontal tetrode in each dataset in the spindle band (7 to 15 Hz) using Parks-McClellan FIR filters, calculating the magnitude of its Hilbert transform, and smoothing the resulting envelope with a Gaussian window with 3σ = 120 ms. To enable comparison across datasets, the envelopes were normalized by subtracting their means and dividing by their standard deviations. Each row of Figure 8C corresponds to the same time intervals Ti as in panels A and B.
Supplementary Material
Acknowledgments
We are grateful to Mark Konishi, Gilles Laurent, Pietro Perona, Erin Schuman, Georg Seelig, and Andreas Tolias for many useful discussions and comments on the manuscript. This work was supported by a Department of Defense National Defense Science and Engineering Graduate Fellowship (C.W.), the Caltech IST Center for Biological Circuits Design, the James S. McDonnell Foundation, the Bren Foundation, the McKnight Foundation, the Whitehall Foundation, and NIH.
Footnotes
Publisher's Disclaimer: This is a PDF file of an unedited manuscript that has been accepted for publication. As a service to our customers we are providing this early version of the manuscript. The manuscript will undergo copyediting, typesetting, and review of the resulting proof before it is published in its final citable form. Please note that during the production process errors may be discovered which could affect the content, and all legal disclaimers that apply to the journal pertain.
References
- 1.Squire LR. Memory and the hippocampus: A synthesis from findings with rats, monkeys, and humans. Psychological Review. 1992;99(2):195–231. doi: 10.1037/0033-295x.99.2.195. [DOI] [PubMed] [Google Scholar]
- 2.Kim JJ, Fanselow MS. Modality-specific retrograde amnesia of fear. Science. 1992;256:675–677. doi: 10.1126/science.1585183. [DOI] [PubMed] [Google Scholar]
- 3.Kim JJ, Clark RE, Thompson RF. Hippocampectomy impairs the memory of recently, but not remotely acquired trace eyeblink conditioned responses. Behav Neurosci. 1995;109:195–203. doi: 10.1037//0735-7044.109.2.195. [DOI] [PubMed] [Google Scholar]
- 4.Buzsáki G. The hippocampo-neocortial dialogue. Cerebral Cortex. 1996;6:81–92. doi: 10.1093/cercor/6.2.81. [DOI] [PubMed] [Google Scholar]
- 5.Eichenbaum H. A cortical-hippocampal system for declarative memory. Nat Rev Neurosci. 2000;1:41–50. doi: 10.1038/35036213. [DOI] [PubMed] [Google Scholar]
- 6.Wilson MA, McNaughton BL. Reactivation of hippocampal ensemble memories during sleep. Science. 1994;265:676–679. doi: 10.1126/science.8036517. [DOI] [PubMed] [Google Scholar]
- 7.Siapas AG, Wilson MA. Coordinated interactions between hippocampal ripples and cortical spindles during slow-wave sleep. Neuron. 1998;21:1123–1128. doi: 10.1016/s0896-6273(00)80629-7. [DOI] [PubMed] [Google Scholar]
- 8.Stickgold R, Hobson JA, Fosse R, Fosse M. Sleep, learning, and dreams: Offline memory reprocessing. Science. 2001;294:1052–1057. doi: 10.1126/science.1063530. [DOI] [PubMed] [Google Scholar]
- 9.Siegel JM. The REM sleep-memory consolidation hypothesis. Science. 2001;294:1058–1063. doi: 10.1126/science.1063049. [DOI] [PMC free article] [PubMed] [Google Scholar]
- 10.Lubenov EV, Siapas AG. Decoupling through synchrony in neuronal circuits with propagation delays. Neuron. 2008;58:118–131. doi: 10.1016/j.neuron.2008.01.036. [DOI] [PubMed] [Google Scholar]
- 11.Floresco SB, Seamans JK, Philips AG. Selective roles for hippocampal, prefrontal cortical, and ventral striatal circuits in radial-arm maze tasks with or without a delay. J Neurosci. 1997;17(5):1880–1890. doi: 10.1523/JNEUROSCI.17-05-01880.1997. [DOI] [PMC free article] [PubMed] [Google Scholar]
- 12.Takehara K, Kawahara S, Kirino Y. Time-dependent reorganization of the brain components underlying memory retention in trace eyeblink conditioning. J Neurosci. 2003;23(30):9897–9905. doi: 10.1523/JNEUROSCI.23-30-09897.2003. [DOI] [PMC free article] [PubMed] [Google Scholar]
- 13.Siapas AG, Lubenov EV, Wilson MA. Prefrontal phase-locking to hippocampal theta oscillations. Neuron. 2005;46:141–151. doi: 10.1016/j.neuron.2005.02.028. [DOI] [PubMed] [Google Scholar]
- 14.Hyman JM, Zilli EA, Paley AM, Hasselmo ME. Medial prefrontal cortex cells show dynamic modulation with the hippocampal theta rhythm dependent on behavior. Hippocampus. 2005;15:739–749. doi: 10.1002/hipo.20106. [DOI] [PubMed] [Google Scholar]
- 15.Jones MW, Wilson MA. Theta rhythms coordinate hippocampal-prefrontal interactions in a spatial memory task. PLoS Biol. 2005;3:e402. doi: 10.1371/journal.pbio.0030402. [DOI] [PMC free article] [PubMed] [Google Scholar]
- 16.Mölle M, Yeshenko O, Marshall L, Sara SJ, Born J. Hippocampal sharp waveripples linked to slow oscillations in rat slow-wave sleep. J Neurophysiol. 2006;96:62–70. doi: 10.1152/jn.00014.2006. [DOI] [PubMed] [Google Scholar]
- 17.Swanson LW. A direct projection from ammon’s horn to prefrontal cortex in the rat. Brain Res. 1981;217:150–154. doi: 10.1016/0006-8993(81)90192-x. [DOI] [PubMed] [Google Scholar]
- 18.Thierry AM, Gioanni Y, Dégenètais E. Hippocampo-prefrontal cortex pathway: anatomical and electrophysiological characteristics. Hippocampus. 2000;10:411–419. doi: 10.1002/1098-1063(2000)10:4<411::AID-HIPO7>3.0.CO;2-A. [DOI] [PubMed] [Google Scholar]
- 19.Laroche S, Davis S, Jay TM. Plasticity at hippocampal to prefrontal cortex synapses: dual roles in working memory and consolidation. Hippocampus. 2000;10:438–446. doi: 10.1002/1098-1063(2000)10:4<438::AID-HIPO10>3.0.CO;2-3. [DOI] [PubMed] [Google Scholar]
- 20.Maviel T, Durkin TP, Menzaghi F, Bontempi B. Sites of neocortical reorganization critical for remote spatial memory. Science. 2004;305:96–99. doi: 10.1126/science.1098180. [DOI] [PubMed] [Google Scholar]
- 21.Tononi G, Massimini M, Riedner B. Sleepy dialogues between cortex and hippocampus: Who talks to whom? Neuron. 2006;52:748–749. doi: 10.1016/j.neuron.2006.11.014. [DOI] [PubMed] [Google Scholar]
- 22.Hahn TTG, Sakmann B, Mehta MR. Differential responses of hippocampal subfields to cortical up-down states. PNAS. 2007;104:5169–5174. doi: 10.1073/pnas.0700222104. [DOI] [PMC free article] [PubMed] [Google Scholar]
- 23.Hahn TTG, Sakmann B, Mehta MR. Phase-locking of hippocampal interneurons’ membrane potential to neocortical up-down states. Nature Neurosci. 2006;9:1359–1361. doi: 10.1038/nn1788. [DOI] [PubMed] [Google Scholar]
- 24.Isomura Y, Sirota A, Özen S, Montgomery S, Mizuseki K, Henze DA, Buzsáki Integration and segregation of activity in entorhinal-hippocampal subregions by neocortical slow oscillations. Neuron. 2006;52:871–882. doi: 10.1016/j.neuron.2006.10.023. [DOI] [PubMed] [Google Scholar]
- 25.Battaglia FP, Sutherland GR, McNaughton BL. Hippocampal sharp wave bursts coincide with neocortical “up-state” transitions. Learning & Memory. 2004;11:697–704. doi: 10.1101/lm.73504. [DOI] [PMC free article] [PubMed] [Google Scholar]
- 26.Sirota A, Csicsvari J, Buhl D, Buzsáki G. Communication between neocortex and hippocampus during sleep in rodents. PNAS. 2003;100:2065–2069. doi: 10.1073/pnas.0437938100. [DOI] [PMC free article] [PubMed] [Google Scholar]
- 27.Ji D, Wilson MA. Coordinated memory replay in the visual cortex and hippocampus during sleep. Nature Neurosci. 2007;10(1):100–107. doi: 10.1038/nn1825. [DOI] [PubMed] [Google Scholar]
- 28.Marshall L, Born J. The contribution of sleep to hippocampus-dependent memory consolidation. Trends Cogn Sci. 2007;11(10):442–50. doi: 10.1016/j.tics.2007.09.001. [DOI] [PubMed] [Google Scholar]
- 29.Chrobak JJ, Buzsáki G. High-frequency oscillations in the output networks of the hippocampal-entorhinal axis of the freely behaving rat. J Neurosci. 1996;16:3056–3066. doi: 10.1523/JNEUROSCI.16-09-03056.1996. [DOI] [PMC free article] [PubMed] [Google Scholar]
- 30.Tierney PL, Dégenètais E, Thierry AM, Glowinski J, Gioanni Y. Influence of the hippocampus on interneurons of the rat prefrontal cortex. Eur J Neurosci. 2004;20:514–524. doi: 10.1111/j.1460-9568.2004.03501.x. [DOI] [PubMed] [Google Scholar]
- 31.McClelland JL, McNaughton BL, O’Reilly RC. Why there are complementary learning systems in the hippocampus and neocortex: insights from the successes and failures of connectionist models of learning and memory. Psychol Rev. 1995;102:419–457. doi: 10.1037/0033-295X.102.3.419. [DOI] [PubMed] [Google Scholar]
- 32.Crick F, Mitchison G. The function of dream sleep. Nature. 1983;304:111–114. doi: 10.1038/304111a0. [DOI] [PubMed] [Google Scholar]
- 33.Hopfield JJ, Feinstein DI, Palmer RG. Unlearning has a stabilizing effect on collective memories. Nature. 1983;304:158–159. doi: 10.1038/304158a0. [DOI] [PubMed] [Google Scholar]
- 34.Ackley DH, Hinton GE, Sejnowski TJ. A learning algorithm for Boltzmann machines. Cognitive Science. 1985;9:147–169. [Google Scholar]
- 35.Wilson MA, McNaughton BL. Dynamics of the hippocampal ensemble code for space. Science. 1993;261:1055–1058. doi: 10.1126/science.8351520. [DOI] [PubMed] [Google Scholar]
- 36.Benjamini Y, Hochberg Y. Controlling the false discovery rate: a practical and powerful approach to multiple testing. J R Statist Soc B. 1995;57(1):289–300. [Google Scholar]
- 37.Benjamini Y, Yekutieli D. The control of the false discovery rate in multiple testing under dependency. Ann Stat. 2001;29(4):1165–1188. [Google Scholar]
Associated Data
This section collects any data citations, data availability statements, or supplementary materials included in this article.