

Abstract
Background and Aims
Productivity of many crops benefits from the presence of pollinating insects, so a decline in pollinator abundance should compromise global agricultural production. Motivated by the lack of accurate estimates of the size of this threat, we quantified the effect of total loss of pollinators on global agricultural production and crop production diversity. The change in pollinator dependency over 46 years was also evaluated, considering the developed and developing world separately.
Methods
Using the extensive FAO dataset, yearly data were compiled for 1961–2006 on production and cultivated area of 87 important crops, which we classified into five categories of pollinator dependency. Based on measures of the aggregate effect of differential pollinator dependence, the consequences of a complete loss of pollinators in terms of reductions in total agricultural production and diversity were calculated. An estimate was also made of the increase in total cultivated area that would be required to compensate for the decrease in production of every single crop in the absence of pollinators.
Key Results
The expected direct reduction in total agricultural production in the absence of animal pollination ranged from 3 to 8 %, with smaller impacts on agricultural production diversity. The percentage increase in cultivated area needed to compensate for these deficits was several times higher, particularly in the developing world, which comprises two-thirds of the land devoted to crop cultivation globally. Crops with lower yield growth tended to have undergone greater expansion in cultivated area. Agriculture has become more pollinator-dependent over time, and this trend is more pronounced in the developing than developed world.
Conclusions
We propose that pollination shortage will intensify demand for agricultural land, a trend that will be more pronounced in the developing world. This increasing pressure on supply of agricultural land could significantly contribute to global environmental change.
Key words: Agricultural production, biotic pollination, crop diversity, cultivated area, developed world, developing world, FAO, randomization
INTRODUCTION
Animal-mediated pollination contributes to the sexual reproduction of over 90 % of the approximately 250 000 species of modern angiosperms (Kearns et al., 1998). This interaction diffusely affects human survival through its roles in sustaining much biodiversity on Earth and contributing to the integrity of most terrestrial ecosystems. However, we also depend more directly on this interaction, because many agricultural crops rely to some degree on pollinators for setting the seeds or fruits that we consume, or the seeds we sow or breed. A now well-known estimate proposed that about one-third of our food, including animal products, derives from animal-pollinated, mostly bee-pollinated, crops (McGregor, 1976). This estimate has recently been confirmed by Klein et al. (2007), although animal production was excluded. The diversity of crops that depend on animal pollination provides still more impressive estimates. For instance, biotic pollination improves the fruit or seed quality or quantity of about 70 % of 1330 tropical crops (Roubik, 1995) and 85 % of 264 crops cultivated in Europe (Williams, 1994). These figures are not obviously biased by the inclusion of many minor crops from a production viewpoint, as pollinating insects increase fruit or seed quality or quantity of 39 of the 57 major crops worldwide (Klein et al., 2007). Therefore, the production and diversity of agriculture seem to depend to a large extent on biotic pollination, particularly on the service provided by the honey-bee (Apis mellifera), the single most important pollinator species, and a plethora of wild bee species.
Currently, stocks of honey-bees are experiencing many diseases, and populations of wild pollinator species are declining in several regions (Kluser and Peduzzi, 2007), raising concern that a potential global ‘pollination crisis’ threatens our food supply (Withgott, 1999; Kremen and Ricketts, 2000; Richards, 2001; Westerkamp and Gottsberger, 2002; Steffan-Dewenter et al., 2005). In North America, the number of managed honey-bee hives has declined almost 60 % since the mid 1940s, due to the increasing incidence of parasitic mites and other unidentified factors (National Research Council, 2007; Oldroyd, 2007; Stokstad, 2007). Correspondingly, the diversity of wild bees has decreased greatly over much of Western Europe, mostly owing to habitat destruction (Biesmeijer et al., 2006; Fitzpatrick et al., 2007). Despite evidence that pollination shortages affect fruit and seed quality and quantity of many crops in many places (Klein et al., 2007), data that we compiled previously did not provide strong evidence of pollinator limitation affecting global agricultural production (Aizen et al., 2008). However, we did determine that cultivation of pollinator-dependent crops has, on average, been expanding faster than that of non-dependent crops in both developed and developing countries over the period 1961–2006, so the demand for pollination service is rising at the same time that pollinator abundance and diversity are declining. In the near future, such opposing trends threaten crop yields, which could be averted either by further increases in inputs to compensate for a decline in productivity or by implementation of technical alternatives to traditional pollination practices. This bleak scenario calls for better information on the dependence of agriculture on pollinators: estimates that should be more precise than the enlightening, but raw values reported so far (see also Klein et al., 2007).
Many studies have attempted to estimate the value of crop pollination and pollinator dependency in financial terms, generating net dollar values for this ecosystem service (Southwick and Southwick, 1992; Costanza et al., 1997; Losey and Vaughan, 2006; Gallai et al., 2009). In the present study, we take a more direct approach, focusing only on predicted changes in crop output and the land requirements necessary to maintain current levels of production. Rather than exploring the possibilities of complex economic responses such as crop substitutions, or shifts in demand, here we have developed a static model that places more emphasis on the differences among crops in their range of pollinator dependence and their consequences for agricultural productivity. We suggest that this approach will improve our understanding of the nature of our dependence on crop pollinators, without introducing assumptions about economic conditions.
The current dependency of global agriculture on pollinator services can be estimated in terms of either losses related to a pollination shortage or the cost of mitigation. The first, deficit, approach requires quantification of the decrease in relevant measures of productivity, such as total production, yield and diversity, in the absence of animal pollination. The second, compensation, approach requires prediction of the increased agricultural inputs needed to offset the pollination deficiency, such as increases in cultivated area, number of managed bees, labour required for hand pollination, breeding for autonomous pollination and adoption of pheromones to increase the foraging activity of bees. Both approaches are implicit in calculations of the value of insect or, more specifically, honey-bee pollination to particular crops or the agriculture of specific countries (e.g. Robinson et al., 1989; Morse and Calderone, 2000; Ricketts et al., 2004; Morandin and Winston, 2006). Regardless of the approach adopted, estimation of the agricultural dependence on animal pollination must recognize that most crops provide some yield in the absence of pollinators and so depend only partially on pollinators. Therefore, any global estimate of pollinator dependency must account for variation among crops in the contribution of animal pollination to production to guard against overstating the agricultural importance of pollinators (Ghazoul, 2005).
Here we combine long-term data on global crop production and cultivated area provided by the Food and Agriculture Organization (FAO) of the United Nations (FAOSTAT, 2007) and comprehensive information on the pollinator dependence of individual crops (Klein et al., 2007) to estimate both the current incidence of pollinator dependency in agriculture and the change in this dependency over the last five decades. This historical perspective provides an indicator of possible future consequences of a global pollinator decline. Although we previously reported an expansion in the cultivation of pollinator-dependent crops (Aizen et al., 2008), we did not explore this trend in terms of the extent to which agricultural production or diversity might be affected by pollinator decline given the partial dependence on pollinators of most crops. For each year between 1961 and 2006, we calculated two deficit and one compensation estimate of pollinator dependency in global agriculture. Specifically, for deficit estimates we calculated the percentage decrease in agricultural production and decline in the diversity of agricultural production caused by complete loss of pollinators. For compensation estimates we predicted the percentage increase in total cultivated area needed to mitigate the production deficit in each affected crop. To assess the realism of our compensation model, we explored the possibility that crops with slow yield growth (i.e. slow growth in production per area unit) are already expanding their total cultivated area at higher rates to keep pace with increasing production demands. This should result in a negative association between relative growth in cultivated area and relative growth in yield across crops. If this pattern is corroborated, then we can infer that any future global pollinator shortage will require ongoing expansion in the area of cultivation for crops that depend highly on pollinators.
We examined data separately for the developed and developing world, because these two regions differ, additionally to geographical location, in socioeconomic conditions, agricultural intensification, habitat destruction rates and subsidy policies (Conway, 2001; Evenson and Gollin, 2003). Our previous results showed that pollinator-dependent crops represented a larger proportion of total agricultural production in the developing than developed world (Aizen et al., 2008). However, because we did not consider the differential importance of animal pollination for the different crops in that study, we do not know to what extent agriculture in the developing world is more vulnerable to a pollination shortage than in developed world. This is important because those tropical crops that are mostly or exclusively cultivated in the developing world might differ, on average, in their degree of pollinator dependency when compared with crops widely cultivated in both regions. Therefore, in addition to providing new estimates of pollinator dependency and their change over time, we compare them between regions with different levels of development.
MATERIALS AND METHODS
Dataset
Over the last five decades, the FAO has gathered information on crop cultivation based on the response to questionnaires sent out annually to member countries. From the extensive FAO dataset (FAOSTAT, 2007), we compiled annual data for 1961–2006 on production and cultivated area of a total of 87 crops, 52 of which were represented by single species and 35 by two or more often taxonomically related species (Table S1 in Supplementary Data, available online). For instance, the crop ‘coffee’ represents three congeneric species, Coffea arabica, C. canephora and C. libarica. The crops in our dataset collectively accounted for 82·8 % of total global food production during 2006, and include all the crops listed in the electronic supplementary material 1 and 2 of Klein et al. (2007), in which information on their pollinator dependence status was reported. We considered a crop to be pollinator-dependent if animal pollination is required to maximize the production of fruits or seeds consumed by humans, whereas non-dependent crops are those that are either pollinated abiotically (wind) or autogamously, or cultivated for vegetative parts (leaves, stems, tubers, etc.). Non-dependent crops include potatoes and other vegetables, for which human consumption does not depend directly on pollinators, but pollinators are important for propagation via seed or in breeding programmes (Table S1 in Supplementary Data). Although exclusion of these crops from the dependent group may underestimate overall pollinator dependency in agriculture, quantification of the indirect contribution of animal pollinators to their production is complex.
For the present study, we used separate values on production and area for the developed and developing world in the FAO dataset. According to the FAO classification, the developed world includes all of Europe, USA, Canada, Australia and New Zealand, whereas the developing world includes all of Africa and Latin America, as well as most of south-east Asia, China and India. The USSR was considered by the FAO to be a developing country until its dissolution in 1991. After that year, Russia, Ukraine and the other European ex-Soviet republics were reclassified by the FAO as developed countries, whereas the Asian ex-Soviet republics remained as developing countries. This reclassification disrupted the regional trends in total crop production and cultivated area, because USSR agriculture, dominated by Russia and Ukraine, represented about 9·8 % of global crop production by 1991. For consistency and because the USSR showed similar trends to the rest of Europe until 1991, we considered all former Soviet republics as part of the developed world for the entire 1961–2006 period. Therefore, we added the production and cultivated area of each crop in the USSR for 1961–1991, and of each crop in Armenia, Azerbaijan, Georgia, Kazakhstan, Kyrgyzstan, Tajikistan, Turkmenistan and Uzbekistan for 1992–2006 to the annual data for the developed world (and subtracted from the data for the developing world).
Crops were categorized according to their dependence on animal pollinators based on the magnitude of the reduction in production (i.e. decreased fruit or seed set/weight) when pollinators are excluded experimentally from flowers, following the recommendations of Klein et al. (2007). These authors defined five classes of pollinator dependence based on thorough evaluation of the existing literature: (a) none (production does not increase with animal pollination; class 0), (b) little (0–10 % production reduction; class 1), (c) modest (10–40 % reduction; class 2), (d) high (40–90 % reduction; class 3) and (e) essential (>90 % reduction without pollinators; class 4). Variation in pollination requirements among cultivars within single crops and among species in crop complexes precluded more refined categorization. However, we do address the impact of uncertainty in the true degree of dependence for each individual crop on estimates of pollinator dependency (see below).
Data analysis
We used data on crop production and cultivated area to calculate different estimates of overall agricultural pollinator dependency in the developed and developing world. For each year, we calculated the expected percentage decrease in agricultural production (i.e. production deficit) in the absence of animal pollination as:
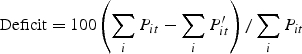 |
where Pit is the production (in metric tonnes, Mt) of crop i during year t, and P′it = Pit(1 − di). The coefficient di ranges from 0 for crops that do not depend on pollinators to 1 for crops that depend fully on pollinators for production. Similarly, we calculated the percentage decrease in diversity (i.e. diversity deficit) in the absence of animal pollination during year t as 100(Dt − D′t)/Dt, where Dt and D′t are estimates of a diversity index based on Pit and P′it, respectively. We assessed the diversity of agricultural production in terms of how agricultural production was partitioned among the different crops (i.e. evenness). Estimates of diversity deficit may depend on the specific index used, so we consider Pielou's J (Pielou, 1969) and Hurlbert's ‘probability of an interspecific encounter’ or PIE (Hurlbert, 1971):
and
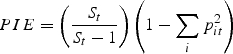 |
where St is the number of crops recorded during year t and pit is the relative abundance of crop i during year t, calculated as:
for Dt and D′t, respectively. Pielou's J represents the evenness component of the Shannon diversity index, whereas Hurlbert's PIE indicates the probability of finding different crops in two cultivated parcels (e.g. of 1 ha each) chosen at random. These two indices range from 0 when there is just one extremely dominant crop to 1 when production is distributed evenly among all crops. Both indices would show reduced evenness of agricultural production if pollinator declines disproportionately affected crops that were already low in production. For each year, we also calculated the total percentage increase in cultivated area needed to balance the production deficit of each crop (i.e. area compensation) as:
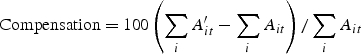 |
where Ait is the area (in hectares) cultivated with crop i during year t and A′it = Ait/(1 − di) (i.e. the area needed to produce Pit in the absence of animal pollination).
To estimate average dependency on animal pollination for agriculture in either the developed or the developing world, we assumed that the relevant di was best represented by the mid-value of the relevant category of pollinator dependency. Hence, di equalled 0, 0·05, 0·25, 0·65 or 0·95 for dependency classes 0, 1, 2, 3 or 4, respectively. We addressed how uncertainty in di influenced our estimates of pollinator dependency by randomization (implemented in R; R Development Core Team, 2007). For a given randomization, each crop i was assigned a pseudo-di drawn randomly from a uniform distribution bounded by the limits of its pollination-dependence category. For instance, for a crop categorized as highly dependent on animal pollination (class 3), di was drawn randomly from 0·4–0·9, whereas for non-dependent crops, di was set constantly at 0. For each year and region, we generated 5000 randomized values of agricultural dependency after 5000 iterations. We then constructed a 95 % confidence interval around the estimated mean by identifying the index values that delimited the 2·5 and 97·5 % percentiles of the cumulative distribution of randomized values.
The distribution of randomized estimates of the extra cultivated area needed to compensate for the production deficit of even a single crop was highly biased, because it approaches infinity as di → 1. Therefore, we were unable to estimate the upper limit of the confidence interval for this compensation index using randomization. However, we did calculate a minimum possible area compensation by setting di for each crop to the lowest values of its class intervals.
We explored the possibility that some compensation for crop production deficits has already occurred through an increase in cultivated area. In this case, growth in relative yield (i.e. Mt ha−1) should decrease as growth in cultivated area increases across all crops. We also explored the relative influence of growth in area and yield to change in crop production. For each crop in each region, we first standardized the change in each variable x (i.e. production, area or yield) during year t relative to its value during 1961 as Δxt = 100(xt − x1961)/x1961. We then calculated the slope, β, of the linear relationship between Δxt and year (i.e. % year−1) as an estimate of the average growth of the respective dependent variable. For instance, a slope of 1·5 for area indicates that the cultivated area of a given crop increased, on average, by 1·5 % year−1 relative to its cultivated area in 1961. As it is unlikely that the growth increment of one crop influences another crop growth, the different slope estimates may be considered independent despite the time-related error correlation structure within each crop (Murtaugh, 2007). For these calculations, we excluded five and four crops from the developed and developing world, respectively, for which complete data since 1961 were not available (Table S1 in Supplementary Data, available online).
RESULTS
Agriculture production and production deficit
Global agricultural production increased by 140 % between 1961 and 2006; however, temporal trends differed between the developed and developing world. In the developed world, aggregate production increased slightly until the late 1980s and decreased slightly thereafter, whereas in the developing world production increased constantly and strongly over the entire 46-yr period (Fig. 1). Thus, although total agricultural production was similar in the developing and developed world in 1961, by 2006 production was 2·2 times greater in the developing world.
Fig. 1.

Trends in total agricultural production and mean production deficits in the absence of animal pollination for the developed and developing world 1961–2006. The grey bands in the lower panels include the region delimited by the 2·5 and 97·5 percentiles of randomized distributions and depict uncertainty in the estimation of the production deficit.
The total production deficit that would occur in the absence of pollinators ranged from 3–5 % in the developed world up to approx. 8 % in the developing world (Fig. 1). The predicted deficit has, however, increased since the 1980s in both regions. Pollinator dependency, as measured by this estimate, increased by 50 and 62 % from 1961 to 2006 in the developed and developing world, respectively. Uncertainty in dependency values of individual crops introduced an error of only approx. 1 % in our estimation of the true production deficit. Thus, the patterns depicted in the lower panels of Fig. 1 reveal trends that are robust to uncertainty in the precise values of pollinator dependence.
Diversity among crops and the diversity deficit
More than half of the 87 crops included in our sample depended to at least some extent on pollinators (dependency category >0; Table 1). All 87 of these crops were cultivated in the developing world and 76 were cultivated in the developed world. We found no significant differences in pollinator dependence between crops cultivated in the developed world and the 11 tropical crops cultivated exclusively in the developing world in (Fisher's Exact test, P = 0·18), despite a trend towards higher pollinator dependence in the latter group (Table 1). If crops in the highest dependence category produced nothing in the absence of flower visitors, the number of productive crops would decline by 8 % globally.
Table 1.
Distribution of crops among categories of pollinator dependency
| Pollinator dependence* | Developed world, all crops |
Developing world, all crops† |
Exclusively in developing world |
|||
|---|---|---|---|---|---|---|
| No. of crops | Percentage crops | No. of crops | Percentage crops | No. of crops | Percentage crops | |
| 0 (none) | 33 | 43·4 | 35 | 40·2 | 2 | 18·2 |
| 1 (little) | 11 | 14·5 | 14 | 16·1 | 3 | 27·3 |
| 2 (modest) | 14 | 18·4 | 15 | 17·2 | 1 | 9·1 |
| 3 (high) | 13 | 17·1 | 16 | 18·4 | 3 | 27·3 |
| 4 (essential) | 5 | 6·6 | 7 | 8·1 | 2 | 18·2 |
* Class 0 (none) = production independent of animal pollination; 1 (little) = production reduction >0 but <10 % without pollinators; 2 (modest) = 10–40 % reduction; 3 (high) = 40–90 % reduction; and 4 (essential) = reduction >90 %.
†Includes all the crops sampled in this study.
We ordered crops from most to least abundant by production volume based on data collected during 2006. The resulting rank-abundance curves show that 81·5 and 78·2 % of all crops reported for the developed and developing world, respectively, had production in the range 105–108 Mt (Fig. 2). Crop production correlated negatively with pollinator dependence (Spearman's correlation: developed world, rS = −0·225, n = 76, P = 0·051; developing world, rS = −0·317, n = 87, P < 0·005), trends summarized in the lower panels of Fig. 2. For instance, production of only two of the ten most productive crops depended to some degree on flower visitors in both world regions, whereas eight and seven of the ten least productive crops were pollinator-dependent in the developed and developing world, respectively (Fig. 2).
Fig. 2.

Rank abundance curves of crops cultivated in the developed and developing world (upper panels). Crops were ranked from the most to the least abundant according to their total production in each region. Each crop was coded based on its pollinator dependence category (0–4). Crop names are not included for clarity. In the lower panels, crops were grouped according to their pollinator dependence categories and production data summarized as box plots. Sample sizes (i.e. number of crops) are given in parentheses. Note the logarithmic scale of the y-axis in both upper and lower panels.
Both Hurlbert's PIE and Pielou's J exhibited relatively constant trends, although a weak increase started from the 1990s (Fig. 3). PIE was larger than J for each year of the time series in both the developed and the developing world. Both estimators indicate that agriculture was slightly more diverse in the developing than developed world, over and above differences in the number of crops grown. Predicted deficits in diversity of agricultural production in the absence of flower visitors were relatively small; however, this diversity loss depended on the particular estimator used, being higher for J (4–6 %) than for PIE (1–2 %). The predicted deficit increased from the 1980s, especially in the developing world (Fig. 3). Uncertainty in pollination dependency introduced errors in our estimation of agriculture diversity deficit of approx. 1 % for J and <0·5 % for PIE. Thus, the patterns depicted in the lower panels of Fig. 3 reveal trends that are robust to uncertainty in the precise values for pollinator dependence.
Fig. 3.

Trends in crop diversity and expected mean diversity deficits in the absence of animal pollination for the developed and developing world 1961–2006. Diversity was estimated by Pielou's J and Hurlbert's PIE evenness indices. The grey bands in the lower panels include the regions delimited by the 2·5 and 97·5 percentiles of randomized distributions and depict uncertainty in the estimate of the diversity deficit.
Cultivated area and area compensation
Total cultivated area increased almost 25 % from 1961 to 2006, but temporal trends differed greatly between the developed and developing world. In the developed world, the area devoted to agriculture increased slightly until the mid 1980s before starting to decline, whereas in the developing world agricultural area increased steadily over the entire period (Fig. 4). In 1961 the cultivated area in the developing world was only 38 % larger than in the developed world, but as a consequence of the different trends this difference increased to about 130 % in 2006.
Fig. 4.

Trends in total cultivated area and in the extra cultivated land required to compensate for the deficits in crop production in the absence of animal pollination (i.e. area compensation) for the developed and developing world 1961–2006. Area compensation was estimated assuming that the pollinator dependence of individual crops was represented by the mid-value of the range defining its corresponding dependence class (average-area compensation) and by the lower limit of that range (minimum-area compensation).
The percentage increase in total cultivated area needed to offset the production deficit expected to occur in the absence of animal pollination was much larger in the developing than developed world, a difference that has recently accentuated (Fig. 4). In the developed world, an average additional cultivated area of about 15 % would have been required to compensate for the production deficit observed in most years between 1961 and 2006, with a weak intervening decrease during the 1970s and 1980s. In contrast, in the developing world the cultivated area needed to compensate for the production deficit increased from 28 % in 1961 to 42 % in 2006. Although minimum estimates of area compensation were half these values, the trends were similar (Fig. 4).
Average annual growth in relative production, area and yield were all related. Spearman rank correlations showed that growth in production correlated positively with growth in both area and yield in the developed and developing world, although the association with area was consistently much stronger (Fig. 5). Growth in relative area correlated negatively with growth in yield in both regions; thus, those crops that showed the lowest relative yield growth expanded their area faster on average than crops with the highest growth rates (Fig. 5). The statistical significance of these trends did not depend on the inclusion of crops with extreme growth values. For instance, the association between growth in area and production for the developed world remains highly significant if the two crops with either βΔarea or βΔproduction > 40 % year−1 are excluded (rs = 0·684, n = 69, P < 0·0001).
Fig. 5.

Associations of the average annual rates of growth in area (βΔarea), production (βΔproduction) and yield (βΔyield) for crops in the developed and developing world relative to values in 1961. Results of Spearman's correlations are provided.
DISCUSSION
The pollinator dependence of agriculture
The estimate that humans depend on animal pollination for about one-third of their food is often highlighted in the literature on the agricultural consequences of a much debated decline in pollinator abundance (Buchmann and Nabhan, 1996; Kearns et al., 1998; Holden, 2006; Kluser and Peduzzi, 2007). Indeed, 70 % of crops that account for about 35 % of all agricultural production depend to varying extents on pollinators for high-quality and high-quantity seed and fruit production (Klein et al., 2007). However, according to our results the proportion of the total production that can be attributed directly to animal pollination, and that may be lost in the absence of flower visitors, is on the order of 5 % (developed world) to 8 % (developing world). This is the compound result of the partial dependence of most pollinator-dependent crops (i.e. categories 1–3, Table 1) and the smaller average production of the pollinator-dependent than non-dependent crops (Fig. 2). Deficits in diversity of agricultural production were of the same magnitude or lower. Our randomization tests demonstrate that these estimates are little affected by current fragmentary knowledge about the quantitative pollination requirements for many crops.
The discrepancy between prior estimates and our estimates of the agricultural importance of biotic pollination results primarily because, unlike prior estimates, we accounted for the fact that many animal-pollinated crops depend only partly on this service. For instance, although about three-quarters of crops benefit in some way from animal pollination, only about 10 % depend fully on pollinators to produce the seeds or fruits we consume, and they collectively account for only 2 % of global agricultural production. The same phenomenon explains why major pollinator loss will have limited impact on the diversity of agricultural production, in terms of either crop richness or crop evenness. Although Ghazoul (2005) has questioned claims of a global pollination crisis, in part based on the limited vulnerability of most crops to pollinator losses (see also Klein et al. 2007), our analysis provides the first long-term quantitative assessment of the consequences of incomplete pollinator dependence on agricultural productivity (for an economic analogue for the year 2005, see Gallai et al., 2009).
Like previous studies, we have focused on production in tonnes, but other relevant perspectives on the importance of both crops and pollinators also warrant consideration. Crops differ in their nutritional and economic values, which are not well represented by production alone. The nutritional contribution of many animal-pollinated crops in terms of proteins, vitamins and minerals may be much more important for the human diet than the total mass of production would suggest (Steffan-Dewenter et al., 2005). Similarly, some relatively small-volume, pollinator-dependent crops may provide disproportionately large economic returns and are often important for local markets. To support this point, Gallai et al. (2009) reported that the value of a tonne of a pollinator-dependent crop was, on average, five times larger than the value of a tonne of a non-dependent crop. Furthermore, our focus on total global effects obscures local phenomena. For example, a decline in coffee production might have limited effect on global agricultural production, but would significantly impact countries that specialize in coffee production, such as Colombia. Finally, considering pollination solely as a service for human food consumption is unwise, both because indirect effects on biodiversity of a decline in pollinators may feedback and affect human welfare (Kremen et al., 2007) and because many people value biodiversity for cultural reasons that extend far beyond the biological processes that depend on it.
Despite the prediction of a <8 % impact of animal pollination on agricultural production and diversity, we found that compensation for pollination shortage would require vigorous expansion in total cultivated area. Our estimates of area compensation rely on the assumption that decreased yield of a specific crop can be compensated for, in the absence of animal pollination, by an expansion of its cultivated area. The growing diversification of the human diet, particularly in industrialized nations, and globalization in food trade (Pelto and Pelto, 1983) have increased demand for many animal-pollinated crops and have discouraged replacement of crops that depend strongly on pollinators by less dependent crops. Indeed, the evidence supported our prediction that the crops with the least yield growth over the last five decades generally had the greatest expansion of cultivated area. This group includes fruit crops such as avocado, blueberry, cherry, plums and raspberry, which are highly pollinator-dependent and already show no or even negative growth in yield (Table S1 in Supplementary Data, available online). More generally, yield growth among highly pollinator-dependent crops seems not to increase as fast as among less dependent or non-dependent crops (Aizen et al., 2008). Therefore, the effect of an increasing pollination shortage might manifest in a disproportionate increase in demand for agricultural land, which is surely mediated by the much higher market value of the production derived from pollinator-dependent than non-dependent crops (Gallai et al., 2009). Although this effect is more subtle than the collapse in production implicit in the language of the ‘pollination crisis’ (Allen-Wardell et al., 1998; Kremen and Ricketts, 2000; Westerkamp and Gottsberger, 2002), such increased pressure on supply of agricultural land could nevertheless contribute significantly to global environmental change.
Change over time and differences between socioeconomic regions
Several indicators reveal an increase in pollinator dependency in agriculture over time in both the developed and the developing world. We recently estimated that the percentage of crop land devoted to pollinator-dependent crops in the developed world increased from 18·2 % in 1961 to 34·9 % in 2006, and from 23·4 to 32·8 % in the developing world (Aizen et al., 2008). Despite showing smaller values in pollinator dependency, these trends were reflected here in the increase in the percentage of agricultural production that can be attributed to animal pollination (Fig. 1). Also relevant is the differential growth in the degree of pollinator dependency in agriculture we have found in the developing vs. developed world, according to any of our measures of pollinator dependency.
Increasing demand for food, particularly from populous and fast-growing nations such as China and India (Winters and Yusuf, 2007), and for a diversity of agricultural products at the global market (Pelto and Pelto, 1983), including many tropical crops, are at the core of our trends. Today, the developing world represents more than two-thirds of global agricultural production and cultivated land, and supports an agriculture which, in terms of production, is 50 % more pollinator-dependent than that of the developed world. Correspondingly, we predict that the area under cultivation needed to compensate for any pollinator collapse would be six times larger in the developing than developed world. Although managed honey-bees are decreasing drastically in North America and some parts in Europe (Watanabe, 1994; Kluser and Peduzzi, 2007; Oldroyd, 2007), native crop pollinators seem to be lost faster in agricultural landscapes in the tropics than in temperate regions (Ricketts et al., 2008). This situation may further increase the vulnerability of agriculture in the developing world, as the large area needed to compensate for a pollination deficit will accelerate deforestation, intensify pressures on remnants of natural and semi-natural ecosystems, and increase conflicts in the use of agriculture lands.
Conclusions
Concerns of an ongoing trend in pollinator decline in several parts of the world have brought justified attention to the security of human food supplies (Kremen and Ricketts, 2000; Westerkamp and Gottsberger, 2002; Holden, 2006). We have shown that the erosion of much pollination capacity caused by different human impacts will have a limited direct effect on the quantity and diversity of food production. However, compensation for these direct impacts on production could have surprisingly large effects. Even the limited direct reduction in agricultural production expected under increasing pollinator shortages may impose a disproportionate demand for agricultural land to meet growing global consumption, which will accelerate habitat destruction and may cause further pollinator losses.
SUPPLEMENTARY DATA
Supplementary Data is available online at http://aob.exfordjournals.org/ and consists of an Excel file for Table S1 with details for each of the 87 crops, including category of pollinator dependence, and estimates of average annual growth rates in production, cultivated area and yield for the developed and developing world relative to their respective values in 1961.
ACKNOWLEDGEMENTS
We thank Natacha Chacoff, Lawrence Harder and three anonymous reviewers for useful comments and suggestions. This work was conducted partly within the framework provided by the Restoring Pollination Services Working Group supported by the National Center for Ecological Analysis and Synthesis, a centre funded by NSF (grant no. DEB-0072909). Additional funding by the Argentina National Council for Research (PIP 5066) and the National University of Comahue (B126/04) is acknowledged. M.A.A. is a career researcher of the Argentina National Council for Research and L.A.G. holds a fellowship from the same agency. A.M.K. is supported by the Alexander von Humboldt Foundation.
LITERATURE CITED
- Aizen MA, Garibaldi LA, Cunningham SA, Klein AM. Long-term global trends in crop yield and production reveal no current pollination shortage but increasing pollinator dependency. Current Biology. 2008;18:1572–1575. doi: 10.1016/j.cub.2008.08.066. [DOI] [PubMed] [Google Scholar]
- Allen-Wardell G, Bernhardt P, Bitner R, Burquez A, Buchmann S, Cane J, et al. The potential consequences of pollinator declines on the conservation of biodiversity and stability of food crop yields. Conservation Biology. 1998;12:8–17. [Google Scholar]
- Biesmeijer JC, Roberts SPM, Reemer M, Ohlemuller R, Edwards M, Peeters T, et al. Parallel declines in pollinators and insect pollinated plants in Britain and the Netherlands. Science. 2006;313:351–354. doi: 10.1126/science.1127863. [DOI] [PubMed] [Google Scholar]
- Buchmann SL, Nabhan GP. The forgotten pollinators. Washington, DC: Island Press; 1996. [Google Scholar]
- Costanza R, d'Arge R, de Groot R, Farber S, Grasso M, Hannon B, et al. The value of the world's ecosystem services and natural capital. Nature. 1997;387:253–260. [Google Scholar]
- Conway G. The doubly green revolution: balancing food, poverty and environmental needs in the 21st century. In: Lee DR, Barrett CB, editors. Tradeoffs or synergies? Agricultural intensification, economic development and the environment. Wallingford, UK: CAB International; 2001. pp. 17–34. [Google Scholar]
- Evenson RE, Gollin D. Assessing the impact of the green revolution, 1960 to 2000. Science. 2003;300:758–762. doi: 10.1126/science.1078710. [DOI] [PubMed] [Google Scholar]
- FAOSTAT. 2007 Data available at http://faostat.fao.org/site/526/default.aspx . Accessed January 2008. [Google Scholar]
- Fitzpatrick Ú, Murray TE, Paxton RJ, Breen J, Cotton D, Santorum V, et al. Rarity and decline in bumblebees – A test of causes and correlates in the Irish fauna. Biological Conservation. 2007;136:185–194. [Google Scholar]
- Gallai N, Salles J-M, Settele J, Vaissière BE. Economic valuation of the vulnerability of world agriculture confronted with pollinator decline. Ecological Economics. 2009;68:810–821. [Google Scholar]
- Ghazoul J. Buzziness as usual? Questioning the global pollination crisis. Trends in Ecology & Evolution. 2005;20:367–373. doi: 10.1016/j.tree.2005.04.026. [DOI] [PubMed] [Google Scholar]
- Holden C. Report warns of looming pollination crisis in North America. Science. 2006;314:397. doi: 10.1126/science.314.5798.397. [DOI] [PubMed] [Google Scholar]
- Hurlbert SH. The nonconcept of species diversity: a critique and alternative parameters. Ecology. 1971;52:577–585. doi: 10.2307/1934145. [DOI] [PubMed] [Google Scholar]
- Kearns CA, Inouye DW, Waser NM. Endangered mutualisms: the conservation of plant-pollinator interactions. Annual Review of Ecology and Systematics. 1998;29:83–112. [Google Scholar]
- Klein AM, Vaissière BE, Cane JH, Steffan-Dewenter I, Cunningham SA, Kremen C, et al. Importance of pollinators in changing landscapes for world crops. Proceedings of the Royal Society B: Biological Sciences. 2007;274:303–313. doi: 10.1098/rspb.2006.3721. [DOI] [PMC free article] [PubMed] [Google Scholar]
- Kluser S, Peduzzi P. Global pollinator decline: a literature review. Geneva: UNEP/GRID; 2007. [Google Scholar]
- Kremen C, Ricketts T. Global perspectives on pollination disruptions. Conservation Biology. 2000;14:1226–1228. [Google Scholar]
- Kremen C, Williams NM, Aizen MA, Gemmill-Herren B, LeBuhn G, Minckley R, et al. Pollination and other ecosystem services produced by mobile organisms: a conceptual framework for the effects of land-use change. Ecology Letters. 2007;10:299–314. doi: 10.1111/j.1461-0248.2007.01018.x. [DOI] [PubMed] [Google Scholar]
- Losey JE, Vaughan M. The economic value of ecological services provided by insects. BioScience. 2006;56:311–323. [Google Scholar]
- McGregor SE. Insect pollination of cultivated crop plants. U.S.D.A. Agriculture Handbook. 1976;496:93–98. [Google Scholar]
- Morandin LA, Winston ML. Pollinators provide economic incentive to preserve natural land in agroecosystems. Agriculture, Ecosystems and Environment. 2006;116:289–292. [Google Scholar]
- Morse RA, Calderone NW. The value of honey-bees as pollinators of US crops in 2000. Bee Culture. 2000;128:1–15. [Google Scholar]
- Murtaugh PA. Simplicity and complexity in ecological data analysis. Ecology. 2007;88:56–62. doi: 10.1890/0012-9658(2007)88[56:sacied]2.0.co;2. [DOI] [PubMed] [Google Scholar]
- National Research Council. Status of pollinators in North America. Washington, DC: National Academies Press; 2007. [Google Scholar]
- Oldroyd BP. What's killing American honey bees? PLoS Biology. 2007;5:e168. doi: 10.1371/journal.pbio.0050168. doi:10.1371/journal.pbio.0050168. [DOI] [PMC free article] [PubMed] [Google Scholar]
- Pelto GH, Pelto PJ. Diet and delocalization: dietary changes since 1750. Journal of Interdisciplinary History. 1983;14:507–528. [PubMed] [Google Scholar]
- Pielou EC. An introduction to mathematical ecology. New York: Wiley; 1969. [Google Scholar]
- R Development Core Team. R: a language and environment for statistical computing. Vienna: R Foundation for Statistical Computing; 2007. http://www.R-project.org . [Google Scholar]
- Richards AJ. Does low biodiversity resulting from modern agricultural practice affect crop pollination and yield? Annals of Botany. 2001;88:165–172. [Google Scholar]
- Ricketts TH, Daily GC, Ehrlich PR, Michener CD. Economic value of tropical forest to coffee production. Proceedings of the National Academy of Sciences of the USA. 2004;101:12579–12582. doi: 10.1073/pnas.0405147101. [DOI] [PMC free article] [PubMed] [Google Scholar]
- Ricketts T, Regetz J, Steffan-Dewenter I, Cunningham SA, Kremen C, Bogdanski A, et al. Landscape effects on crop pollination services: are there general patterns? Ecology Letters. 2008;11:499–515. doi: 10.1111/j.1461-0248.2008.01157.x. [DOI] [PubMed] [Google Scholar]
- Robinson WS, Nowogrodzki R, Morse RA. The value of honey bees as pollinators of US crops. II. American Bee Journal. 1989;129:477–487. [Google Scholar]
- Roubik DW. FAO Agricultural Services Bulletin 118. Rome: FAO; 1995. Pollination of cultivated plants in the tropics. [Google Scholar]
- Southwick EE, Southwick LJR. Estimating the economic value of honey bees (Hymenoptera: Apidae) as agricultural pollinators in the United States. Journal of Economic Entomology. 1992;85:621–633. [Google Scholar]
- Steffan-Dewenter I, Potts SG, Packer L. Pollinator diversity and crop pollination services are at risk. Trends in Ecology & Evolution. 2005;20:651–652. doi: 10.1016/j.tree.2005.09.004. [DOI] [PubMed] [Google Scholar]
- Stokstad E. The case of the empty hives. Science. 2007;316:970–972. doi: 10.1126/science.316.5827.970. [DOI] [PubMed] [Google Scholar]
- Watanabe ME. Pollination worries rise as honey bees decline. Science. 1994;265:1170–1170. doi: 10.1126/science.265.5176.1170. [DOI] [PubMed] [Google Scholar]
- Westerkamp C, Gottsberger G. The costly crop pollination crisis. In: Kevan P, Imperatriz Fonseca V, editors. Pollinating bees – The conservation link between agriculture and nature. Brasilia: Ministry of Environment; 2002. pp. 51–56. [Google Scholar]
- Williams IH. The dependence of crop production within the European Union on pollination by honey bees. Agricultural Zoology Reviews. 1994;6:229–257. [Google Scholar]
- Winters LA, Yusuf S. Dancing with giants: China, India, and the global economy. Washington, DC: World Bank Publications; 2007. [Google Scholar]
- Withgott J. Pollination migrates to top of conservation agenda. Bioscience. 1999;49:857–862. [Google Scholar]