Abstract
Background and Aims
It is well known that genome size differs among species. However, information on the variation and dynamics of genome size in wild populations and on the early phase of genome size divergence between taxa is currently lacking. Genome size dynamics, heritability and phenotype effects are analysed here in a wild population of Festuca pallens (Poaceae).
Methods
Genome size was measured using flow cytometry with DAPI dye in 562 seedlings from 17 maternal plants varying in genome size. The repeatability of genome size measurements was verified at different seasons through the use of different standards and with propidium iodide dye; the range of variation observed was tested via analysis of double-peaks. Additionally, chromosome counts were made in selected seedlings.
Key Results and Conclusions
Analysis of double-peaks showed that genome size varied up to 1·188-fold within all 562 seedlings, 1·119-fold within the progeny of a single maternal plant and 1·117-fold in seedlings from grains of a single inflorescence. Generally, genome sizes of seedlings and their mothers were highly correlated. However, in maternal plants with both larger and smaller genomes, genome sizes of seedlings were shifted towards the population median. This was probably due to the frequency of available paternal genomes (pollen grains) in the population. There was a stabilizing selection on genome size during the development of seedlings into adults, which may be important for stabilizing genome size within species. Furthermore, a positive correlation was found between genome size and the development rate of seedlings. A larger genome may therefore provide a competitive advantage, perhaps explaining the higher proportion of plants with larger genomes in the population studied. The reason for the observed variation may be the recent induction of genome size variation, e.g. by activity of retrotransposons, which may be preserved in the long term by the segregation of homeologous chromosomes of different sizes during gametogenesis.
Key words: Nuclear DNA content, intraspecific variation, genome size evolution, heritability, stabilizing selection, grasses, flow cytometry
INTRODUCTION
It is well known that genome size varies considerably among species and that genome size diversification accompanies the evolution of many species and species groups (Bennett and Leitch, 2005; Leitch et al., 2005; Gregory et al., 2007). This is frequently due to chromosomal variations (including polyploidy), but considerable differences also exist among closely related species with the same chromosome number. A species of this type was the main focus of the present study. An understanding of the molecular mechanisms of such genome size variation is developing as the result of the increasing number of published genome sequences of model species. Most of this variation is mostly associated with transposable elements amplification and removal (SanMiguel et al., 1996; SanMiguel and Bennetzen, 1998; Bennetzen, 2002; Bennetzen et al., 2005; Vitte and Panaud, 2005; Vitte and Bennetzen, 2006). However, little is currently known about the actual dynamics of genome size and its heritability in wild populations. These issues are of crucial importance in the understanding of early stages of the evolution of new taxa that differ in genome size. The nature of the molecular processes responsible for genome size divergence among related taxa, e.g. the accumulation of relatively small changes due to retrotransposon activity (Bennetzen et al., 2005), indicates that genome size diversification among species is not a saltatory event, but is instead a gradual process. For this reason, some intrapopulation and intraspecific variation in genome size appears to be a prerequisite for this evolutionary process to occur.
In the past, detailed studies of intraspecific variation in genome size were limited by methodical difficulties, and the results of many earlier papers have been shown to be doubtful or completely wrong (cf. Greilhuber, 1998, 2005). Recently, it has been shown that flow cytometry measurements of two co-processed samples that result in separate peaks, a double-peak or a bimodal peak, provides unambiguous evidence of intraspecific variation in genome size (Michaelson et al., 1991; Doležel and Gödhe, 1995; Greilhuber, 2005; Greilhuber et al., 2007). Using this method, considerable variation in genome size in the perennial grass Festuca pallens has been revealed. Both ploidy levels (diploid and tetraploid) known within this species exhibit considerable (up to 1·17-fold) variation in genome size (Šmarda, 2006; Šmarda and Bureš, 2006). In this example, the overall geographical pattern in genome size may be related to interglacial migration and survival, as well as to ongoing allopatric speciation (Šmarda, 2006; Šmarda and Bureš, 2006; Šmarda et al., 2007a). In F. pallens, diploids with larger genomes are found mainly in south-east Europe and in relict habitats such as rocks in deep river valleys, locations where they were able to survive during the last ice age. The tetraploids form three geographically separate groups with different genome sizes (Šmarda and Bureš, 2006). Over the whole distribution area, both ploidy levels exhibit frequently detectable (up to 1·12-fold) intrapopulation variation in genome size (Šmarda and Bureš, 2006; Šmarda et al., 2007a).
The main objective of the present study was an analysis of genome size dynamics in a model tetraploid population of F. pallens, a species with large variation in genome size. Based on a comparison of the genome sizes of selected maternal plants with varying genome size, their offspring and the genome sizes of the entire population of adult plants from a previous study (Šmarda et al., 2007a), the current aims were to answer the following questions. (1) What is the range of variation in genome size among offspring of a maternal plant? (2) Is there any relationship between the genome size of a maternal plant and its offspring? (3) Is there any difference in the variation of genome size between adult plants and seedlings? Is there any selection on genome size during the development of seedlings into adults? (4) Does genome size affect the development rate of seedlings?
MATERIALS AND METHODS
Model species and locality
Festuca pallens Host (Poaceae, Gramineae) belongs to a species-rich and recently diverging group of Eurasian narrow-leaved fescues (Festuca L. section Festuca). It is a tussocky and allogamic wind-pollinated species (Auquier, 1977). Its natural range is restricted to central Europe (from northern France to southern Romania) where it grows in relict habitats such as rocky steppes, rock outcrops, on steep slopes of deep river valleys, in mountain gorges and in karstic landscapes, and at altitudes between 100 and 1500 m. From a taxonomic point of view, the F. pallens population on Svatý Kopeček Hill belongs to the Pannonian tetraploid type (Šmarda and Kočí, 2003; Šmarda and Bureš, 2006), in a narrow taxonomic concept treated together with other tetraploids such as Festuca csikhegyensis Simonkai (Šmarda et al., 2007b).
Svatý Kopeček Hill is a limestone hill situated above the town of Mikulov on the southern edge of the Pavlov Hills (southern Moravia, Czech Republic, WGS84 co-ordinates ±48°48′22″N, 16°38′45″E), with an altitude ranging from 250 to 360 m. Approximately 35 % of the locality is covered by various types of rocky steppe vegetation, with F. pallens frequently occurring as the dominant or co-dominant species. The treeless patches may be considered relict habitats, supporting naturally treeless vegetation. This has made it possible for steppe plants (including F. pallens) to survive for a long time, probably through the last ice age (Šmarda et al., 2007a). A previous study of 171 tetraploid plants in this locality (Šmarda et al., 2007a) revealed an up to 1·115-fold difference in genome size within the population and demonstrated that this genome size difference has a random spatial distribution across the site and is not correlated with any environmental variables.
Plant sampling and cultivation
Seeds were collected in early July 2006 from 17 plants selected randomly from across the site. From each plant, 25–80 seeds were obtained. Maternal plants were transplanted into clay pots and cultivated under field conditions in a garden. In late August, if available, up to 50 seeds from each maternal plant were sown in plastic seed-boxes filled with garden soil. The boxes were embedded into the soil in the garden and cultivated under field conditions over the winter of 2006/2007. The cultivation yielded 562 seedlings, from which the numbers of leaves were recorded and genome size was measured in early July 2007 (approximately 10 months after sowing). Only 23 seedlings of those germinated did not survive and therefore were not analysed. In November 2007, a sample of 32 seedlings that covered the entire variation range of genome sizes was transferred to a cold greenhouse and these were used for additional measurements.
Genome size, development rate and chromosome number analyses
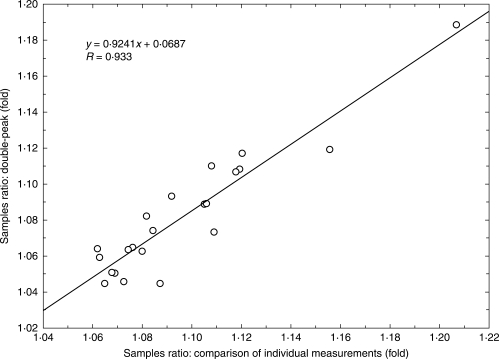
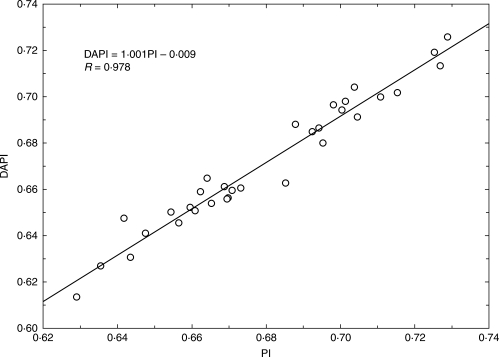
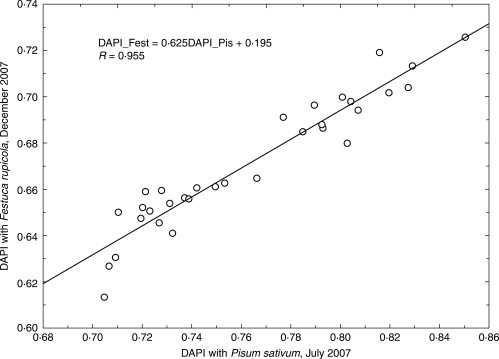
Genome size was estimated by flow cytometry with DAPI staining. Measurements were made at the Institute of Botany and Zoology, Masaryk University, Brno, with the same methods and the same instrument (PA-I Partec ploidy analyser) as in the studies of Šmarda and Bureš (2006) and Šmarda et al. (2007a). A portion of a young tiller leaf was measured together with an internal standard (a portion of a leaf originating from one individual of Pisum sativum ‘Ctirad’). A total of 5000 cells were analysed in each measurement. The average coefficient of variation (CV) of samples, and standard peaks of all measurements, was 1·55 %. Previous tests on the instrument used show that at this measurement accuracy, there is a 95 % probability that the value measured differs by less than 1·010-fold from the true value (Šmarda and Bureš, 2006). Either separate peaks or clear double peaks, in simultaneous measurements of the most contrasting samples, confirmed the range of intraspecific genome size variation in the offspring of one maternal plant, and within all plants investigated. The genome size ratios of 22 pairs of contrasting samples calculated from individual seedling measurements, and those calculated from double peaks, were highly correlated (Pearson correlation, R = 0·933; P < 0·001; Fig. 1), thus supporting the reliability of the individual measurements. Although DAPI is an AT-selective dye that provides measurements of relative DNA content, the results on Festuca pallens were highly correlated with measurements made with intercalating dyes, for example propidium iodide (PI). Based on this correlation, the results are therefore also applicable in terms of absolute genome size (Šmarda and Bureš, 2006). Repeatability of the measurements was further tested on the 32 selected tetraploid seedlings in early December. In this experiment seedlings were measured in parallel with DAPI and PI dyes, according to the method used by Šmarda and Bureš (2006: p. 668). As the peaks from the flow cytometry analysis of seedlings and Pisum sativum overlapped when PI dye was used, as an alternative a single individual of the hexaploid Festuca rupicola (sample F886, 2C = 14·295 pg) was used as an internal standard. The measurements were repeated three times and averaged. The results of measurements with DAPI and PI dyes were highly linearly correlated (R = 0·978, Fig. 2), with the slope of the regression line very close to 1. The strong linear correlation was also confirmed between the original DAPI measurements from early July and those from early December (R = 0·955, Fig. 3), which indicates high repeatability of the measurements and the absence of any bias resulting from seasonal variation in the content of metabolite compounds.
Fig. 1.
Correlation of differences in genome size between samples calculated from a comparison of individual measurements and those obtained from double peaks (see Figs 4 and 5).
Fig. 2.
Correlation of genome size measurements with DAPI and PI dyes performed in December 2007 with Festuca rupicola as internal standard.
Fig. 3.
Comparison of genome size measurements with DAPI dye made on the same samples in different seasons and using different internal standards.
When counting the number of leaves as a relative measure of seedling development rate (Nemoto et al., 1995; McMaster, 1997, 2005), both dead and fresh green leaves were considered, and also including those with the apex just emergent from the tiller sheath. In eight seedlings with contrasting genome sizes, the number of metaphase chromosomes was counted (one to six per plant) in root tips using a modified aceto-orcein method (Šmarda and Kočí, 2003).
Statistical treatment
The normality of the data was tested with the Shapiro–Wilk test at a significance level of P < 0·1. The Pearson parametric correlation was used to test the relationship between the maternal genome size and the median genome size of seedlings, and the percentage of seedlings with genome size smaller than that of their mother. The correlation of the measurements using both DAPI and PI dyes and the repeatability of DAPI measurements in different seasons were tested with linear regression (Figs 2 and 3). The overall correlation of the genome size and the number of leaves in seedlings was tested with the Spearman rank correlation and was subsequently validated by repeating analyses from which the offspring of each of 17 maternal plants was omitted. The correlation always remained significant (P < 0·04) or became only marginally significant (P = 0·052) after the offspring of plant 16 had been omitted.
The Kolmogorov–Smirnov D-statistic (K-S D; the largest absolute difference between the observed and expected distributions) was used to find the best fitting distributions of genome sizes in seedlings and adult plants. The following distribution functions were tested: extreme value (Gumbel), log-normal, normal, Weibull, Rayleigh and exponential. As the relative genome sizes reported by Šmarda et al. (2007a) were measured with a different standard, a diploid plant of Festuca pallens (sample F1229), the original values were re-calculated by using the known sample/standard ratio of sample F1229 with the standard used here, Pisum sativum ‘Ctirad’ (F1229/Pisum = 0·388944).
To compare genome sizes of seedlings with the previous results in 171 adult plants (Šmarda et al., 2007a), (1) 1000 random selections of 171 from 562 available seedlings were simulated, and (2) as the data on adult plants (Šmarda et al., 2007a) had been calculated as an average of three measurements and therefore have a smaller estimation error, 1000 possible data sets of genome sizes of 171 adult plants were simulated by multiplying each of the 171 averaged values with a measurement error (single measurement/measurements average ratio) selected randomly from the 513 errors of the original data. This procedure simulated the results that would have been obtained if adult plants had been measured only once. Simulations were also repeated while omitting the offspring of each of 17 maternal plants and, as smaller genomes were slightly overrepresented in maternal plants, by removing seedlings of three maternal plants with the smallest genomes (plants 02, 03 and 10). This last step was performed in order to achieve similar median genome sizes of maternal plants and adult plants in the site (Mann–Whitney test, P > 0·3). The genome size range was calculated for each of 1000 simulations, and the differences between genome size ranges of seedlings and adult plants were tested with the Mann–Whitney test. All analyses gave very similar results with genome size ranges always significantly larger in seedlings than in adult plants (P < 0·001).
The statistical tests were calculated in the Statistica 7·1 program (StatSoft Inc., 2005). The simulations were calculated with the random number generator in Microsoft Excel 2003.
RESULTS AND DISCUSSION
Considerable genome size variation in progeny
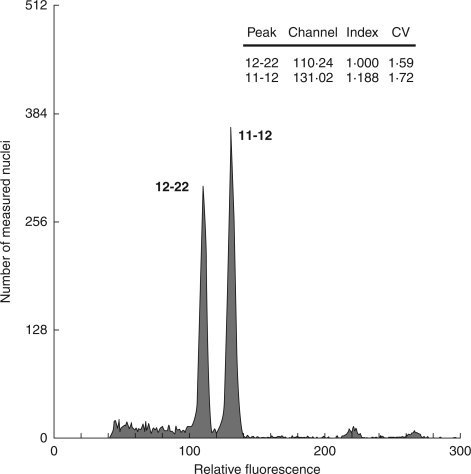
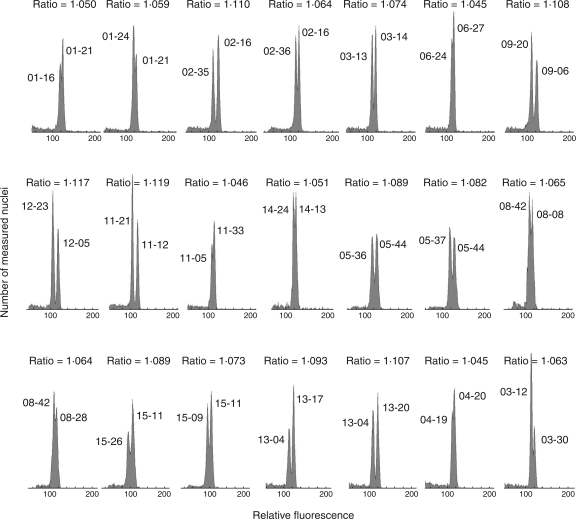
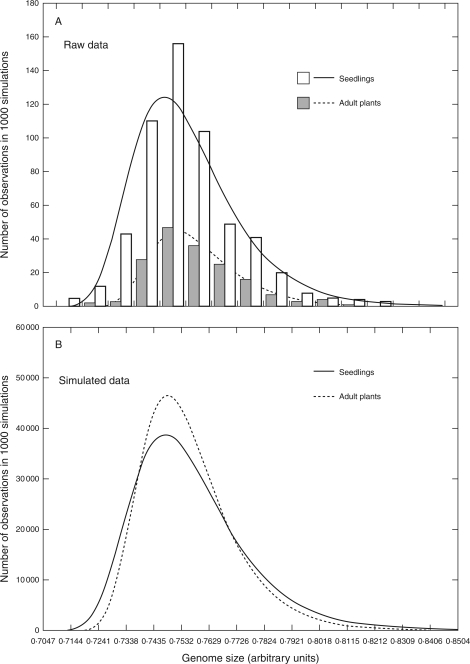
The cultivation yielded 562 seedlings that varied considerably in genome size, even within offspring of a single maternal plant. By comparing contrasting samples among seedlings of a particular maternal plant in simultaneous measurements, it was verified by double-peaks that considerable differences in genome size existed within the offspring of 13 maternal plants. The differences in genome size of the offspring of the remaining four maternal plants were below detection limits, i.e. lower than approximately 1·04-fold. As shown by the presence of double peaks, genome size varied up to 1·188-fold within all 562 seedlings (Fig. 4), and 1·119-fold within the offspring of a single maternal plant (Fig. 5; see also Supplementary Information 1, available online). The latter value is very close to the maximum genome size variation recorded in this locality within the entire population of adult plants (1·115-fold; Šmarda et al., 2007a). At maximum, an up to 1·117-fold variation was documented, even within seedlings grown from grains collected from a single panicle (plant 12, Fig. 5). The distribution of genome sizes both within the offspring of a particular maternal plant and that of all seedlings was generally continuous with a central peak (Fig. 6A). The positive (right) skew indicates a slightly higher proportion of seedlings with large genomes, as was the case with the population of adult plants previously studied from the same site (Šmarda et al., 2007a). Compared with the 1·164-fold variation found in the tetraploid F. pallens within the whole distribution range (Šmarda and Bureš, 2006), the results indicate that similar variation in genome size may occur in a single population, and a great deal of this variation may occur even among the offspring of a single maternal plant. This variation also forms a great portion of the genome size variation recorded within the whole Festuca section Festuca, being about 1·245-fold among 57 taxa measured thus far (Šmarda et al., 2008).
Fig. 4.
The maximum 1·188-fold difference in genome size within seedlings shown as clearly separated peaks. Results were obtained by simultaneous flow cytometry measurements of the two most contrasting seedlings.
Fig. 5.
Clear differences in genome sizes among the offspring of individual maternal plants, as evidenced by double-peaks or bimodal peaks in flow cytometry histograms. Results were obtained by simultaneous measurements of two contrasting seedlings. Seedling numbers are indicated at each peak (maternal plant number-seedling serial number). The peak ratio is given above particular histograms.
Fig. 6.
Comparison of probability distributions of genome sizes in seedlings and adult plants in the study site. (A) The raw data from 562 seedlings and 171 adult plants; (B) the sum of 1000 simulations including 171 values from both datasets (see Supplementary Information available online). Data are fitted with the extreme value (Gumbel) distribution function. The simulated data (B) shows the effect of stabilizing selection on genome size during the development of seedlings.
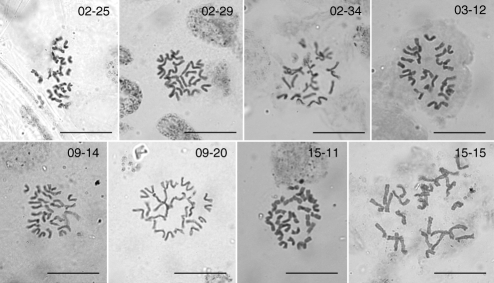
By counting chromosomes of eight seedlings with contrasting genome sizes (Fig. 7), this variation was shown to be not caused by chromosome number irregularities. The main reason for such variation may be in the amount of repetitive DNA, especially retrotransposons, which is known to be a frequent source of genome size variation in grasses (SanMiguel and Bennetzen, 1998; Gaut, 2002; Li et al., 2004) and other angiosperms (Bennetzen et al., 2005; Vitte and Panaud, 2005; Vitte and Bennetzen, 2006).
Fig. 7.
Somatic metaphases in root tips of eight seedlings with contrasting genome sizes. All samples had the same chromosome number, 2n = 28. Scale bars = 20 µm.
Genome size dynamics, inheritance and the role of stabilizing selection
To observe the dynamics of genome size in a population, genome sizes of seedlings were compared with those of 171 adult plants collected randomly over the whole locality in a previous study (Šmarda et al., 2007a). Simulations showed that extremely small or large genomes occur in seedlings with higher frequencies than in the population of adult plants, and that genome size range in seedlings is on average larger (about 1·05-fold) than in adult plants (P < 0·001; Fig. 6B). This provides clear evidence for the existence of stabilizing selection on genome size during the development of seedlings. The existence of such selection is important for the restriction of genome size variation generated within a population, and for stabilizing genome size within a species. As adult tussocks of F. pallens are usually tens of years old, the reduced variation in genome size among adult plants across the study site is an ‘average’ effect of long-term selection pressure. In annual plants the trend for this selection may vary in different years and under extreme environmental conditions, as documented by the differences in genome sizes of the same populations of the annual Microseris douglasii between wet and extreme drought years (Price et al., 1986). However, similar differences in genome size that were reported as being correlated with ecological conditions were repeatedly disproved by the application of more accurate methods (Greilhuber, 1998, 2005), and the question of seasonal or ecological variation in the trend for selection on genome size remains unanswered.
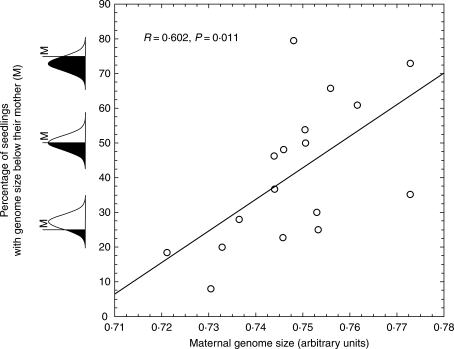
In the F. pallens population studied, the median genome size of the offspring was positively correlated with the genome size of their maternal plants (R = 0·817, P < 0·001). However, the genome sizes of the offspring of particular plants were shifted towards the population median of adult plants (Šmarda et al., 2007a), and this shift was larger with increasing differences between the genome size of the maternal plant and the population median (P = 0·011; Fig. 8). As F. pallens is predominantly allogamous, with only 0–2% of florets capable of producing seeds from selfing (Auquier, 1977), this shift is assumed to be an effect of paternal genomes. The progeny from intraspecific crossings vary in genome size between parental genomes (Price et al., 1983; Rayburn et al., 1993), and the likelihood that a floret is pollinated by a pollen grain with a smaller or larger genome than that of the maternal plant increases with an increasing difference between the genome size of a particular maternal plant and the population average. This is true because the genome size of pollen grains necessarily has a distribution similar to the genome size of the entire population.
Fig. 8.
Correlation of the maternal genome size and the percentage of seedlings with genomes smaller than that of their mother (in black). Although maternal and seedling genome sizes were highly correlated, this graph shows that the genome sizes of the offspring of maternal plants with smaller or larger genomes were shifted towards the population median, and that this shift was larger with an increasing difference between the genome size of the maternal plant and the population median. This shift is assumed to be an effect of available paternal genomes.
The variation in genome size of the progeny from intraspecific crossings of plants with different, or even with the same, genome sizes (Price et al., 1983; Rayburn et al., 1993) may be explained by the segregation of homeologous chromosomes of different sizes, as assumed by crossing experiments in Lolium (Gupta and Rees, 1975; Hutchinson et al., 1979). Hypothetically, all gametic chromosomal combinations that might have given rise to a particular plant (in the population studied such a plant originated with high probability from the crossing of parents differing in genome size) may appear in gametes produced by this plant. Theoretically, this mechanism would ensure that seedlings will have genome size variation equal to the adult plants. In F. pallens this may be the reason for the very similar maximum differences in genome sizes observed within progeny of a single maternal plant (1·119-fold) and that of the entire population of adult plants (1·115-fold; Šmarda et al., 2007a). In the absence of direct selection, the described mechanism makes possible the fixation and long-term persistence of genome size variation once generated. If this were a common case in F. pallens, it could explain the frequently observed occurrence of intrapopulation variation in genome size in this species (cf. Šmarda and Bureš, 2006).
Although the above scenario potentially explains the up to 1·115-fold variation observed within adult plants, it does not cover the overall 1·188-fold variation within the entire offspring population. One of the reasons may be that the population studied is a remnant of a historically more variable one, influenced by ongoing stabilizing selection. However, this explanation would contradict the fact that (1) the variation observed in the offspring of the population studied is larger than that observed among all individuals studied from the entire distribution range of the species, and (2) the recent genome sizes found in the locality are the highest among all tetraploids (cf. Šmarda and Bureš 2006). Therefore, this unexpected variation may be a consequence of a recently induced genome size variation, e.g. by retrotransposon activity, as shown in another climatically contrasting site for Hordeum spontaneum (Kalendar et al., 2000).
Effect of genome size on development rate
Using number of leaves in seedlings as a measure of relative development rate, a positive correlation of this parameter with genome size was found (P < 0·02). Rapid growth may offer a competitive advantage in grasslands (Silvertown and Lovett Doust, 1993) and increase the probability of seedling establishment in extreme rocky habitats where suitable growth conditions usually last for a short time. The competitive advantage or higher survival rate of large genomes may be one of the main reasons for their higher proportion within the population and therefore explain (1) the positively skewed statistical distribution of genome sizes, and (2) the increase in genome size when compared with geographically proximate populations (cf. Šmarda and Bureš, 2006).
The selective advantage of large genomes in the population studied is in contrast to (1) nucleotype theory that expects slower development of plants with larger genomes owing to the increased replication cost of larger amounts of DNA during mitosis and meiosis (Bennett, 1971; Evans and Rees, 1971) and (2) the prevalence of smaller genomes within F. pallens populations in non-relict habitats and in the north-western part of its distribution range (Šmarda and Bureš, 2006), an area strongly influenced by the last glaciation (Lang, 1994). At present, we can only speculate about the molecular basis of this correlation as it may also reflect the polyploid origin of the population studied. Further research should examine whether this pattern is more widespread.
SUPPLEMENTARY INFORMATION
Supplementary Information is available online at www.aob.oxfordjournals.org/ and gives results for (1) individual flow cytometry measurements with DAPI dye, (2) summary of these measurements for each maternal plant, and (3) average sample/standard ratios from parallel measurements of samples with DAPI and PI dyes.
ACKNOWLEDGEMENTS
This project was supported by the Ministry of Education, Youth and Sports (grants MSM0021622416 and LC06073) and the Czech Science Foundation (grant GAČR 206/08/P222).
LITERATURE CITED
- Auquier P. Biology and reproduction of Festuca L. (Poaceae): 1. pollination systems (In French) Bulletin du Jardin botanique national de Belgique. 1977;110:129–150. [Google Scholar]
- Bennett MD. Duration of meiosis. Proceedings of the Royal Society of London, series B. 1971;178:277–299. [Google Scholar]
- Bennett MD, Leitch IL. Plant DNA C-value Database. 2005. http://data.kew.org/cvalues/homepage.html .
- Bennetzen JL. Mechanisms and rates of genome expansion and contraction in flowering plants. Genetica. 2002;115:29–36. doi: 10.1023/a:1016015913350. [DOI] [PubMed] [Google Scholar]
- Bennetzen JL, Ma J, Devos KM. Mechanisms of recent genome size variation in flowering plants. Annals of Botany. 2005;95:127–132. doi: 10.1093/aob/mci008. [DOI] [PMC free article] [PubMed] [Google Scholar]
- Doležel J, Gödhe W. Sex determination in dioecious plants Melandrium album and M. rubrum using high-resolution flow-cytometry. Cytometry. 1995;19:103–106. doi: 10.1002/cyto.990190203. [DOI] [PubMed] [Google Scholar]
- Evans GM, Rees H. Mitotic cycles in dicotyledons and monocotyledons. Nature. 1971;233:350–351. doi: 10.1038/233350a0. [DOI] [PubMed] [Google Scholar]
- Gaut BS. Evolutionary dynamics of grass genome. New Phytologist. 2002;154:15–28. [Google Scholar]
- Gregory TR, Nicol JA, Tamm H, Kullman B, Kullman K, Leitch IJ, et al. Eukaryotic genome size databases. Nucleic Acids Research. 2007;35(Sp. Iss.):D332–D338. doi: 10.1093/nar/gkl828. [DOI] [PMC free article] [PubMed] [Google Scholar]
- Greilhuber J. Intraspecific variation in genome size: a critical reassessment. Annals of Botany. 1998;82(Suppl. A):27–35. [Google Scholar]
- Greilhuber J. Intraspecific variation in genome size in Angiosperms: identifying its existence. Annals of Botany. 2005;95:91–98. doi: 10.1093/aob/mci004. [DOI] [PMC free article] [PubMed] [Google Scholar]
- Greilhuber J, Temsch EM, Loureiro JCM. Nuclear DNA content measurement. In: Doležel J, Greilhuber J, Suda J, editors. Flow cytometry with plant cells: analysis of genes, chromosomes and genomes. Weinheim, Germany: Wiley-VCH; 2007. pp. 67–101. [Google Scholar]
- Gupta PK, Rees H. Tolerance of Lolium hybrids to quantitative variation in nuclear DNA. Nature. 1975;257:587–588. doi: 10.1038/257587a0. [DOI] [PubMed] [Google Scholar]
- Hutchinson J, Rees H, Seal G. An assay of the activity of supplementary DNA in Lolium. Heredity. 1979;43:411–421. [Google Scholar]
- Kalendar R, Tanskanen J, Immonen S, Nevo E, Schulman AH. Genome evolution of wild barley (Hordeum spontaneum) by BARE-1 retrotransposon dynamics in response to sharp microclimatic divergence. Proceedings of the National Academy of Sciences of the USA. 2000;97:6603–6607. doi: 10.1073/pnas.110587497. [DOI] [PMC free article] [PubMed] [Google Scholar]
- Lang G. Quartäre Vegetationsgeschichte Europas. Jena: Gustav Fischer; 1994. [Google Scholar]
- Leitch IJ, Soltis DE, Soltis PS, Bennett MD. Evolution of DNA amounts across land plants (embryophyta) Annals of Botany. 2005;95:207–217. doi: 10.1093/aob/mci014. [DOI] [PMC free article] [PubMed] [Google Scholar]
- Li W, Zhang P, Fellers JP, Friebe B, Gill BS. Sequence composition, organisation, and evolution of the core Triticeae genome. Plant Journal. 2004;40:500–511. doi: 10.1111/j.1365-313X.2004.02228.x. [DOI] [PubMed] [Google Scholar]
- McMaster GS. Phenology, development, and growth of the wheat (Triticum aestivum L.) shoot apex: a review. Advances in Agronomy. 1997;59:63–118. [Google Scholar]
- McMaster GS. Phytomers, phyllochrons, phenology and temperate cereal development. Journal of Agricultural Science. 2005;143:137–150. [Google Scholar]
- Michaelson MJ, Price HJ, Ellison JR, Johnston JS. Comparison of plant DNA contents determined by Feulgen microspectrophotometry and laser flow-cytometry. American Journal of Botany. 1991;78:183–188. [Google Scholar]
- Nemoto K, Morita S, Baba T. Shoot and root development in rice related to the phyllochron. Crop Science. 1995;35:24–29. [Google Scholar]
- Price HJ, Chambers KL, Bachmann K, Riggs J. Inheritance of nuclear 2C DNA content variation in intraspecific and interspecific hybrids of Microseris (Asteraceae) American Journal of Botany. 1983;70:1133–1138. [Google Scholar]
- Price HJ, Chambers KL, Bachmann K, Riggs J. Patterns of mean nuclear DNA content in Microseris douglasii (Asteraceae) Botanical Gazette. 1986;147:496–507. [Google Scholar]
- Rayburn AL, Birdar DP, Bullock DG, McMurphy LM. Nuclear DNA content in F1 hybrids of maize. Heredity. 1993;70:294–300. [Google Scholar]
- SanMiguel P, Bennetzen JL. Evidence that a recent increase in maize genome size was caused by the massive amplification of intergene retrotransposons. Annals of Botany. 1998;82:37–44. [Google Scholar]
- SanMiguel P, Tikhonov A, Jin YK, Motchoulskaia N, Zakharov D, MelakeBerhan A, et al. Nested retrotransposons in the intergenic regions of the maize genome. Science. 1996;274:765–768. doi: 10.1126/science.274.5288.765. [DOI] [PubMed] [Google Scholar]
- Silvertown JW, Lovett Doust J. Introduction to plant population biology. Oxford: Blackwell Scientific Publications; 1993. [Google Scholar]
- Šmarda P. DNA ploidy levels and intraspecific DNA content variability in Romanian fescues (Festuca, Poaceae) measured in fresh and herbarium material. Folia Geobotanica. 2006;41:417–432. [Google Scholar]
- Šmarda P, Bureš P. Intraspecific DNA content variability in Festuca pallens on different geographical scales and ploidy levels. Annals of Botany. 2006;98:665–678. doi: 10.1093/aob/mcl150. [DOI] [PMC free article] [PubMed] [Google Scholar]
- Šmarda P, Kočí K. Chromosome number variability in Central European members of the Festuca ovina and F. pallens groups (sect. Festuca) Folia Geobotanica. 2003;38:65–95. [Google Scholar]
- Šmarda P, Bureš P, Horová L. Random distribution pattern and non-adaptivity of genome size in a highly variable population of Festuca pallens. Annals of Botany. 2007;a 100:141–150. doi: 10.1093/aob/mcm095. [DOI] [PMC free article] [PubMed] [Google Scholar]
- Šmarda P, Šmerda J, Knoll A, Bureš P, Danihelka J. Revision of Central European taxa of Festuca ser. Psammophilae Pawlus: morphometrical, karyological and AFLP analysis. Plant Systematics and Evolution. 2007;b 266:197–232. [Google Scholar]
- Šmarda P, Bureš P, Horová L. Genome size and GC content evolution of Festuca: ancestral expansion and subsequent reduction. Annals of Botany. 2008;101:421–433. doi: 10.1093/aob/mcm307. [DOI] [PMC free article] [PubMed] [Google Scholar]
- StatSoft, Inc. STATISTICA (data analysis software system), version 7.1. 2005. http://www.statsoft.com .
- Vitte C, Bennetzen JL. Analysis of retrotransposon structural diversity uncovers properties and propensities in angiosperm genome evolution. Proceedings of the National Academy of Sciences of the United States of America. 2006;103:17638–17643. doi: 10.1073/pnas.0605618103. [DOI] [PMC free article] [PubMed] [Google Scholar]
- Vitte C, Panaud O. LTR retrotransposons and flowering plant genome size: emergence of the increase/decrease model. Cytogenetic and Genome Research. 2005;110:91–107. doi: 10.1159/000084941. [DOI] [PubMed] [Google Scholar]


