

Abstract
Data from three previous experiments were analyzed to test the hypothesis that brain waves of spoken or written words can be represented by the superposition of a few sine waves. First, we averaged the data over trials and a set of subjects, and, in one case, over experimental conditions as well. Next we applied a Fourier transform to the averaged data and selected those frequencies with high energy, in no case more than nine in number. The superpositions of these selected sine waves were taken as prototypes. The averaged unfiltered data were the test samples. The prototypes were used to classify the test samples according to a least-squares criterion of fit. The results were seven of seven correct classifications for the first experiment using only three frequencies, six of eight for the second experiment using nine frequencies, and eight of eight for the third experiment using five frequencies.
In our earlier analyses (1–4) of brain-wave representations of words and sentences, based on electroencephalographic (EEG) data, we averaged over trials as well as subjects and made a discrete fast Fourier transform (FFT) to the frequency domain. We then searched for a filter that optimized correct recognition of the words or sentences being processed. Using filters to eliminate noise from signals is widespread in many kinds of signal processing. When speech or music constitutes the signals, such filters not only work well but are practically necessary because of the large number of component waves.
The optimal filters we found in our earlier studies usually fell well within the range 2–15 Hz. So by using the standard software for discrete FFTs with a sampling rate between 600 and 1,000 Hz, we in fact were ordinarily using a filter that contained less than 60 discrete frequencies. This relatively small number of frequencies immediately suggests an alternative to filtering for our EEG-recorded brain waves: to look at the frequencies with comparatively large amplitudes, select a small set of these, and use their superposition instead of a filter. So for each observation i, the superposition wave Si is just
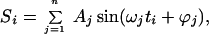 |
where Aj, ωj, and ϕj are the amplitude (in microvolts), frequency (in radians/s), and phase (in radians) of the jth sine wave. Superposition of continuous light waves is familiar from classical optics in the study of diffraction and interference. Here we use discrete wave representations to match our discrete fast Fourier transforms. For simplicity of comparison, we report only relative amplitudes, not microvolt calibrations, for all three experiments, performed with three different EEG systems. We note that the least-squares criterion of fit used in all our analyses is invariant under a change of the units in which amplitude is measured.
For the reason already stated, such superpositions are uncommon in standard signal processing, but in our special low-frequency environment, they can work very well. Moreover, to represent a word by a small set of superposed pure sine functions gives a definite sense of the minimum number of parameters needed for the invariant brain waves that seem to characterize rather well the words we have studied. To be explicit, each sine wave j in the superposition is characterized completely by Aj, ωj, and ϕj. For superpositions made up of five frequencies, this yields a 15-parameter representation, which is certainly not enough to represent the spectral analysis of any spoken word and is thereby testimony to the simplifying transformations imposed by the auditory system on a sound-pressure wave as it reaches the cortex.
When we referred to “invariant” brain waves above, we had in mind the extensive averaging over trials and subjects used to obtain an invariant result. Such averaging can eliminate more than noise, for the unaveraged signals may well contain much additional information, such as individual associations, not needed to identify the word itself. At present, our success in correct recognition of what word or sentence is represented depends on using such averaging (3).
Our focus entirely on waves as the real communication setup physically, with no reference to populations of neurons and their intermittent spiking, may make some readers skeptical of our results. We certainly believe the waves we find in the observed EEG data arise from the spiking activity of many neurons as their source. We do not consider in the present framework whether there is a more fundamental way, at least in principle, to observe more directly for cognitive purposes the collective activity of the neurons handling speech, although this is an important question.
We report on no new experimental data in this article, but rather analyze, in terms of superpositions of pure sine waves, data from experiments already reported. We begin with the seven words that served as stimuli in the first experiment (1). We next examine eight syllables from ref. 3. Finally, we analyze the eight color and shape words used in ref. 4. To illustrate various aspects of superpositions, we consider the data from several different angles.
General Methods of Analysis.
After applying an FFT to the averaged EEG data, we selected high-energy frequencies for the superposition wave representing a given word. Our criteria for selecting these frequencies were the following:
(i) We excluded any frequencies below 1.5 Hz as being too low, or, in the case of the large direct-current amplitude at 0 Hz, as being irrelevant for classification or prediction;
(ii) On the basis of our earlier studies (1–4), we excluded any frequencies equal to or greater than 20 Hz;
(iii) A frequency selected must be a local maximum in its amplitude;
(iv) When two local maxima were separated by only one frequency in the discrete FFT, we used only the one with higher amplitude, and if the amplitudes were the same, we selected the higher frequency;
(v) For superposition of n frequencies, a frequency selected must be one of the n highest local maxima, subject to the exclusion of iv.
Subjects were numbered consecutively and sometimes were used in more than one of the earlier studies (1–4). The same numbering is used in this article. The sensors referred to follow the nomenclature of the standard EEG 10–20 system.
Results
Seven Words.
In our first experimental study (1), we presented auditorily seven words to subjects in 100 randomized trials for each word. We recorded, by using the standard 10–20 EEG system, the subjects' brain waves beginning shortly before the onset of each verbal stimulus. By using the EEG data of the best sensor C4 for recognizing the seven words first, second, third, yes, no, right, and left, we applied the method of superposition described above. First, we averaged the unfiltered EEG data for subjects S3, S4, and S5, which yielded 300 trials for each stimulus word presented auditorily. These data were the test samples. We next applied an FFT to these averaged data for each word, and we selected for each word, by using the criteria stated earlier, the seven frequencies, i.e., sine waves with the highest energy from the less than 60 frequencies computed by the discrete FFT with a difference of 0.662 Hz between successive frequencies. As an example, the frequency-domain graph of the relative amplitude for the auditory word first is shown in Fig. 1.
Figure 1.

Graph in the frequency domain of the FFT of the averaged data for the word first, with discrete frequencies shown on the x axis in hertz and the amplitudes of the frequencies on the y axis in relative amplitude.
By using the superposition of the seven selected sine waves now as a prototype for each word, we classified the test samples consisting of the unfiltered but averaged data described above. The criterion of fit, as in our previous work (1–4), was the minimum least squares of all observations over a selected temporal interval. For a number of intervals, we correctly classified all seven words.
To test how few superposed sine waves were required, we next systematically reduced the number of frequencies used in the superposition by deleting first the highest frequency from the seven for each word. With six superposed sine waves, we also correctly classified the test samples for all seven words. By deleting always the highest remaining frequency, we continued to classify correctly all seven words for five, four, or three frequencies. Finally, by using only the single remaining lowest two frequencies for each word, we correctly classified six of the seven words.
In Table 1, we show the superposed three lowest frequencies, their amplitudes, and their phases for each of the seven words. The selected frequencies all fall between 1.9 and 10.0 Hz, with more variation in phase than amplitude. The three selected for first, as shown in Table 1, are easily identified also in Fig. 1. In Fig. 2, the superposition of the lowest two, the lowest five, and the seven frequencies are shown in panels for six of the seven words. We omit the seventh one, for left, only to save space. The graphs for Fig. 2 are for one of the temporal intervals optimal for all superpositions, except the superposition of two frequencies. The temporal interval used was for 897 ms, beginning 132 ms after onset of stimulus. The interval for two frequencies was 750 ms, beginning at 132 ms.
Table 1.
Three frequencies selected for each of seven words
| Frequency in Hz | Relative amplitude | Phase in degrees | Frequency in Hz | Relative amplitude | Phase in degrees | |
|---|---|---|---|---|---|---|
| First | Yes | |||||
| 2.649 | 10.86 | −10.8 | 3.974 | 14.51 | −69.79 | |
| 4.636 | 13.74 | 26.8 | 5.298 | 10.90 | 151.69 | |
| 5.961 | 14.47 | −100.7 | 7.285 | 7.50 | 130.8 | |
| Second | No | |||||
| 3.312 | 11.01 | 105.0 | 2.649 | 14.02 | 52.8 | |
| 5.961 | 20.16 | −110.6 | 5.961 | 11.68 | −93.9 | |
| 9.935 | 4.89 | 137.1 | 9.935 | 4.94 | −99.8 | |
| Third | Right | |||||
| 4.636 | 17.03 | 12.6 | 1.987 | 10.57 | −166.1 | |
| 6.623 | 17.23 | 21.1 | 3.312 | 13.14 | 154.8 | |
| 8.610 | 12.72 | −5.3 | 4.636 | 13.00 | 46.2 | |
| Left | ||||||
| 3.312 | 15.70 | −170.9 | ||||
| 4.636 | 9.54 | 36.9 | ||||
| 7.285 | 9.57 | 139.3 | ||||
Figure 2.

Comparison of superposition of the two lowest frequencies (dashed line), superposition of five frequencies (solid line), and superposition of seven frequencies for six of the seven words (dotted line). The x axis is measured in milliseconds after the onset of the stimulus and the y axis in relative amplitude.
Eight Syllables.
In our third study (3), which followed the methods of the experiment with seven words (1), we presented eight auditory syllables and 24 syllable pairs instead of words. To the EEG data of the best sensor C3 from this experiment for the eight auditory syllables ba, pa, go, toe, boo, goo, poo, and to, we applied the method of superposition. Because this experiment was exploratory and fewer data were collected, our description of the results is brief. By using the data of subjects S7, S10, and S13, 75 trials were averaged for each of the syllables presented as auditory stimuli. From the FFT frequency-domain representation of the data, we selected nine high-energy frequencies according to the criteria given earlier. (We selected more frequencies for this experiment because of the small number of total trials for each syllable.) By using all of the data again to create eight unfiltered but averaged test samples and by applying a least-squares criterion of fit, we correctly classified six of the eight syllables. This is a reasonably good result but not as good as the use of an optimal filter, as in earlier articles (1–4). By using data from sensor C3 and the time interval from 107 ms after onset of stimuli to 640 ms, the optimal filtered result was classification of all eight unfiltered test samples correctly. We show in Fig. 3 the three waves, unfiltered test sample (dotted line), filtered prototype (dashed line), and superposition prototype (solid line), for the two syllables ba and poo, which were among those correctly classified.
Figure 3.

Comparison of superposition of nine frequencies (solid line), filtered prototype (dashed line), and unfiltered test sample (dotted line) for the two syllables ba and poo. The x axis is measured in milliseconds after the onset of the stimulus and the y axis in relative amplitude.
Visual Images and Their Names.
The same superposition procedure was applied to the EEG data of the experiment (4) on brain-wave recognition of eight visual images, which were four patches of color (blue, green, red, and yellow) and four shapes (circle, line, square, and triangle) and their eight names.
Condition I of each session presented visual images of colors and shapes. For example, the color red was represented by a blank screen with red background, and a square shape was represented by a white line drawing of a square displayed on the screen against a black background. The stimuli were presented in pairs, eight of colors and eight of shapes. Four pairs of each type were the same, and four were very different. The different color pairs were: blue–yellow, green–blue, red–green, and yellow–red. The different shape pairs were: circle–line, line–square, square–triangle, and triangle–circle. Condition I consisted of 15 blocks, each of which contained the same 16 pairs, but randomized in different order in different blocks. The randomization was restricted so that trials alternated between a pair of colors and a pair of shapes. In all three conditions, the subjects were asked to judge whether the two members of a pair were perceptually the same or different, an easy task in every trial.
Condition II of each session presented visual words and auditory words. Instead of visual images, we used auditory words, blue, etc., to represent the colors and visual words, circle, etc., displayed on the screen to represent the shapes. The rest of the experimental setup was the same as in condition I, except that there were only 12 blocks of 16 trials each. Because of the way we represented colors and shapes, trials within each block alternated not only in pairs of colors and pairs of shapes but also in pairs of auditory words and pairs of visual words.
Condition III was very similar to condition II, except that auditory words were shape words, and visual words were color words.
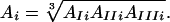
For each condition, we averaged the data and applied an FFT. We then computed the geometric average of the three amplitudes of each frequency, as measured in conditions I, II, and III, to take account of varying amplitudes of the EEG waves in response to three different kinds of stimuli. So for a given frequency i, the average amplitude Ai is the cube root of the product of the three amplitudes, i.e.,
 |
The averaging across the three conditions combined EEG-recorded brain waves produced by three very different kinds of stimuli, namely visual images, visual names of these images, and auditory words naming these images. We showed in an earlier article (4) that the brain waves for a given visual image and its auditorily or visually presented name were very similar. In this study, we took the further step of averaging all three conditions together as well as across subjects.
Our working hypothesis is that the more averaging, the simpler the invariant brain-wave representation obtained. In the present case, the averaging across conditions and subjects was based on 1,872 trials for each of the eight resulting waves. We selected, according to the criteria already listed, six fundamental frequencies for each of the eight visual image/names. Because all eight unfiltered test samples were classified correctly, we tried reducing the number of frequencies by deleting the highest frequency of the six, as in the first experiment. By using the superposed waves as prototypes, each based on the remaining five fundamental frequencies, the least-squares criterion of fit correctly classified all eight unfiltered test samples, as did the optimal filter (bipolar pair of sensors, C4-T4, 3–10 Hz) with both types of prototypes using 240 ms after onset of stimulus to 1,300 ms as the temporal interval. As can be seen from Table 2, both amplitudes and phases vary significantly for the same, or nearly the same, five frequencies.
Table 2.
Five frequencies selected for each image/name
| Frequency in Hz | Relative amplitude | Phase in degrees | Frequency in Hz | Relative amplitude | Phase in degrees | |
|---|---|---|---|---|---|---|
| Circle | Blue | |||||
| 1.953 | 13.42 | 43.1 | 1.953 | 2.18 | 23.9 | |
| 3.418 | 12.54 | 10.8 | 4.883 | 9.37 | −92.1 | |
| 4.395 | 13.39 | −174.5 | 7.813 | 11.58 | −144.0 | |
| 6.348 | 3.24 | −103.6 | 9.766 | 8.56 | −95.8 | |
| 8.301 | 12.41 | −56.4 | 11.719 | 8.34 | −105.4 | |
| Line | Green | |||||
| 1.953 | 35.79 | 51.6 | 3.906 | 6.46 | 110.9 | |
| 3.906 | 13.24 | 114.7 | 6.348 | 15.90 | −157.3 | |
| 6.348 | 7.18 | −161.9 | 9.277 | 7.32 | −177.7 | |
| 8.789 | 6.01 | 71.3 | 12.207 | 4.43 | −47.2 | |
| 10.254 | 3.61 | −95.1 | 13.672 | 1.38 | 28.3 | |
| Square | Red | |||||
| 2.441 | 14.35 | 93.5 | 1.953 | 3.24 | 48.4 | |
| 3.906 | 9.32 | 111.2 | 4.883 | 3.61 | −144.6 | |
| 5.859 | 8.38 | 136.6 | 6.348 | 12.87 | −158.5 | |
| 8.301 | 7.81 | −71.1 | 7.813 | 11.41 | −163.1 | |
| 9.766 | 6.23 | −18.9 | 10.742 | 3.88 | 179.7 | |
| Triangle | Yellow | |||||
| 2.441 | 12.04 | 107.9 | 1.953 | 19.09 | 107.1 | |
| 4.883 | 3.00 | −174.3 | 3.906 | 4.84 | 78.9 | |
| 6.348 | 8.09 | −137.3 | 5.859 | 12.23 | 107.2 | |
| 9.277 | 3.04 | −10.6 | 6.836 | 13.86 | −80.7 | |
| 10.742 | 2.20 | −113.8 | 7.813 | 9.89 | −171.1 | |
When we reduced the number of frequencies to four, we classified correctly seven of the eight prototypes and with only three frequencies, six of the eight prototypes.
In Fig. 4, we show for each of the eight image/names its unfiltered test sample (dotted line), superposition (solid line) of the five fundamental frequencies selected for each image/name, and the optimal filter (dashed line). Although both the superposition prototypes and the filter prototypes correctly classified all eight unfiltered test samples, small differences between the two types of prototypes are inevitable. The waves based on the optimal filter have more local maxima and minima, because they are based on the superposition of a much larger, but finite, number of frequencies.
Figure 4.

Comparison of superposition of five frequencies (solid line), filtered prototype (dashed line), and unfiltered test sample (dotted line) for the eight image/names. The x axis is measured in milliseconds after the onset of the stimulus and the y axis in relative amplitude.
A quantitative way of comparing the fits of the superposition prototypes to the filter prototypes is to compare the least-squares fit for each image/name. This is done in Table 3. Not surprisingly, the fit of the filter prototype is better for all eight image/names, but the average increase for the superposition prototype is just over 6%. The somewhat better fits for the filter prototypes are not surprising for two reasons. First, the filters use many more frequencies than five. Second, the bandpass filter is selected on the basis of an extended computation wholly focused on optimally fitting the unfiltered averaged data. In contrast, no such optimality computation was made in selecting the five frequencies on which the superpositions are based. They were selected only according to the general physical criteria stated earlier concerned with physical evidence of high energy, as exemplified in Fig. 1.
Table 3.
Comparison of least-squares fit
| Word | Filtered | Superposed |
|---|---|---|
| Circle | 10.55 | 11.00 |
| Line | 11.47 | 11.92 |
| Square | 4.76 | 5.70 |
| Triangle | 7.85 | 8.42 |
| Blue | 11.75 | 12.89 |
| Green | 12.07 | 12.86 |
| Red | 14.95 | 15.37 |
| Yellow | 15.93 | 16.17 |
Discussion
Because this article is, to our knowledge, one of the first attempts to represent recorded brain waves generated by verbal stimuli by superposition of a few sine waves, it seems appropriate to include several remarks about our approach and also to speculate on its wider application.
First, a completely different approach to superposition would be to estimate, purely statistically, for each prototype a fixed number of best frequencies with optimally fitted amplitudes and phases. But such a purely statistical approach, with no physical constraints, produces frequencies with wildly varying amplitudes that seem obviously implausible, even though very good fits are produced through interference of one frequency with another. In contrast, by using frequencies found in the Fourier analysis of the data, the case for their physical reality is clear.
On the other hand, using pure sine waves to represent the fundamental frequencies may seem unrealistic. Because there is a lot of evidence that the images of the stimuli we used last only for a second or so at most, a more obvious mathematical choice would be some kind of wavelet representation with a short temporal domain. There are now many types of wavelets, with accompanying software, available for such purposes (5, 6). In the end this may turn out to be the right approach, but our earlier efforts (2) to use wavelets did not improve on the Fourier results. For the present, we think the use of pure sine waves is an acceptable approximation for the short temporal length we consider, and, in fact, may be hard to improve on. A different problem that must be dealt with in a more complete model of the brain's processing is the damping of the activated image. But this extension presents no fundamental difficulty.
Second, in all three sets of data analyzed here, the optimal time interval selected for classifying a test sample seems too long for the processing of words occurring in continuous speech or in visual text that is read. The argument seems ironclad that in the process of listening to normal speech or reading, the waves in the cortex that represent the words must be processed approximately at the same rate as the spoken words or reading rate. But neither rate will require more than 300–500 ms per word, and often less will be required in reading. Our conjecture, already mentioned in an earlier study (3), is that mixed in with acoustical representation of a word in the cortex is other essential associated information that, in the case of many words, we would think of as semantic information broadly conceived. But squeezing down the representation of a word to the superposition of a few sine waves would seem to challenge this idea. Perhaps the conjectured information is carried simultaneously through the whole temporal interval. Our superposition may wipe it out, but we still do better in classifying with the superposition prototypes when there is a longer time interval for fitting. There is much here that we do not yet understand but that is amenable to extensive experimental investigation with our current methods.
Third, we see in the superpositions no evidence for the detailed nature of the spectrograms of spoken words, as analyzed extensively by linguists (7). This puzzle is most apparent in our experiment with simple syllables as stimuli. Yet in normal circumstances the difference, for example, between the initial voiced consonant b and the voiceless consonant p is easily recognized in spectrograms. This is true as well of other contrasts in the eight auditory syllables we used as stimuli.
Fourth, it may be that the invariant waves we superpose constitute a kind of minimal representation of a word for rapid communication in the brain, but at the present stage of our knowledge, this idea is highly speculative; it should, however, also be open to experimental investigation with current technology.
Fifth, the robustness of the superpositions, especially in the image/name experiment, is surprising. Superposed prototypes, constructed from averaging not only data from different trials and subjects but clearly different stimuli—visual image, visual name, and spoken name—recognized without error the unfiltered test samples.
Finally, perhaps the most interesting and important question is whether the method of superposition we have used can be extended to many more words. Certainly in principle there is adequate robust variation in amplitude and phase across no more than the nine frequencies we used in the syllable study to represent in the cortex a large vocabulary. But the simple analysis of this potential does not go very far toward showing that this is how the brain works. A better basis for some optimism is the evident robustness and reliability of the recognition system for words in the cortex of normal persons listening or reading in many different circumstances. Fortunately, in this case also, our present experimental methods make this question susceptible to extended experimental investigation.
Acknowledgments
We thank Duncan Luce for many useful comments and suggestions. We also benefited from early discussions with Paul Lo and our preliminary computations with him. We thank Paul Dimitre for producing the four figures and Ann Gunderson for preparing the manuscript.
Abbreviations
- EEG
electroencephalographic
- FFT
fast Fourier transform
Footnotes
Article published online before print: Proc. Natl. Acad. Sci. USA, 10.1073/pnas.140228397.
Article and publication date are at www.pnas.org/cgi/doi/10.1073/pnas.140228397
References
- 1.Suppes P, Lu Z-L, Han B. Proc Natl Acad Sci USA. 1997;94:14965–14969. doi: 10.1073/pnas.94.26.14965. [DOI] [PMC free article] [PubMed] [Google Scholar]
- 2.Suppes P, Han B, Lu Z-L. Proc Natl Acad Sci USA. 1998;95:15861–15866. doi: 10.1073/pnas.95.26.15861. [DOI] [PMC free article] [PubMed] [Google Scholar]
- 3.Suppes P, Han B, Epelboim J, Lu Z-L. Proc Natl Acad Sci USA. 1999;96:12953–12958. doi: 10.1073/pnas.96.22.12953. [DOI] [PMC free article] [PubMed] [Google Scholar]
- 4.Suppes P, Han B, Epelboim J, Lu Z-L. Proc Natl Acad Sci USA. 1999;96:14658–14663. doi: 10.1073/pnas.96.25.14658. [DOI] [PMC free article] [PubMed] [Google Scholar]
- 5.Daubechies I. Ten Lectures on Wavelets. Philadelphia: Soc. Indust. Appl. Math.; 1992. [Google Scholar]
- 6.Bruce A, Gao H-Y. Applied Wavelet Analysis with S-PLUS. New York: Springer; 1996. [Google Scholar]
- 7.Fujimura O, Erickson D. In: The Handbook of Phonetic Sciences. Hardcastle W J, Laver J, editors. Oxford: Blackwell; 1997. [Google Scholar]