

Abstract
Accumulating evidence suggests that the overall level of cortical activation controlling a voluntary motor task that leads to significant muscle fatigue does not decrease as much as the activation level of the motoneuron pool projecting to the muscle. One possible explanation for this “muscle fatigue>cortical fatigue” phenomenon is that the brain is an organ with built-in redundancies: it has multiple motor centers and parallel pathways, and the center of activation may shift from one location to another when neurons in the previous location become fatigued. This hypothesis was tested by estimating the changes of source locations of high-density (64 channels) scalp electroencephalographic (EEG) signals collected during both fatigue and non-fatigue motor tasks. A current dipole model was used to estimate the EEG sources. The fatigue motor task induced significant muscle fatigue, and the non-fatigue task did not. The EEG signal source that indicated the center of brain activation showed substantial location shifts during the fatigue motor task. The shifts could not be explained by variations of source locations caused by error estimated from the non-fatigue task EEG and simulated data. Compared to the non-fatigue condition, the weighted-center of the source locations for all the participants shifted toward the right hemisphere (ipsilateral to the muscle activation), anterior, and inferior cortical regions under the fatigue condition. Fatigue did not alter dipole (source-signal) strength or the overall level of brain activation. The brain may avoid fatigue by shifting neuron populations that participate in a fatiguing motor task.
Keywords: dipole, electroencephalography (EEG), electromyography (EMG), handgrip force, maximal voluntary contraction (MVC), signal source
INTRODUCTION
Muscle fatigue is reflected by a reduction in force-generating capability of the muscle, which can lead to an increase in the chance of injury and a decrease in productivity and quality of life. Muscle fatigue can be categorized as being of central or peripheral origin, with a majority of cases involving both (Gandevia, 2001). Although mechanisms that contribute to muscle fatigue have been studied extensively (review: Enoka and Stuart, 1992; Fitts, 1994), the role of cortical centers in contributing to fatigue during voluntary motor tasks (e.g., whether the brain is able to generate constant descending commands) or in modulating muscle fatigue is still largely unknown.
Early human research, although lacked tools to directly assess central contributions to muscle fatigue, concluded that the primary sites of fatigue lie within muscle (Bigland-Ritchie, 1981; Edwards, 1981; Fitts, 1994; Merton, 1954). More recent investigations, however, suggest that significant fatigue occurs also at supraspinal levels (Butler et al., 2003; Di Lazzaro et al., 2003; Gandevia et al. 1996; Taylor et al., 2000). However, when examining studies that quantified both central and peripheral signal changes of the neuromuscular system, the data show that peripheral fatigue is more profound than central fatigue. For example, the force output at the end of a 3-min sustained maximal elbow flexion contraction declined more than 60% compared to the initial value, but the voluntary activation level of the muscle decreased less than 10% (Gandevia et al., 1996; Butler et al., 2003). Similarly, handgrip force decreased 60% following performance of 200 maximal handgrip contractions, but the brain signal showed only minimal reductions as measured by functional magnetic resonance imaging (fMRI) (Liu et al., 2005a) and movement-related cortical potential (MRCP) derived by averaging the contraction-triggered scalp EEG signals (Liu et al., 2005b). Thus, although central fatigue has been recognized, its severity is less than the fatigue observed at the peripheral level (e.g., indicated by force changes). This suggests that the primary mechanism contributing to fatigue induced by voluntary muscle actions is not of central origin.
Why is fatigue at the cortical level less severe than that at the muscular level? A hypothetic answer is that the brain is a redundant organ that has multiple motor control centers with parallel projections to motoneuron pools in the spinal cord; the availability of multiple cortical centers controlling one motor task or muscle group makes “shifting of activation center” possible among these centers to compensate for fatigue. Numerous studies have shown multiple brain region activation even in controlling non-fatigue, simple motor tasks (e.g., Dai et al., 2001; Liu et al., 2003). The concept of activation shifting as a strategy to prolong a motor task under the condition of muscle fatigue has been presented for a long time with limited evidence showing rotation of motor units (Sogaard, 1995), muscles (Côté et al., 2002) and cortical neurons (Belhaj-Saïf et al., 1996). The purpose of this study was to examine the “shifting of activation center” hypothesis by reconstructing time- or muscle fatigue-varying sources of high-resolution scalp EEG signals.
MATERIALS AND METHODS
Subjects and motor task
Seven healthy men participated in the study (age 33 ± 9 years, all right-handed). The experimental procedures were approved by the Institutional Review Board at The Cleveland Clinic Foundation. All subjects gave informed consent prior to their participation.
Each subject performed 200 intermittent handgrip maximal voluntary contractions (MVCs) of the right arm in a single session. Each contraction lasted 2 s, followed by a 5-s rest. To maintain correct timing of the contractions, subjects performed the contractions by following visual cues displayed on an oscilloscope screen. The visual cues were a series of traveling rectangular pulses, each of which was 2 s with a 5-s interval between pulses. The height of the pulses indicated the amplitude of the initial (non-fatigue) MVC force of the subject. Subjects performed each MVC trial by following the shape of each pulse and rested during the 5-s inter-trial interval. They were asked to exert the maximal force while avoiding unnecessary body movements. The handgrip force, electromyographic (EMG) signals, and scalp EEG data were recorded simultaneously (Liu et al., 2005b).
Six of the subjects (one could not come back) also participated in a control (non-fatigue) experiment in a separate session at least one week apart from the fatigue session. The control experiment also involved 200 handgrip MVCs but with a much longer rest period (30 s) following each MVC. Similar visual cues were provided, i.e., 2-s rectangular pulses and 30-s inter-trial intervals. The long rest period following each MVC was intended to minimize muscle fatigue.
Force and EMG data recording
The force data were recorded by a pressure transducer housed in a sealed hydraulic environment (Liu et al., 2000, 2002a). For each contraction, subjects gripped a bottle-like device that was connected to the transducer by a nylon tube filled with distilled water. When the device was gripped, the pressure change in the sealed space was sensed by the transducer. The transducer output was directed to a Spike 2 data acquisition system (version 3.05, Cambridge Electronic Design, Ltd., Cambridge, UK) and was sampled at 100 Hz.
Surface EMG signals were recorded from ten muscles from both arms, including three major muscles involved in the handgrip of the right arm: flexor digitorum superficialis (FDS), flexor digitorum profundus (FDP), and extensor digitorum (ED, antagonist). (For details of EMG recordings from the other muscles, see Liu et al. 2005b). The muscles were identified by palpating the muscles while subjects moved the appropriate joints. Bipolar electrodes (Ag-AgCl, 8-mm recording diameter, In Vivo Metric, Healdsburg, CA) were attached on skin overlaying each muscle. A reference electrode was placed on the skin overlaying the lateral epicondyle near the elbow joint of the right arm. The EMG data were amplified (x 1000; Neurodata Amplifiers, Model 15A, Grass-Telefactor, West Warwick, RI), band-pass filtered (3-1000 Hz), and recorded by the Spike 2 data acquisition system at a sampling rate of 2000 Hz.
The force, EMG, and EEG time courses were recorded throughout the experiment (Fig. 1). Initial handgrip MVC force was measured in each subject at the beginning of the experiment to normalize the subsequent force data, along with the FDS and FDP surface EMG signals. A brief MVC (3-5 s) of each of the other muscles or muscle groups was performed to record MVC EMG of those muscles (Liu et al., 2005b). These initial MVC EMG data of each muscle were used in the data analysis to normalize EMG signals of the same muscle obtained during the subsequent fatigue and non-fatigue contractions.
Fig. 1.
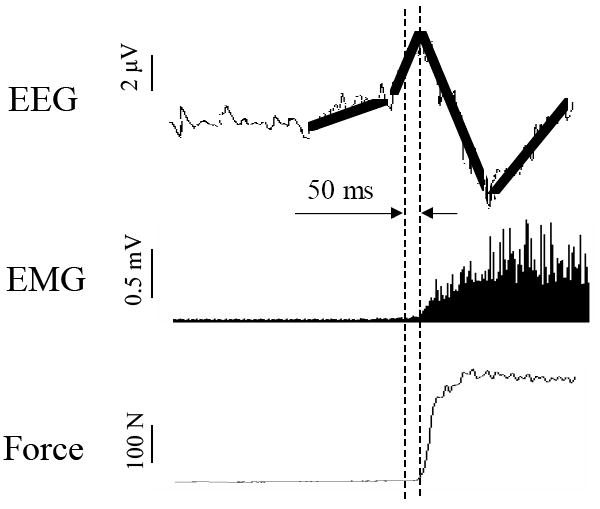
Illustration of EEG-derived MRCP (upper panel), EMG (middle panel) and force (lower panel) time courses. The MRCP profile shows that following a baseline, a slow- to fast-rising negative potential (NP) occurs before initiation of the muscle contraction. The MRCP was derived from EEG signals of the C3 electrode located roughly above the left sensoimotor area. The EMG was recorded from the flexor digitorum superficialis muscle. The dipole fitting was performed using data from −50 ms (indicated by the first vertical dashed line) to the peak of the NP (second vertical dashed line). Because this 50-ms period immediately precedes the muscle activation, it was thought that the NP within this time represented cortical activities associated with execution of the motor action.
EEG data recording
EEG signals were recorded from the scalp by a 64-channel NeuroSoft SYNAMPS system (version 4.2, NeuroScan, El Paso, Texas, USA). Subjects were seated in a position that allowed them to perform the handgrip task comfortably. The electrode cap that holds the 64 Ag-AgCl electrodes was placed onto each subject’s head based on the International 10-20 positioning method (Jasper, 1958). Conducting gel (Electro-gel™, Electro-Cap International, Inc., Eaton, OH, USA) was injected (by syringe) into the electrodes to connect the recording surface of each electrode with the scalp. The impedances of the EEG channels were maintained below 10 KΩ. One of the 64 electrodes (O2) was used to record the handgrip force such that the force could be used as the trigger signal for the EEG averaging (see below). The remaining 63 electrodes were referenced to the linked mastoids (M1 and M2). The EEG signals were band-pass filtered (0.05-50 Hz), amplified (x 75,000), and recorded on the hard disk of the computer at a sampling rate of 250 Hz. (Note that the same EEG data were analyzed in Liu et al. [2005b] to determine the effect of muscle fatigue [induced by the same handgrip MVC task] on frequency power of the EEG signals.)
Force and EMG data analysis
The force and EMG data were processed and analyzed using the Spike2 software package. For each trial, a mean value of the force was calculated from the data points that represented relatively stable force values (the ascending and descending portions of the force timecourse were excluded). The EMG data of each trial of each muscle were rectified and averaged over the same time period as force. The force and EMG values of individual trials were then averaged over each 40-contraction block, resulting in five data points across the 200 contractions (Fig. 2). The averaged force and EMG data were normalized to the corresponding initial MVC values. Finally, the normalized data were averaged across the subjects.
Fig. 2.
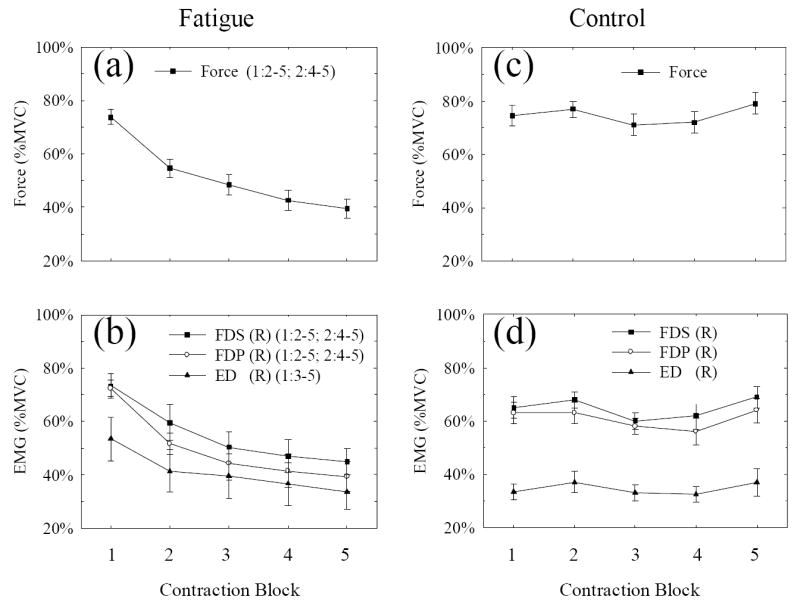
Force and EMG results under the fatigue (a and b) and non-fatigue (control, c and d) conditions. For the fatigue condition, each data point represents an average of 40 consecutive 2-s handgrip contractions with a 5-s inter-trial interval or rest. The time taken for each 40-trial block was 280 s. For the control condition, each data point represents an average of 40 consecutive 2-s handgrip contractions with a 30-s inter-trial interval or rest. The time taken for each 40-trial block was 1280 s. The force and EMG were normalized to their respective MVC values acquired at the beginning of the experiments. FDS, flexor digitorum superficialis; FDP, flexor digitorum profundus; ED, extensor digitorum; R, right arm. The statistical analysis results are shown at the right of the force (a) or each muscle EMG (b) symbol in the format of (k:m-n), where k indicates the data point to be compared and m-n indicates the data points (mth to nth) that showed significant changes relative to the kth data point (P ≤ 0.05). For example, in plot (a), (1:2-5) means that all data points from the 2nd to 5th are significantly different from the 1st data point. No significant changes were found in control data (c and d).
EEG source reconstruction
The raw EEG data were visually inspected and the trials with artifact caused by eye blinks, teeth biting, or head/body movements were excluded from further analysis. The EEG signals of each subject were trigger-averaged over the selected (clean) trials (ranged from 34 to 40 trials) in each 40-contraction data block. The timing of the trigger (time 0) corresponded to 20% of the initial MVC force in each trial. This triggered-average of EEG signals across trials in each block yielded so-called movement-related cortical potential (MRCP) directly related to the handgrip contraction (Liu et al., 2005b). A 50-ms time period preceding the MRCP peak was used for source reconstruction for each block of EEG data (Fig. 1). The MRCP signal within this period, roughly corresponding to the initiation of the muscle contraction, most likely represented cortical activities related to execution of the motor task (Hallett, 1994; Siemionow et al., 2000). However, a slight contribution from early sensory feedback to the MRCP signal in this time window cannot totally be ruled out.
Source reconstruction analysis was performed using the Curry software (Version 4.0, Compumedics Inc., El Paso, TX) (Wagner, 1998). Principal component analysis (PCA) was applied to the EEG signals and only components with a signal-to-noise ratio greater than 1.0 were retained (Lagerlund et al., 1997). A spherical volume conductor head model was adopted, which consisted of three compartments representing the brain, skull, and scalp (Niedermeyer and da Silva, 1999). The radii of the brain, skull, and scalp spheres were 76.2, 83.4, and 89.7 mm, respectively. The electrical conductivities of the brain and the scalp were 0.33 Ω-1m-1, and that of the skull was 0.0042 Ω-1m-1 (Mosher et al., 1999). A single moving current dipole model was used to best represent the overall brain activation center (Mosher et al., 1999; Yao and Dewald, 2005). The difference between the actual and modeled EEG signals were minimized to obtain the dipole parameters (location, strength, and orientation) using the Nelder-Mead downhill simplex minimization algorithm (Nelder and Mead, 1965). This was performed at each data point (4 ms per data point) within the selected 50-ms time window prior to the MRCP peak (Fig. 1), and the results were averaged to obtain one dipole for each contraction block.
Statistical analysis
Force, EMG, and the dipole strength during the course of the fatigue task were statistically analyzed using a general linear model for multivariate repeated measures (over time) followed by multiple comparisons among the data blocks (see Liu et al. 2005a,b for details). The significant different data blocks were denoted in the result figures (P ≤ 0.05). For each plot of source locations (X: left to right; Y: front to back; Z: bottom to top; Fig. 3), an ellipse representing the 95% confidence limit (i.e., region that statistically encloses 95% of the data points) was generated (see, e.g., Press et al. 1992 for details of the method). The areas and centers of the ellipses were determined so as to compare the differences between the fatigue and control conditions. Standard deviations (SD) of the source locations at the X, Y, and Z directions in the two conditions were plotted as a function of contraction block and linear regressions were performed to examine the effect of fatigue/contraction block on the SD (Fig. 4). The differences in the dipole strength and locations (X, Y, and Z, respectively) in the two conditions were also examined by unpaired t test (P ≤ 0.05). (Paired t test could not be performed because the number of subjects under the fatigue condition [n=7] differed from that under the non-fatigue condition [n=6]).
Fig. 3.
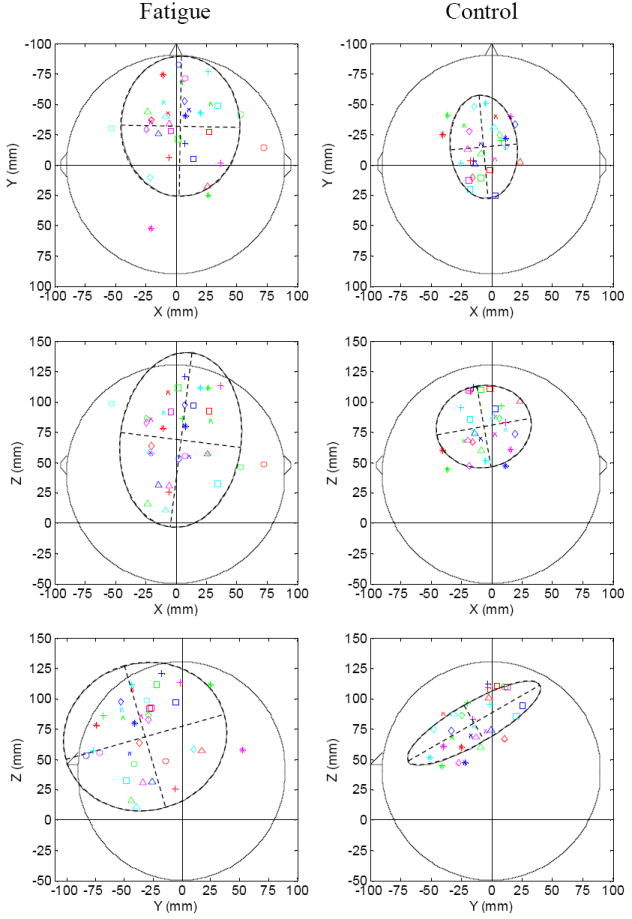
Single dipole plots showing locations of the center of brain activation. The locations of the moving dipoles are plotted in the X-Y (top row, top view), X-Z (middle row, back view), and Y-Z (bottom row, side view) planes. X: left to right; Y: front to back; Z: bottom to top. The triangles in the top and middle rows indicate the position of the nose, and positions of the ears are marked on two sides of each circle in the top and middle rows. In each plot, each subject is represented by a symbol, and each contraction block is represented by a color (block 1: dark blue; block 2: red; block 3: green; block 4: magenta; block 5: light blue). The ellipse in each plot represents the 95% confidence region that contains 95% of the data points in the data set. The dipole locations show much greater spatial dispersions for the fatigue (left column) than non-fatigue (right column) conditions. The centers (indicated by the cross points of the dashed straight lines) of the ellipses in the fatigue condition are located more toward the right hemisphere, anterior and inferior regions of the brain.
Fig. 4.

Standard deviations of dipole locations along time/block. The plots a, b, and c show standard deviations of the dipole locations at the X, Y, and Z axes respectively. The solid and open circles represent experimental data of the fatigue and control conditions, respectively. The dashed straight lines are linear regressions. R2 is the linearity of the fit and the slope of the fit indicates the trend of the data.
Error Estimation by Simulation
A simulation study was performed to estimate the error in source location and strength. A single dipole with assigned parameters was used to generate the EEG data at the electrode locations of the NeuroScan system. Random noise at a substantial level (~30% of the local field strength) was added to the simulated EEG data. The source was then determined from the noise-contaminated data using the same algorithm employed for the real EEG data. The simulation was performed 40 times; the locations and strengths of the fitted sources were averaged and the standard deviations were obtained.
RESULTS
Force and EMG
Despite the subjects’ maximal effort throughout the experiment, the force declined significantly, from ~80% (block 1) to ~40% (block 5) of the initial MVC level (Fig. 2a). The EMG signals of the two finger flexors (FDS and FDP) and the antagonist (ED) decreased in parallel with the force (Fig. 2b). The fatigue-related force and EMG changes were very similar to those from our previous studies involving similar MVC task protocols (Liu et al., 2005a). The declines in force and EMG were significant (P < 0.05) under the general linear model statistical analysis. There are significant differences between the early stage data (blocks 1 and 2) and later stage ones (blocks 3 to 5) detected by the multiple comparisons, indicating significant fatigue in the muscles. However, the force (Fig. 2c) and EMG (Fig. 2d) measured in the control (non-fatigue) experiment did not change significantly, indicating that the level of fatigue was similar among the five blocks of handgrip contractions. EMG results from the other seven finger, arm, and shoulder muscles of both the upper limbs did not change with fatigue (see Fig. 2 in Liu et al., 2005b); these EMG results ruled out the possibility of brain activation center shifting being contributed by altering activities of muscles other than major handgrip muscles of the performing limb.
EEG Source location and strength
The locations of the fitted dipoles are shown in Fig. 3 on the X-Y (upper panel, top view), X-Z (middle panel, back view), and Y-Z (lower panel, side view) planes. The locations of the dipoles during the fatigue task had large spatial dispersions, as if they moved from one region to another (standard deviations in X, Y, and Z directions were 22, 27, 24 mm, respectively; Table 1). However, the locations of the dipoles for the 5-trial blocks during the non-fatigue experiment showed limited variations (mean standard deviation = ~10 mm; Table 1), which were very similar to the variations caused by noise in the simulation experiment (mean standard deviation = ~12 mm; Table 1). This range (10-12 mm) of error is consistent with that found by other studies that analyzed either real or simulated data (Kristeva-Feige et al., 1997; Cuffin et al., 2001; Schaefer et al., 2002), which demonstrated that the source parameters could be repeatedly determined with reasonable accuracy. For example, Cuffin et al. (2001) estimated EEG source error to be about 11 mm using a source reconstruction algorithm similar to the one we used.
Table 1.
Results of source locations in real and simulated data.
| Fatigue experiment | Control experiment | |
|---|---|---|
| Area of the 95% confidence ellipse (mm2) | ||
| X-Y plane | 8,877 | 3,729 |
| X-Z plane | 11,356 | 4,181 |
| Y-Z plane | 13,621 | 3,354 |
| Center of the ellipse: i.e., average (X, Y, Z) in mm | ||
| (4, -31, 68) | (-6, -15, 79) | |
| Standard deviation of (X, Y, Z) in mm (real EEG data) | ||
| ± (22, 27, 24) | ± (10, 11, 10) | |
| Results of simulated noise-added data: (X, Y, Z) in mm | ||
| Assigned location: | (0, 0, 62) | |
| Fitted location: average | (-1, 4, 65) | |
| standard deviation: | ± (15, 13, 8) | |
The differences in the X, Y, and Z dipole locations between the fatigue and non-fatigue conditions were significant as revealed by unpaired t test (P = 0.026, 0.003, and 0.027 for X, Y, and Z planes, respectively). Correspondingly, the areas of the 95% confidence ellipses in the fatigue experiment were substantially larger than those in the non-fatigue experiment (Table 1). Compared to the non-fatigue condition, the centers of the ellipses in the fatigue condition were more towards the right (greater X), anterior (smaller Y) and inferior (smaller Z) regions of the brain (Table 1). It is worth noting that the comparison of the first-block data (early stage of fatigue) was not significant between the fatigue and non-fatigue conditions while the comparison of the fifth-block data was significant, meaning that the dipole location shift observed under the fatigue condition was indeed induced by fatigue. The data in Fig. 3 show that many activation center data points are located in the ipsilateral (right) hemisphere, even for the control data set; the center of the ellipse is close to the middle line (Fig. 3, upper and middle panels). There might be a number of reasons to explain this phenomenon. One is that although the control condition involved little fatigue, the motor activity was an MVC task that required the greatest output of control centers, which may have involved substantial activation in the ipsilateral sensorimotor regions. Other explanations may include errors of the inverse solution method and possible activations of the trunk and/or neck muscles during the maximal-effort handgrip contractions that would influence the dipole location.
Further analysis of standard deviation (SD) data of the source locations revealed that (i) the SD value in the fatigue condition was greater than the control condition in every contraction block at every axis (Fig. 4); (ii) in general, the difference in the SD between the two conditions became larger as fatigue became more severe (later blocks) in the fatigue condition; (iii) there was a strong trend of increase in the SD at all three directions (X, Y, and Z) with fatigue in the fatigue condition (Fig. 4, regression lines for the filled symbols) while the SD remained relatively stable in the non-fatigue/control condition (Fig. 4; regression lines for the open symbols). All the linear fits in the fatigue condition showed a positive (rising) slope, whereas the slope in the control condition remained relatively flat. Correlation analysis between the fatigue SD data (filled symbols in Fig. 4) and handgrip force results (Fig. 2a) showed high correlation values (X: r = -0.78, P = 0.06; Y: r = -0.83, P = 0.04; Z: r = -0.64, P = 0.13), indicating a relatively strong association between the level of fatigue (reduction of the force) and shift of the source location (increase of the SD).
In contrast to large-scale movements of the cortical activation center (large variation in the dipole location) during the fatigue process, the strength of the fitted dipoles under both fatigue and non-fatigue conditions remained at a relatively stable level across the 5-trial blocks (P = 0.4). There was also no significant difference in the dipole strength between the two conditions (P = 0.1; Fig. 5). Because the dipole strength was quite repeatable in the simulation study (standard error/mean = 21%, mean/true value-1= 12%), dipole strength results estimated based on the experimental data should be considered reliable. Thus, since the dipole strength indicates the overall cortical current density, the non-difference in dipole strength suggests that the amplitude of the cortical signal related to execution of the motor activity was not significantly affected by muscle fatigue.
Fig. 5.
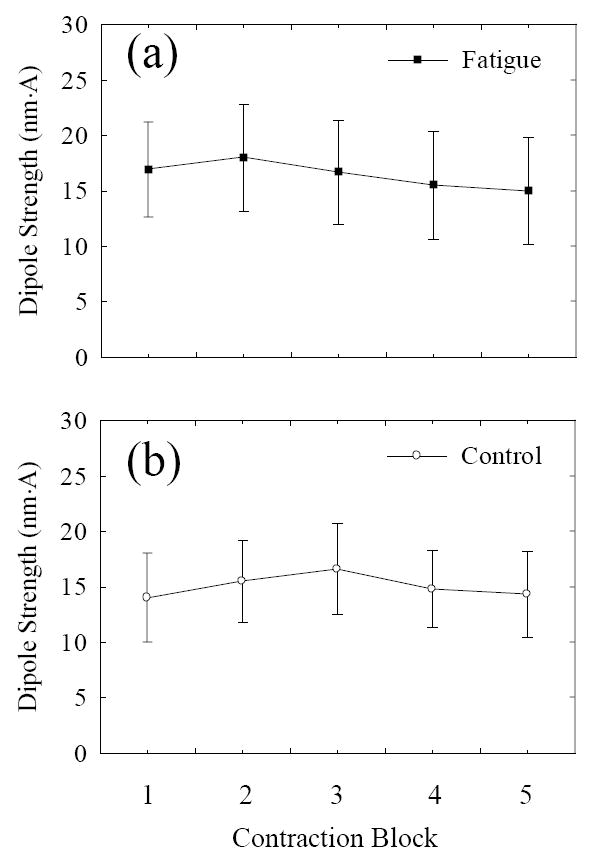
Dipole strengths as a function of time. (a) Fatigue condition, (b) control condition. No significant changes in dipole strength were found in both conditions, indicating that the amplitude of brain activation during the period of muscle-contraction execution was not affected by fatigue (a) or time (b).
DISCUSSION
The main findings of this study, compared to the control (non-fatigue) condition were that (1) the location of the center of cortical activation varied (shifted) significantly, (2) the group-weighted center of the activation (center of the ellipse) was located more towards the right, anterior and inferior regions of the brain, and (3) the strength of the EEG source signal (dipole) did not change with the fatigue condition.
The primary finding of this study is the shifting of the activation center of the brain associated with fatigue. Compared to the limited spatial distribution of the source locations in the non-fatigue task, the much larger dispersion of the dipole locations in the fatigue task suggests that the activation center or the region with the strongest activation varied with fatigue. This observation may be explained as a strategy of the brain to prolong the motor performance or maintain the muscle output after fatigue sets in. When one group of active cortical neurons became “fatigued”, another population of the cells might have taken over the function, and so on, so that the descending command to the motoneuron pool could continue without significant compromise. Fatigue of neurons could be contributed by intrinsic adaptations of the cells in responding to a continuous stimulation or static activation (Kernell and Monster, 1982; Sawczuk et al., 1995), reflex inhibition (Bigland-Ritchie et al., 1986; Woods et al., 1987), or input from other sources, such as sensory feedback (Garland and Kaufman, 1995).
Almost no information is available in the literature to suggest whether populations of cortical neurons shift to compensate for fatigue. Very limited studies have quantified cortical signal changes during muscle fatigue (Belhaj-Saïf et a., 1996; Dettmers et al., 1996; Liu et al., 2003), and only three involved fatigue with MVC tasks (Liu et al., 2002b, 2005a,b). Due to technical difficulties, none of these studies, however, were able to determine fatigue-related shifting of the activation source. A number of studies have reported activation rotation to compensate for fatigue at the muscular level during prolonged muscle activities at sub-maximal intensity, but none has done this at the maximal intensity level. For example, during the later portion of a 10-min sustained contraction of elevating the shoulder at about 5% maximal level, Westgaard and de Luca (1999) observed that low-threshold motor units of human trapezius muscle showed periods of inactivity and were substituted by motor units of higher recruitment threshold. This phenomenon was not noticed during the first few minutes of the contraction. The silenced motor units were reactivated after a period of “rest.” The authors speculated that the motor unit “substitution” protects motor units from excessive fatigue (Westgaard and de Luca, 1999). Another study (Sogaard, 1995) involved recording single motor units from elbow flexors during static and dynamic elbow flexion contractions of human participants at about 10% maximal intensity. The author noticed that a large proportion of motor unit activation was bursting activities. This observation was interpreted as rotations of activity between motor units because in some of the recordings, when one motor unit was recruited and increased its discharge rate, another motor unit showed decreases in firing rate and then stopped firing (Sogaard, 1995). These single motor unit studies were conducted at relative low muscle activation intensity levels with minimal to moderate induced muscle fatigue. It is expected that more severe fatigue occurs in prolonged maximal-intensity contractions, such as those adopted in our experiments and the “motor unit rotation” phenomenon could be more noticeable under this condition. However, single motor unit activities are difficult to be reliably recorded and discriminated during high-intensity muscle contractions or contractions with severe fatigue.
Rotation/shifting of muscles at different joints has also been seen to compensate for fatigue. When fatigue occurred during hopping activities, the participants relied on proportionally greater knee muscles compared to ankle muscles to accomplish the movements (Bonnard et al., 1994). During repetitive weightlifting, subjects tended to compensate for fatigue by decreasing the knee and hip extensor muscles while increasing the trunk motion (Sparto et al., 1997). Côté et al. (2002) compared multi-joint kinematics of non-fatigued and fatigued individuals while sawing. Muscle fatigue was associated with decreases in sawing force and movement amplitude at the elbow joint, whereas the basic characteristics of the saw trajectory, including the movement direction, extent and duration, remained consistent. This invariance was maintained by increasing the movement amplitude at the wrist, shoulder and trunk, indicating that muscles at these joints partially took over the function from the work previously performed by muscles at the elbow joint. The system thus takes the advantage of the redundancy of the motor apparatus to maintain the endpoint trajectory despite fatigue occurred in muscles at the elbow joint.
Compared to the non-fatigue condition, the centers of the ellipses or center of source locations pooled from all the data points in the fatigue condition shifted toward the right hemisphere, anterior and inferior regions of the brain. This right-, anterior- and inferior-ward center location change might be influenced by fatigue-induced activity augmentation in the ipsilateral (right) sensorimotor, prefrontal (anterior), and cingulate (inferior) cortices. As the level of activation was amplified in these regions of the participants, the weighted center would shift towards these cortical fields. This explanation is in accord with recent fMRI results that demonstrate acute functional adaptations of the brain during progressive muscle fatigue, in which the right sensorimotor, prefrontal (anterior direction), and cingulate (inferior direction) cortices increased activation level (measured by fMRI) with muscle fatigue in the right arm (Liu et al., 2003). Participation of the ipsilateral sensorimotor cortex in control of limb movements has been widely reported, and it has been speculated that an enhancement in the level of its activation occurs to compensate for fatigue (Liu et al., 2002b, 2003) or damage of the contralateral sensorimotor region (Newton et al., 2002; Staines et al., 2001; Ward et al., 2003). The importance of the prefrontal and cingulate cortices in motor control is well described in text books (e.g., Saper et al., 2000) and increases of activity in these association regions during fatigue were also explained as a way to compensate for fatigue-related reduction of activation in the primary motor regions (Liu et al., 2003).
The strength of the dipole was not changed by fatigue. Because the dipole strength was measured at a time immediately preceding the initiation of muscle activation, we argue that the dipole strength represented the overall cortical activation level associated with the muscle contraction execution. This result is consistent with former results obtained from fMRI and MRCP analyses. The fMRI signals, either in individual primary, secondary or association motor function-related regions or in the entire brain, experienced little change with muscle fatigue during a similar MVC handgrip task (Liu et al., 2005a). MRCP obtained from the same data used in current study also did not show significant fatigue-related change (Liu et al., 2005b). All these findings tend to suggest that fatigue imposes little effect on the overall strength of cortical activation. The finding of activation center shifting by this study provides a reasonable explanation of why the overall activation strength of the brain can be maintained under the condition of severe muscle fatigue.
This study estimated single dipole locations to illustrate fatigue-related shift of the center of cortical activation from one time point to another rather than making an endeavor to differentiate sources from various anatomical locations. The reasons for choosing the single-dipole model are twofold. First, our main purpose was to examine muscle fatigue-induced location changes of the overall activation center. Using a single dipole has conceptual advantages to depict overall dynamic functional adaptation of the brain in dealing with the fatigue effect. Second, this model is easier to apply than multiple-dipole models. Since each dipole has 6 degrees of freedom, an increase in the dipole number would substantially raise the computation time and error. This single-dipole approach has successfully been applied by former studies to approximate the accumulative activities of a large number of neurons (Mosher et al., 1999). Furthermore, since this is the first study on the issue of fatigue-induced cortical source adaptation, this single-dipole model, despite of its simplicity, serves the purpose of the study sufficiently.
In summary, this study found that a prolonged motor task involving maximal voluntary muscle contractions significantly fatigued the muscles. However, the overall brain activation level associated with control of the muscle contractions did not alter, which is consistent with many previous observations. The center of cortical activation estimated by reconstructing the EEG source location, however, shifted substantially from minimal to severely fatigued conditions. These results support the hypothesis of alternating cortical motor centers to compensate for fatigue and to maintain optimal descending output. The primary mechanism contributing to muscle fatigue seems to reside at sub-cortical levels of the neuromuscular system.
Acknowledgments
This work was supported by NIH grants (NS37400, HD36725), Department of Defense grant (DAMD17-01-1-0665), and the Risman Research and Development Fund at The Cleveland Clinic.
Footnotes
Publisher's Disclaimer: This is a PDF file of an unedited manuscript that has been accepted for publication. As a service to our customers we are providing this early version of the manuscript. The manuscript will undergo copyediting, typesetting, and review of the resulting proof before it is published in its final citable form. Please note that during the production process errors may be discovered which could affect the content, and all legal disclaimers that apply to the journal pertain.
References
- Belhaj-Saïf A, Fourment A, Maton B. Adaptation of the precentral cortical command to elbow muscle fatigue. Exp Brain Res. 1996;111:405–416. doi: 10.1007/BF00228729. [DOI] [PubMed] [Google Scholar]
- Bigland-Ritchie B. EMG/force relations and fatigue of human voluntary contractions. Exerc Sport Sci Rev. 1981;9:75–117. [PubMed] [Google Scholar]
- Bigland-Ritchie BR, Dawson NJ, Johansson RS, Lippold OC. Reflex origin for the slowing of motoneurone firing rates in fatigue of human voluntary contractions. J Physiol (Lond) 1986;379:451–459. doi: 10.1113/jphysiol.1986.sp016263. [DOI] [PMC free article] [PubMed] [Google Scholar]
- Bonnard M, Sirin AV, Oddsson L, Thorstensson A. Different strategies to compensate for the effects of fatigue revealed by neuromuscular adaptation processes in humans. Neurosci Lett. 1994;166:101–105. doi: 10.1016/0304-3940(94)90850-8. [DOI] [PubMed] [Google Scholar]
- Butler JE, Taylor JL, Gandevia SC. Responses of human motoneurons to corticospinal stimulation during maximal voluntary contractions and ischemia. J Neurosci. 2003;23:10224–10230. doi: 10.1523/JNEUROSCI.23-32-10224.2003. [DOI] [PMC free article] [PubMed] [Google Scholar]
- Côté JN, Mathieu PA, Levin MF, Feldman AG. Movement reorganization to compensate for fatigue during sawing. Exp Brain Res. 2002;146:394–398. doi: 10.1007/s00221-002-1186-6. [DOI] [PubMed] [Google Scholar]
- Cuffin BN, Schomer DL, Ives JR, Blume H. Experimental tests of EEG source localization accuracy in spherical head models. Clin Neurophysiol. 2001;112:46–51. doi: 10.1016/s1388-2457(00)00488-0. [DOI] [PubMed] [Google Scholar]
- Dai TH, Liu JZ, Sahgal V, Brown RW, Yue GH. Relationship between muscle output and functional MRI-measured brain activation. Exp Brain Res. 2001;140:290–300. doi: 10.1007/s002210100815. [DOI] [PubMed] [Google Scholar]
- Dettmers C, Lemon RN, Stephan KM, Fink GR, Frackowiak RS. Cerebral activation during the exertion of sustained static force in man. NeuroReport. 1996;7:2103–2110. doi: 10.1097/00001756-199609020-00008. [DOI] [PubMed] [Google Scholar]
- Di Lazzaro V, Oliviero A, Tonali PA, Mazzone P, Insola A, Pilato F, Saturno E, Dileone M, Rothwell JC. Direct demonstration of reduction of the output of the human motor cortex induced by a fatiguing muscle contraction. Exp Brain Res. 2003;149:535–538. doi: 10.1007/s00221-003-1408-6. [DOI] [PubMed] [Google Scholar]
- Edwards RHT. Human muscle function and fatigue. In: Porter R, Whelan J, editors. Human Muscle Fatigue: Physiological Mechanisms. London: Pitman Medical; 1981. pp. 1–18. [Google Scholar]
- Enoka RM, Stuart DG. Neurobiology of muscle fatigue. J Appl Physiol. 1992;72:1631–1648. doi: 10.1152/jappl.1992.72.5.1631. [DOI] [PubMed] [Google Scholar]
- Fitts RH. Celluar mechanisms of muscle fatigue. Physiol Rev. 1994;74:49–94. doi: 10.1152/physrev.1994.74.1.49. [DOI] [PubMed] [Google Scholar]
- Gandevia SC. Spinal and supraspinal factors in human muscle fatigue. Physiol Rev. 2001;81:1725–1789. doi: 10.1152/physrev.2001.81.4.1725. [DOI] [PubMed] [Google Scholar]
- Gandevia SC, Allen GM, Butler JE, Taylor JL. Supraspinal factors in human muscle fatigue: evidence for suboptimal output from the motor cortex. J Physiol (Lond) 1996;490:529–536. doi: 10.1113/jphysiol.1996.sp021164. [DOI] [PMC free article] [PubMed] [Google Scholar]
- Garland SJ, Kaufman MP. Role of muscle afferents in the inhibition of motoneurons during fatigue. Adv Exp Med Biol. 1995;384:271–278. doi: 10.1007/978-1-4899-1016-5_21. [DOI] [PubMed] [Google Scholar]
- Hallett M. Movement-related cortical potentials. Electromyogr Clin Neurophysiol. 1994;34:5–13. [PubMed] [Google Scholar]
- Jasper HH. Report of the Committee on Methods of Clinical Examination in Electroencephalography. Appendix: the ten-twenty electrode system of the International Federation. Electroencephalogr Clin Neurophysiol. 1958;10:370–375. [PubMed] [Google Scholar]
- Kernell D, Monster AW. Motoneurone properties and motor fatigue: an intracellular study of gastrocnemius motoneurones of the cat. Exp Brain Res. 1982;46:197–204. doi: 10.1007/BF00237177. [DOI] [PubMed] [Google Scholar]
- Kristeva-Feige R, Grimm C, Huppertz HJ, Otte M, Schreiber A, Jager D, Feige B, Buchert M, Hennig J, Mergner T, Lucking CH. Reproducibility and validity of electric source localization with high-resolution electroencephalography. Electroencephalogr Clin Neurophysiol. 1997;103:652–660. doi: 10.1016/s0013-4694(97)00085-0. [DOI] [PubMed] [Google Scholar]
- Lagerlund TD, Sharbrough FW, Busacker NE. Spatial filtering of multichannel electroencephalographic recordings through principal component analysis by singular value decomposition. J Clin Neurophysiol. 1997;14:73–82. doi: 10.1097/00004691-199701000-00007. [DOI] [PubMed] [Google Scholar]
- Liu JZ, Dai TH, Elster TH, Sahgal V, Brown RW, Yue GH. Simultaneous measurement of human joint force, surface electromyograms, and functional MRI-measured brain activation. J Neurosci Methods. 2000;101:49–57. doi: 10.1016/s0165-0270(00)00252-1. [DOI] [PubMed] [Google Scholar]
- Liu JZ, Zhang L, Yao B, Yue GH. Accessory hardware for neuromuscular measurements during functional MRI experiments. Magn Reson Mater Phys Biol Med. 2002a;13:164–171. doi: 10.1007/BF02678592. [DOI] [PubMed] [Google Scholar]
- Liu JZ, Dai TH, Sahgal V, Brown RW, Yue GH. Nonlinear cortical modulation of muscle fatigue: a functional MRI study. Brain Res. 2002b;957:320–329. doi: 10.1016/s0006-8993(02)03665-x. [DOI] [PubMed] [Google Scholar]
- Liu JZ, Shan ZY, Zhang LD, Sahgal V, Brown RW, Yue GH. Human brain activation during sustained and intermittent submaximal fatigue muscle contractions: an fMRI study. J Neurophysiol. 2003;90:300–312. doi: 10.1152/jn.00821.2002. [DOI] [PubMed] [Google Scholar]
- Liu JZ, Zhang L, Yao B, Sahgal V, Yue GH. Fatigue induced by intermittent maximal voluntary contractions is associated with significant losses in muscle output but limited reductions in functional MRI-measured brain activation level. Brain Res. 2005a;1040:44–54. doi: 10.1016/j.brainres.2005.01.059. [DOI] [PubMed] [Google Scholar]
- Liu JZ, Yao B, Siemionow V, Sahgal V, Wang X, Sun J, Yue GH. Fatigue induces greater brain signal reduction during sustained than preparation phase of maximal voluntary contraction. Brain Res. 2005b;1057:113–126. doi: 10.1016/j.brainres.2005.07.064. [DOI] [PubMed] [Google Scholar]
- Merton PA. Voluntary strength and fatigue. J Physiol (Lond) 1954;123:553–564. doi: 10.1113/jphysiol.1954.sp005070. [DOI] [PMC free article] [PubMed] [Google Scholar]
- Mosher JC, Leahy RM, Lewis PS. EEG and MEG: Forward solutions for inverse methods. IEEE Trans Biomed Eng. 1999;46:245–259. doi: 10.1109/10.748978. [DOI] [PubMed] [Google Scholar]
- Nelder JA, Mead R. A simplex method for function minimization. Comput J. 1965;7:308–313. [Google Scholar]
- Newton J, Sunderland A, Butterworth SE, Peters AM, Peck KK, Gowland PA. A pilot study of event-related functional magnetic resonance imaging of monitored wrist movements in patients with partial recovery. Stroke. 2002;33:2881–2887. doi: 10.1161/01.str.0000042660.38883.56. [DOI] [PubMed] [Google Scholar]
- Niedermeyer E, da Silva FL. Electroencephalography: Basic Principles, Clinical Applications, and Related Fields. 4. New York: Lippincott Williams & Wilkins; 1999. [Google Scholar]
- Press WH, Teukolsky SA, Vetterling WT, Flannery BP. Numerical recipes in C: the art of scientific computing. 2. Cambridge, UK: Cambridge University Press; 1992. Modeling of data; pp. 656–706. [Google Scholar]
- Saper CB, Iversen S, Frackowiak R. Integration of sensory and motor function. In: Kandel ER, Schwartz JH, Jessell TM, editors. Principles of Neuroscience. New York: Elsevier; 2000. pp. 349–380. [Google Scholar]
- Sawczuk A, Powers RK, Binder MD. Intrinsic properties of motoneurons: Implications for muscle fatigue. Adv Exp Med Biol. 1995;384:123–134. [PubMed] [Google Scholar]
- Schaefer M, Muhlnickel W, Grusser SM, Flor H. Reproducibility and stability of neuroelectric source imaging in primary somatosensory cortex. Brain Topogr. 2002;14:179–189. doi: 10.1023/a:1014598724094. [DOI] [PubMed] [Google Scholar]
- Siemionow V, Yue GH, Ranganathan VK, Liu JZ, Sahgal V. Relationship between motor activity-related cortical potential and voluntary muscle activation. Exp Brain Res. 2000;133:303–311. doi: 10.1007/s002210000382. [DOI] [PubMed] [Google Scholar]
- Sogaard K. Motor unit recruitment pattern during low-level static and dynamic contractions. Muscle Nerve. 1995;18:292–300. doi: 10.1002/mus.880180305. [DOI] [PubMed] [Google Scholar]
- Sparto PJ, Parnianpour M, Reinsel TE, Simon S. The effect of fatigue on multijoint kinematics and load sharing during a repetitive lifting test. Spine. 1997;22:2647–2654. doi: 10.1097/00007632-199711150-00013. [DOI] [PubMed] [Google Scholar]
- Staines WR, McIlroy WE, Graham SJ, Black SE. Bilateral movement enhances ipsilesional cortical activity in acute stroke: a pilot functional MRI study. Neurology. 2001;56:401–404. doi: 10.1212/wnl.56.3.401. [DOI] [PubMed] [Google Scholar]
- Taylor JL, Allen GM, Butler JE, Gandevia SC. Supraspinal fatigue during intermittent maximal voluntary contractions of the human elbow flexors. J Appl Physiol. 2000;89:305–313. doi: 10.1152/jappl.2000.89.1.305. [DOI] [PubMed] [Google Scholar]
- Wagner M. Rekonstruktion neuronaler Ströme aus bioelektrischen und biomagnetischen Messungen auf der aus MR-Bilden segmentierten Hirnrinde. Aachen, Germany: Shaker Verlag; 1998. [Google Scholar]
- Ward NS, Brown MM, Thompson AJ, Frackowiak RSJ. Neural correlates of outcome after stroke: a cross-sectional fMRI study. Brain. 2003;126:1430–1448. doi: 10.1093/brain/awg145. [DOI] [PMC free article] [PubMed] [Google Scholar]
- Westgaard RH, de Luca CJ. Motor unit substitution in long-duration contractions of the human trapezius muscle. J Neurophysiol. 1999;82:501–504. doi: 10.1152/jn.1999.82.1.501. [DOI] [PubMed] [Google Scholar]
- Woods JJ, Furbush F, Bigland-Ritchie B. Evidence for a fatigue-induced reflex inhibition of motoneuron firing rates. J Neurophysiol. 1987;58:125–37. doi: 10.1152/jn.1987.58.1.125. [DOI] [PubMed] [Google Scholar]
- Yao J, Dewald JP. Evaluation of different cortical source localization methods using simulated and experimental EEG data. Neuroimage. 2005;25:369–82. doi: 10.1016/j.neuroimage.2004.11.036. [DOI] [PubMed] [Google Scholar]