

I. THEORETICAL, EMPIRICAL, AND PRACTICAL RATIONALE
A fundamental quest of the developmental social and behavioral sciences is to specify the necessary and sufficient early experiences that lead to typical human development in childhood and adulthood. Because the opportunity to experimentally manipulate early human experiences is very limited, one approach is to observe the development and long-term outcomes of children who are tragically reared in atypically deficient early environments.
Unfortunately, these studies usually are limited by a variety of confounds (J. McCall, 1999), among them sample selection, selective adoption, and the multifaceted nature of the early experience. For example, children reared in substandard orphanages (i.e., those in which some aspect of care is substantially inferior to that suggested by best practices) display developmental delays in most physical and behavioral domains, and such children who are later adopted into advantaged homes have higher frequencies of extreme behaviors and problems than nonorphanage children. But are these contemporary and long-term outcomes associated with the particular children who are sent to orphanages (e.g., unusual prenatal exposure to drugs and alcohol, adverse birth circumstances) rather than the orphanage experience per se? Which aspects (e.g., deficiencies in nutrition, medical care, toys, equipment, social–emotional neglect, lack of experience with relationships, abuse) of what is usually a globally deficient orphanage environment are associated with these delays and long-term problems?
This monograph reports a study that comes closer to validating that one attribute of the orphanage environment, namely very limited caregiver–child social–emotional interactions and the lack of opportunity to develop caregiver–child relationships, can be responsible for contemporary delays in most major domains of development in institutionalized children.
Specifically, in a quasi-experimental design, two social–emotional interventions were introduced in orphanages for children birth to 48 months in St. Petersburg, Russian Federation, that otherwise had acceptable medical care, nutrition, sanitation, toys, equipment, and the absence of abuse but were primarily deficient in the children's social–emotional experience and opportunity for adult–child relationships. The results show substantial improvement in children's physical, mental, and social–emotional development; improvements for typical children and those with a variety of disabilities; and a dose–response effect for many developmental outcomes in which the more positive social–emotional experience given to children and the longer they spent in the interventions, the greater the developmental gains. These results substantiate the potential importance of early social–emotional experience and adult–child relationships for the contemporary development of young children in institutions.
THEORETICAL RATIONALE
Most developmental theories (e.g., psychoanalytic theory, Freud, 1940; social–cultural theory, Vygotsky, 1978; social-learning theory, Bandura, 1977; attachment theory, Bowlby, 1958) emphasize the importance of early social–emotional experience and the opportunity to experience human relationships for typical social and mental development. Attachment theory, in particular, focuses specifically on early experience with a few warm, caring, and socially–emotionally responsive adults who are relatively stable in the child's life as the foundation of appropriate social–emotional development and long-term mental health (e.g., Ainsworth, 1979; Ainsworth, Bell, & Stayton, 1974; Ainsworth, Blehar, Waters, & Wall, 1978; Bornstein & Tamis-LeMonda, 1989; Bowlby, 1958, 1969; Grusec & Lytton, 1988; Spitz, 1946; Sroufe, 1983; Sroufe, Carlson, Levy, & Egeland, 1999). Theoretically, an infant with a warm, responsive caregiver develops an internal working model of expectations for nurturing, supportive reactions from that caregiver, whom the infant comes to trust and use as a secure base from which to explore the social and physical world. Such experiences in turn promote the development of a sense of worthiness and self-esteem and appropriate long-term social–emotional development and mental health. Without the early experience of a few warm, caring, socially–emotionally responsive adults, long-term development may be compromised.
Meta-analyses and reviews of primarily correlational studies of home-reared children and their parents in a variety of countries substantiate several propositions that are consistent with attachment theory's emphasis on early experience with warm, sensitive, responsive adults:
Parental sensitivity (i.e., appropriate reciprocal social exchange), mutuality, synchrony, stimulation, positive attitude, and emotional support are related to secure attachment (e.g., Bakermans-Kranenburg, van IJzendoorn, & Juffer, 2003; DeWolff & Van IJzendoorn, 1997; Posada et al., 2002; van IJzendoorn & Sagi, 1999).
Maternal responsiveness and secure attachment in infancy predict better child social and mental skills later (e.g., Avierzer, Sagi, Resnick, & Gini, 2002; Bradley, Corwyn, Burchinal, McAdoo, & Coll, 2001; Landry, Smith, & Swank, 2006; Landry, Smith, Swank, & Miller-Loncar, 2000; NICHD Early Child Care Research Network, 2001; Stams, Juffer, & van IJzendoorn, 2002; Steelman, Assel, Swank, Smith, & Landry, 2002).
Insecure attachment, especially when it is disorganized, is related to increased problem behaviors later. This is especially true for externalizing behaviors in males and other social, behavioral control, crime, and mental health problems, more so in high-risk children and those who continue to experience insensitive parenting and/or child care (Carlson, 1998; Crittenden, 2001; Fonagy et al., 1995, 1997; Greenberg, 1999; Greenberg, Speltz, DeKleyen, & Endriga, 1992; Lewis, Feiring, McGuffog, & Jaskir, 1984; Lyons-Ruth, Alpern, & Repacholi, 1993; Rothbaum & Weisz, 1994; Shaw, Owens, Vondra, Keenan, & Winslow, 1997; Speltz, Greenberg, & DeKleyen, 1990; Stams et al., 2002).
Thus, attachment theory in particular emphasizes the important role of early caregiver–child social–emotional experience and predicts delayed development of social–emotional behavior in children lacking such experiences. Other theories (Bandura, 1977; Vygotsky, 1978) might predict delays in other domains of development, and recent reviews indicate that appropriate early social–emotional experience is crucial to a broad range of later social, emotional, and mental skills (Landry et al., 2006; National Scientific Council on the Developing Child, 2004a, 2004b; Richter, Dev Griesel, & Manegold, 2004; Set for Success, 2004), even physical development (Blizzard, 1990; Johnson, 2000a, 2000b). It is not our purpose to test one or another theory but rather to substantiate the role of early caregiver–child social–emotional-relationship experiences in the contemporary development of institutional children.
EMPIRICAL RATIONALE
Children reared in severely deficient institutional environments in numerous countries have been reported over six decades to show a variety of developmental delays.
Developmental Delays in Resident Orphanage Children
Physical Growth
Children reared in globally deficient orphanages tend to be smaller in height, weight, and head and chest circumference (e.g., Bakwin, 1949; Fried & Mayer, 1948; Smyke, Koga, Johnson, Zeanah, & the BEIP Core Group, 2004; Spitz, 1945), and children recently adopted show the same growth retardation (Benoit, Joycelyn, Moddemann, & Embree, 1996; Johnson, 2000a, 2000b, 2001; Johnson, Miller, & Iverson, 1992; Rutter, Kreppner, O'Connor, & the English Romanian Adoptions Study Team, 1998). Some investigators (Alpers, Johnson, Hostetter, Iverson, & Miller, 1997) have estimated on the basis of newly adopted orphanage children that physical growth falls behind by approximately 1 month for every 5 months children live in such orphanages. Children residing in the orphanages in this study were similarly delayed in physical development (St. Petersburg–USA Orphanage Research Team, 2005; see Chapter II).
The “psycho-social short stature” hypothesis (Blizzard, 1990; Johnson, 2000a, 2000b) states that children exposed to social–emotional neglect display growth deficiencies called psychosocial dwarfism (Skuse, Albanese, Stanhope, Gilmour, & Voss, 1996). It is thought growth deficiency results from hyperactivity of the corticotrophin releasing hormone-hypothalamus–pituitary–adrenal (CRH-HPA) axis, which reduces the growth axis both centrally (CRH increases somatastatin which inhibits growth hormone production) and peripherally (cortisol inhibits growth supporting factors from the liver; Alanese et al., 1994; Gunnar, 2001; Vazquez, Watson, & Lopez, 2000).
Unfortunately, in most studies of institutionalized children, nearly every aspect of their early environment is deficient; consequently, it is usually not possible to determine the role of their early social–emotional-relationship experiences apart from diet, nutrition, physical exercise, medical care, toys, and so forth in this growth retardation. Nevertheless, although some orphanage children are malnourished, nutrition does not seem to be the primary factor in the children's short stature. Orphanage children are often observed to eat substantial amounts of food, and their weight is consistently higher than their height, especially the weight/height index, suggesting to some investigators (Johnson, 2000a, 2000b) that psychosocial deprivation is a major cause. Further, Kim, Shin, and White-Traut (2003) randomly assigned 58 Korean orphanage infants within the first 2 weeks of life to a routine orphanage care control group or to an experimental group that received 15 min of auditory (female voice), tactile (massage), and visual (eye-to-eye contact) stimulation twice a day, 5 days a week, for 4 weeks. The stimulation was provided in a highly structured manner by research assistants who otherwise were not socially responsive to the infant. The experimental group gained significantly more in weight and had larger increases in length and head circumference immediately after the intervention and at 6 months of age. This result at least suggests that sensory and perceptual stimulation provided by human beings but not in a responsive–sensitive manner promotes physical growth.
General Behavioral Development
Children living in substandard orphanages also are markedly delayed in general behavioral development (e.g., Dennis & Najarian, 1957; Goldfarb, 1943; Hunt, Mohandessi, Ghodssi, & Akiyama, 1976; Kaler & Freeman, 1994; Kohen-Raz, 1968), and this was true for children in the orphanages in this study (St. Petersburg–USA Orphanage Research Team, 2005; see Chapter II). In contrast, young children reared in an orphanage that met standards of best practice developed Stanford-Binet IQs typical of the parent-reared population (Gavrin & Sacks, 1963).
Atypical Behaviors
Children living in substandard orphanages have been reported to display a variety of other atypical behaviors, including stereotyped self-stimulation, a shift from early passivity to later aggressive behavior, over-activity and distractibility, inability to form deep or genuine attachments, indiscriminate friendliness, and difficulty establishing appropriate peer relationships (e.g., Ames et al., 1997; Provence & Lipton, 1962; Sloutsky, 1997; Spitz, 1946; Tizard & Hodges, 1978; Tizard & Rees, 1974; Vorria, Rutter, Pickles, Wolkind, & Hobsbaum, 1998a, 1998b).
Over the years, it has frequently been suggested that the lack of “mothering,” appropriate social–emotional experience, and relationships with a few consistent caregivers are the primary causes of these developmental delays and deficiencies (e.g., Rutter, 2000; Spitz, 1946). While most of the early studies were on children residing in orphanages that were deficient in almost every dimension, even children who are reared in relatively good orphanages but who are subject to social and emotional neglect display many of these characteristics while living in the institution (e.g., Ernst, 1988; St. Petersburg–USA Orphanage Research Team, 2005; Tizard & Hodges, 1978; Tizard & Rees, 1974).
Children Adopted From Globally Deficient Orphanages
The literature on children adopted from globally deficient orphanages spans more than 60 years, and results often appear inconsistent at best and contradictory at worst. This is not surprising given the marked variations in orphanages, measurement instruments, duration of exposure to the orphanage, and ages at adoption and assessment among other relevant parameters (Miller, 2005). Nevertheless, recent reviews (Gunnar, 2001; Juffer & van IJzendoorn, 2005; MacLean, 2003; van IJzendoorn & Juffer, 2006; van IJzendoorn, Juffer, & Poelhuis, 2005) discern certain common themes that demonstrate orphanage children, who are adopted typically into highly advantaged families in Europe and North America, nevertheless subsequently have higher rates of extreme behaviors and problems than non-institutionalized children, and such persistent behaviors may be related to their early orphanage experience. Specifically, these reviews indicate the following themes:
Time in the orphanage
Children adopted before 6 months rarely showed deficits or higher-than-expected rates of problem behaviors. But time in the orphanage sometimes relates to the frequency and severity of longer term delays in physical growth, mental and academic performance, internalizing and externalizing behavior problems, social and peer relations, and inattention/hyperactivity. The form of the relation between time in the orphanage and outcomes is not clear and may not be linear; that is, once a child is exposed to a substandard orphanage for more than the first 6−12 months of life, higher rates of lower levels of mental performance, attachment problems, stereotyped behaviors, and indiscriminate friendliness will be found, and longer exposure does not increase these rates. Such results may also suggest that the specific ages of approximately 6−18 months may be especially sensitive to deficiencies in orphanage environments. These results occur within studies (Gunnar, 2001; MacLean, 2003; Merz & McCall, 2007, 2008; Rutter, Beckett et al., 2007) but not always between studies (Juffer & van IJzendoorn, 2005).
Temporary problems
Certain problems apparent at the time of adoption tend to be temporary, including most medical conditions, physical growth retardation, eating problems (e.g., refuses solid foods, overeats), and stereotyped or self-stimulation behaviors.
Mental performance
General mental performance tends to improve dramatically after adoption, but deficits may persist in children who spend the first several years in orphanages. Moreover, certain specific deficits may continue, and these cluster around “executive functioning,” including rigidity in thinking; inability to generalize solutions to specific problems; poor logical and sequential reasoning; excessive concreteness of thought; poor concentration, attention regulation, and inhibitory control; and restlessness and fidgeting.
Increasing problems
Certain problems may increase over the years following adoption, including internalizing and externalizing behavior problems, social and peer relations (including problems regulating emotion, anger, aggressiveness), inattention/hyperactivity, indiscriminate friendliness, and attachment problems. Attachment and behavior problems, indiscriminate friendliness, and lower IQ seem to go together in the same children. It is not clear whether such increases are related to time in the adoptive home or are associated with the children's age at assessment.
Curiously, the majority of adopted orphanage children develop typically (Gunnar, 2001; MacLean, 2003); while some circumstances are associated with increased frequencies of extreme behaviors (e.g., severe orphanage deprivations, multiple placements, time in the orphanage), it is still not possible to predict which children will and will not display persistent extreme behaviors and problems after otherwise similar orphanage experiences.
Children Adopted From Primarily Socially–Emotionally Deficient Orphanages
Only two studies followed children adopted from orphanages that were primarily deficient with respect to caregiver–child social–emotional experience (e.g., Hodges & Tizard, 1989a, 1989b; Provence & Lipton, 1962; Tizard & Hodges, 1978; Tizard & Rees, 1974, 1975). These reports, mostly based on one small sample (i.e., Tizard), reported that such children developed affectionate bonds with their adoptive parents, but were indiscriminately friendly with strangers; had higher rates of anxiety, social, emotional, and peer problems; displayed antisocial behavior at school; and had fewer close relationships than a working-class parent-reared sample. These problems were similar in type to the broader literature on children from globally deficient orphanages as well as the literature on the consequences of neglectful, psychologically unavailable parenting of children reared by their own parents (e.g., Erickson & Egeland, 2002).
Because Tizard's orphanages were relatively “stimulating” in terms of varied experiences but deficient in social–emotional relationships with caregivers, Gunnar (2001) proposed that human interaction provides early stimulation that is contingent on the child's own behavior (e.g., responsive, sensitive caregiving), which may be crucial to normal development.
Collectively, then, these studies are consistent with the hypothesis that a major contributor to contemporary delayed development and longer-term extreme behaviors and problems is the relative lack of caregiver–child warm, sensitive, responsive social–emotional interactions and the opportunity to experience relationships with a few, consistent caregivers that is typical of many substandard orphanages, and such experiences may be especially relevant between 6 and approximately 18 months of life.
The Effects of Early Interventions
Early Interventions for Parent-Reared Low-Income Children
A substantial literature demonstrates the effectiveness of early care and education programs in improving low-income, parent-reared children's development in the short-term and lowering long-term rates of school failure and certain antisocial and delinquent behaviors (e.g., Haskins, 1989; R. B. McCall, Larsen, & Ingram, 2003; Ramey & Ramey, 1992; Yoashikawa, 1995). While these interventions were primarily designed to promote children's mental development, a reanalysis of four major general intervention programs for at-risk children and those with disabilities revealed that increases in general mental and social behavior occurred only in children whose mothers increased in sensitivity and responsivity (Mahoney, Boyce, Fewell, Spiker, & Wheeden, 1998). This observation is consistent with the hypothesis that early sensitive and responsive caregiver–child social–emotional interactions and relationship experiences contribute to development in a variety of domains.
Responsive Parenting Intervention
Landry et al. (2006) recently reported an intervention in which mothers of term and very-low-birth-weight (VLBW) infants were randomly assigned to either a 10-home-visit training program designed to promote responsive behaviors or developmental feedback conducted when their children were 6−13 months of age. Based on the literature, responsive parenting consisted of contingent responding, emotional-affective support, support for infant foci of attention, and language input that matches developmental needs. Increased maternal responsiveness produced greater growth in social, emotional, communication, and cognitive development for both groups of infants but especially VLBW infants, a result in accord with other intervention studies for high-risk (e.g., premature, high irritability, adopted) children (e.g., Beckwith & Rodning, 1992; Juffer, Hoksbergen, Riksen-Walraven, & Kohnstamm, 1997).
Interventions in Orphanages
Several decades ago, the delayed development of orphanage children was attributed to a lack of “mothering” (Bowlby, 1958; Spitz, 1945) and/or a lack of sensorimotor stimulation, especially for very young infants (e.g., Schaffer, 1958).
Mothering Versus Stimulation
Several early studies provided orphanage infants with essentially noninteractive stimulation while others attempted to provide additional “mothering.”
Primarily noninteractive stimulation
Providing additional opportunities for tactile, visual, and auditory stimulation for several weeks produces short-term improvements in general behavioral development, or at least prevents the decline that orphanage children typically display. For example, Sayegh and Dennis (1965) placed Iranian orphanage children in a sitting position so they could watch the activities of the ward and manipulate objects; Casler (1965) had specially trained assistants provide 20 min of scheduled tactile stimulation (stroking, not vigorous massage); Hakimi-Manesh, Mojdehi, and Tashakkori (1984) had psychology students provide extra tactile, auditory (talking), and visual (eye-to-eye contact) stimulation for 5 min per day; and Brossard and Decarie (1971) provided infants with additional perceptual and/or social stimulation for 15 min daily. In each case, general developmental scores increased or did not decline relative to controls. Collectively, these studies suggest that visual, auditory, and tactile stimulation of primarily a noninteractive sort can produce gains in general behavioral development in orphanage infants within the first year of life, although the benefits tended to fade after the intervention terminated.
Social interventions
Several other studies emphasized social interactions with infants, although the extent to which these were responsive and reciprocal cannot be specified. For example, Skeels and Dye (1939) moved infants and very young children from a U.S. orphanage to an institution for mentally retarded adult females who spent time with the children teaching them eating and toilet habits as well as how to walk, talk, and play with toys. Rheingold (1956) provided 7.5 hr a day, 5 days a week of care from the experimenter herself who fed, held, talked to, diapered, and played with the children over a period of 8 weeks. More recently, Taneja et al. (2002) had professionals train caregivers how to play and interact with children (e.g., name objects, demonstrate the use of toys, talktothe children, sing songs with children) in specialized play opportunities for 90 min each day. In each of these studies, infants and children improved on general behavioral developmental assessments, although againthesegainstendedtofadewhen the interventions were terminated (Rheingold & Bayley, 1959).
More Comprehensive Social Interventions
A few interventions were more deliberately aimed at developing caregiver–child relationships by reducing the number of caregivers and making them more consistent in the lives of the children in addition to providing diverse kinds of stimulation.
Sparling, Dragomir, Ramey, and Florescu (2005) report a quasiexperimental (nonrandom assignment) and an experimental (random assignment) study conducted in 1991−1994 in a globally deficient Romanian orphanage for children birth to 3 years of age. For the intervention group, recent graduates of technical high schools were hired and trained as daily caregivers who each tended to stay with the same group of 4 children (1:4 caregiver:child ratio) over the 12-month intervention period. The comparison group used staff caregivers and had a much larger caregiver:child ratio. The intervention staff received 1 week of primarily educational training on enriched caregiving including making eye contact, pointing to objects, naming things the child sees during routine caregiving, engaging children in common events with educational value (reading a book, going for a walk, reciprocal verbal play), and implementing an individualized curriculum of educational games and interactions (adapted from Sparling, Lewis, & Ramey, 1995). Intervention caregivers received periodic additional training and frequent supervisory feedback over the 12-month intervention.
Children in the intervention group in both studies performed better on the Denver Developmental Screening Test II on personal–social, fine motor-adaptive, language, and gross motor (Study 2 only). These differences reflected the fact that the experimental group tended to make normal progress (1 month gain per 1 month in the program) while the comparison group developed at a slower-than-typical rate and progressively fell further behind. A subsample of caregivers were videotaped with children; the trained caregivers talked more than the comparison staff, and individual differences in the amount of talking was highly correlated (r = .71) with the intervention children's developmental gains.
This study demonstrates that hiring better educated caregivers, training them primarily in educational activities, creating small groups (4 children each), reducing the caregiver-to-child ratio to 1:4, and providing periodic training and supervision produces better developmental scores in young orphanage children. These intervention elements, while primarily implemented to promote mental and educational development, also provided at least the opportunity for improved social, emotional, and relationship experience.
More recently, Smyke, Dumitrescu, and Zeanah (2002) reported a small intervention in a contemporary Romanian orphanage in which “primary caregivers” were assigned to wards, the number of different caregivers serving individual children was reduced, and caregivers were encouraged to interact with the children in ways more typical of parents rearing their own children at home. This intervention, which was more deliberately focused on improving the children's social–emotional-relationship experience, produced increased child attachment ratings made by the caregivers themselves compared with children in the traditional institution. These investigators (Nelson et al., 2007; Zeanah, Smyke, & Koga, 2003) also reported that infants and toddlers from the same orphanage who did not experience the pilot intervention but were placed in foster care showed increased mental development; lower dysregulation, anxiety, and depression or withdrawal; and higher separation distress the longer they were in foster care relative to children who remained in the orphanage.
While these interventions emphasized caregiver–child interaction, presumably of a more responsive and reciprocal nature, and fewer and more consistent caregivers, the outcome measures were primarily general developmental tests (except for Zeanah et al.'s attachment and self-regulation ratings), which previous studies indicated could be improved by sensorimotor stimulation. Thus, it is not clear what the uniquely human aspect of the intervention adds, although the Zeanah et al. study suggests better social relationships. From a practical standpoint, most of these studies (except Taneja et al. and Zeanah et al.) imposed an outside intervention conducted by nonorphanage staff on the children, rather than trying to change the regular orphanage staff, behavioral culture, and structural methods of operating.
Conclusion
Collectively, this literature suggests that deficiencies in early stimulation and social–emotional experience are associated with developmental delays and increased frequency of longer term extreme behavior and problems; conversely experimental improvement in sensorimotor stimulation and educational and social interactions between caregivers and children in the context of smaller groups and fewer, more stable caregivers improves child–caregiver relationships and children's development. The current study was aimed at demonstrating the role of early caregiver–child social–emotional interactive and relationship experiences on orphanage children's development in a more direct and comprehensive manner than before by experimentally improving the social–emotional-relationship experience of orphanage children.
PRACTICAL RATIONALE
This study also is relevant to several practical issues.
Improving Orphanages
Although there are only a few orphanages in the United States, orphanages are common in the Russian Federation, East Europe, Latin America, Africa, and parts of Asia. Although orphanages vary, many share certain features, especially in the Russian Federation in which there is some federal regulation over all orphanages. These similarities include caregivers having minimum social and emotional interaction with the children and thus some degree of social–emotional neglect; many and changing caregivers; large groups of children and high child:caregiver ratios; and relatively untrained staff (Rosas & McCall, 2008).
Thus, it was important to demonstrate that existing caregiving personnel and orphanage administrators could make these changes in an effective way, the changes could be sustained without additional resources once in place, and the changes could be implemented in new orphanages at relatively modest cost. Clear and broad-based demonstration of both the effectiveness of the implementation of the interventions as well as their ability to produce developmental improvements in the children would be needed to convince administrators and politicians to support similar changes in other orphanages in St. Petersburg, the Russian Federation, and elsewhere.
However, many people suggest that orphanages should not be improved but be eliminated, much as they are in the United States and Scandinavia, for example, in favor of developing a foster care system and promoting adoption. The proposition that every child should be raised in a family is a worthwhile philosophy and an ideal to be striven for, but at least in the near term it may work better in theory than in practice.
While it is possible to have high-quality and effective foster care, the foster care system in the United States, for example, generally is neither high quality nor beneficial for children (see below). Further, in much of the world, adoption is not culturally accepted or widely economically possible, so permanency planning would be limited. Also, research in the United States suggests foster parent commitment to the child is crucial to achieve beneficial outcomes for the children (Dozier, Stovall, Albus, & Bates, 2001), but not all foster parents have such commitment. Finally, even in some countries that can afford a competent foster care system (e.g., the United States), it is debatable whether they are willing to pay for it.
It took the United States nearly 40 years to get to its current, rather mediocre state, so it is likely that orphanages will exist in many countries for several decades in the future. And if they exist, it is reasonable to make them as supportive of children's development and mental health as possible, and the results of this project might provide direction and substantiation for orphanage improvements.
Nonresidential Care in Other Countries
Certainly generalizations from research conducted in residential orphanages in the Russian Federation should not be glibly made to nonresidential care and education environments in other countries, including the United States. There are many important differences between these care arrangements, including an unusual sample of children, children who do not go home to parents each night, and so forth. But there are also some similarities, and these similarities should not be ignored either.
Early Care and Education in the United States
There are several similarities between the interventions implemented in this project and circumstances pertaining to nonresidential early care and education in the United States.
First, observational studies show that major components of this project's social–emotional interventions are related to positive outcomes for U.S. parent-reared children (e.g., Landry et al., 2006) and children in U.S. child care. Children in U.S. child care become attached to their caregivers (Howes & Hamilton, 1992), especially those with whom they have a long-term, stable, consistent relationship (Anderson, Nagle, Roberts, & Smith, 1981; Barnas & Cummings, 1994) and who provide intense, responsive, and sensitive interactions (Ritchie & Howes, 2003). In turn, infants who form secure attachments with their caregivers are more advanced later in their play and peer relationships, less aggressive or withdrawn, better regulated, and more socially competent (Howes, 2000; Howes, Matheson, & Hamilton, 1994; Oppenheim, Sagi, & Lamb, 1988). Also, stability of caregiver (e.g., low staff turnover and fewer changes in care arrangements), supportive structural environments (e.g., lower child:staff ratios and smaller group sizes), and well-trained caregivers—circumstances similar to the interventions implemented in this project—are associated with children who display more on-task behaviors, improved mental and language development, and fewer peer problem behaviors (e.g., Howes & Hamilton, 1993; Kontos et al., 1995; NICHD Child Care Research Network, 1997, 2000; Peters & Pence, 1992; Whitebook, Howes, Phillips, & Pemberton, 1989). Finally, in the face of a contemporary emphasis on skill building and academic readiness, some scholars have made the case that early care and education facilities should also promote social and emotional development because it is important in its own right and because it facilitates cognitive development (e.g., Boyd et al., 2005; National Scientific Council on the Developing Child, 2004a, 2004b).
Second, relatively few nonresidential early childhood care and education facilities in the United States actually implement the structural characteristics described above that are components of the structural change intervention implemented in this study. For example, even among 22 highly selected “best practices” programs in two states, only 60% of children experienced the same caregivers all week for 1 year, only 15% had the same caregivers for more than 1 year (“looping”), and only 11% were assigned a primary caregiver (Ritchie & Howes, 2003). Relationship-building circumstances and social interaction with children may be even less common in unselected centers (NICHD Early Child Care Research Network, 1997) and home/family care (Helburn & Bergmann, 2002; Kontos et al., 1995), which serve millions of children in the United States and in other countries. Also, recent descriptions of early childhood care in Israel show it to be substantially below standard, often in ways similar to orphanage care (Koren-Karie, Sagi-Schwartz, & Egoz-Mizrachi, 2005; Sagi, Koren-Karie, Gini, Ziv, & Joels, 2002).
Third, despite the above research and “best practices,” training and licensure of early childhood care and education personnel in the United States are generally regarded as inadequate (American Association of Colleges for Teacher Education, 2004; Bowman, Donovan, & Burns, 2001; Early & Winton, 2001; Morgan & Fraser, 2006), and they are especially deficient in the social–emotional aspects emphasized in the current interventions (Mehaffie et al., 2002). For example, personnel preparation in early childhood special education focuses on teaching specific teacher-directed cognitive and physical skills and tends to minimize sensitive/responsive interaction, adult–child and child–child relationships, and child-directed interactions (Rimm-Kaufman, Voorhees, Snell, & La Paro, 2003).
Fourth, the general quality of care in the orphanages is not much different than in some early childhood care facilities in the United States and Israel, for example. Although very deficient in certain specific social–emotional-relationship supports, the general caregiving environment as measured by the preintervention HOME Total Scores is not much lower in the orphanages in this study than in U.S. family care, and all of the score difference can be attributed to a few items that reflect the inherent nature of orphanages (Bradley, Caldwell, & Corwyn, 2003; St. Petersburg–USA Orphanage Research Team, 2005). Also, scholars and practitioners in the United States (M. Graham, personal communication, July 18, 2002) and Israel (A. Sagi, personal communication, July 18, 2002) have remarked or demonstrated empirically (Koren-Kari et al., 2005) how similar the caregiving environment in the orphanages in this study is to the child care in their projects.
Fifth, the U.S. practice literature is nearly silent on how best to improve the social–emotional environment in early care and education facilities. Specifically, training of caregivers in social–emotional development and sensitive, responsive caregiving is likely to help, but so would implementing the structural changes that promote relationship building (e.g., fewer and more permanent caregivers, looping, integration, assigning children to primary caregivers) that were the basis of the intervention in this study. Training and structural changes have not been separately manipulated in a quasiexperimental study before.
Foster Care
Other similarities can be seen with American foster care, which is “in crisis” (USGAO, 1989, 1993) even after permanency planning PL 105−89 in 1997 (Bishop et al., 2000). First, more than half of foster children stay in the system more than 3 years and experience three or more placements (Jones-Harden, 2004; Pew, 2004), resulting in many different caregivers and a lack of stable relationships similar to children in the orphanages. Second, foster parents commonly cite lack of training as a major problem (Denby, Rindfleisch, & Bean, 1999). Third, foster parents face the same dilemma as orphanage caregivers of whether to “love” the children or maintain a cool, aloof posture with minimal sensitive or responsive interactions (Heller, Smyke, & Boris, 2002). Fourth, the long-term outcomes of children in U.S. foster care are similar to children reared in substandard orphanages. They have more behavioral, emotional, school, and mental and physical health problems than children reared by biological parents, step parents, or low-income single parents (Carpenter, Clyman, Davidson, & Steiner, 2001; Kortenkamp & Ehrle, 2002), although they likely enter foster care with more problems.
Conclusion
Results from the current study cannot be generalized to nonresidential early care and education or to foster care in the Russian Federation, United States, and other countries. But demonstration of substantial positive benefits of training and structural changes in the current project could add impetus to emphasizing social–emotional relationships in the structural operation of facilities, personnel training, and support of foster and child care services in many countries.
II. BABY HOMES IN THE RUSSIAN FEDERATION
This chapter provides a brief history of orphanages in Russia; a description of the current orphanage system in the Russian Federation and in St. Petersburg; characteristics of the caregivers and children who were participants in this study; and a short history of this project. The intent is to provide the historical, cultural, and practical contexts that have shaped the orphanages and the current project.
A BRIEF HISTORY OF ORPHANAGES IN THE RUSSIAN FEDERATION
The history of orphanages for children birth to approximately 4 years of age, currently called Baby Homes (BHs), in what is now the Russian Federation can be divided into three parts: The era of the czars, Soviet society, and the post-Soviet period.
Orphanages Under the Czars
Czar Fedor Alekseevich (1676−1682) established institutions that provided public care for abandoned and unwanted children similar to the large centralized institutions supported by the monarchies in Europe at the time (Ransel, 1988). In 1712, Peter the Great issued a decree calling for the establishment of hospitals for the “children of shame” funded by the czarist family and wealthy nobles.
A major shift of attitude and philosophy occurred when Ivan Betskoi wrote a decree in 1763 for the Empress Catherine II, which suggested that nurture and education homes (vospitatel'niedoma) be created rather than the more common European foundling homes or hospitals (Ransel, 1988). These new homes stressed the humanitarian goal of providing a refuge for innocent children who were born to unwed mothers or people too poor to care for their children, amid reports that some of these children were being abandoned, died, or even murdered by desperate or cruel parents. As a result, two large doma were built, one in Moscow in 1764 and the other in St. Petersburg in 1770 (Yuzhakov & Milyukov, 1904). These homes had more liberal admission policies than their counterparts in Europe, because virtually any infant or child was welcome (Ransel, 1988). Moreover, in 1767 elements of a foster care system were implemented in which rural peasant women were paid to care for children. These efforts stemmed from the Russian attitude toward humanitarian care and salvation of the child rather than the European concern for the welfare of the mother (Ransel, 1988).
Betskoi's idea of vospitatel'niedoma in which orphanage children would develop in accord with a preordained plan in a controlled institutional environment using the latest pedagogical techniques (Ransel, 1988) continued to shape Russian foundling care until the end of the czarist regime. Indeed, by the second half of the 19th century, the central Moscow dom took in 17,000 children per year and supervised more than 40,000 children at any one time, most of whom were cared for by wet nurses and foster families in the countryside around Moscow. The dom in St. Petersburg operated a similar program, receiving 9,000 infants and children each year and supervising over 30,000 children in its foster program (Yuzhakov & Milyukov, 1904). Fostering was created to handle the large number of children that needed care plus the philosophy that the mother's feeding of and constant care for the child—“mothers’ attachment to the child”—was important for the child's well-being (Rodulovich, 1892, p. 292). The biological mother herself was encouraged to feed her infant even if she was not able to otherwise care for it.
Eventually, however, the number of children needing care exceeded the capabilities of the system, the need for wet nurses and foster families outstripped the supply, epidemic illnesses threatened the health and viability of children, and an increasing number of foster families were more interested in receiving the fee than caring for children (Rashkovich, 1892).
The Soviet Period
Shortly after the 1917 revolution, the Soviet government abolished all children's and fostering institutions, which by this time had become primarily supported by foundations and charitable organizations rather than the government. Instead, a network of state-supported institutions was created. In 1918, guiding principles for the care of such children were issued that reflected the ideology of the Soviet state, which recognized that women needed to carry out their function of procreation but also were needed as laborers in the new social system that emphasized working for the state. In return, the state would help take care of children who could not be fully raised by their parents.
So a network of “mother and child homes” was created within the government's health service to support mothers who needed assistance to care for their infants and children within the context of these institutions (Konius, 1954). Later, joint placement of mothers with their infants was abandoned because of difficult economic conditions and civil war, and children were housed in the institutional homes without their mothers.
Initially, infants birth to 12 months were in one facility while children 1−3 years were in another, but soon these age groups were combined into BHs for children of single mothers, orphans who lost contact with their parents, or children whose parents lost parental rights, which was formally established by resolution in 1946. Later, such BHs also accepted children with physical and mental disabilities up to the age of 4 years. This practice persisted through the Soviet period and up to the present. For example, in 1994, 44 children with Down syndrome were born in St. Petersburg and all but 2 were sent to the BHs.
During this period, older orphans sometimes were used by criminals. Their involvement in violent and criminal activity was portrayed in newspapers and books, which contributed to society's perception of orphans, not as victims in need of help, but as outcasts and undesirable, who should be segregated from society.
Post-Soviet Period
Near the end of the Soviet and into the post-Soviet periods, intellectual opinion and social philosophy changed, but practice largely did not. For example, the Council of Ministers passed a resolution in 1988 suggesting the creation of family children's homes, a similar resolution in 1994 dictated that children without parents be fostered in rural households at the expense of the state, and the Family Code of the Russian Federation (1996) provided for placing children into a fostering family for a contract period with monetary payments for the children's support.
Philosophically, elements of the child-focused attitude and fostering system that existed in prerevolutionary Russia were present in the post-Soviet period. But the massive political, social, and economic changes and instability produced in the Russian Federation in the wake of the Soviet system did not permit the implementation of these new forms of organization. As a result, orphanages, including the BHs, are still the main institutions that care for orphaned children and those without adequately functioning parents.
CONTEMPORARY BHs
The Children
The Russian Federation
In 2004, there were 255 BHs in the Russian Federation housing approximately 19,900 children birth to 4 years of age, 15,221 were officially reported to be “delayed” in mental development and 9,953 “delayed” in physical development (Konova, 2005). Between 1993 and 2004, the total number of residents increased by approximately 12%, but the proportion of children entering the BHs during their first year of life more than doubled to 39% from 17%, presumably because of social and financial conditions.
St. Petersburg
Specifically in St. Petersburg, at the end of 2004 there were 13 BHs with a capacity of 1,195 children and 1,096 actual residents, 40.4% of whom were birth to 12 months old, 43.8% were 1−3 years old, and 15.8% were over 3 years of age. Official reports (Libova, 2005) stated that 90.6% of children were delayed mentally and 56% were delayed physically. Three fourths of the children came to the BHs from children's hospitals and 13.6% came directly from maternity hospitals.
The Staff
While much of the funding comes from the federal government, the BHs are administered by the Ministry of Health of each city and by a local district administration. While there are a variety of policies and regulations, BH directors, who are typically pediatricians, have substantial local control. Because they are under the Ministry of Health and directed by pediatricians, BHs emphasize the health and safety of children to a greater extent than their social–emotional development and mental health.
Each BH has a pediatrician director, several other pediatricians or neuropathologists, and administrative assistants. Also, each BH has specialized therapists, including “defectologists,” who have special education training (called “Special Teachers” in this monograph), and specialists in physical education, music, massage, sensory stimulation, electrotherapy, social work, and psychology.
Routine care is provided by three types of caregivers who work on the wards with the children. They include Medical Nurses, who have some medical training and are responsible for the health and welfare of the children; Assistant Teachers, who have some educational training and are responsible for the education and development of the children; and Nursery Nurses or aides who assist in routine care and activities. Although there is some variation between Homes (e.g., Sloutsky, 1997), these caregivers tend to work long hours and few days per week.
Intake and Departure of Children
Reasons for Placement
The main reasons children are sent to the BHs are (1) parental financial inability to care for a child; (2) inability of the parents to behaviorally care for the child (e.g., parental drug and alcohol abuse, mental health problems, mental and behavioral incompetency); (3) parental unwillingness to rear a child with frank disabilities; and (4) involuntary loss of parental rights because of abuse, neglect, and other inappropriate treatment. In St. Petersburg in 2004, 65% of children sent to the BHs were from single-mother families, 22.8% were placed temporarily in the BHs by their parents, 16.4% were from parents who lost parental rights, and the rest were foundlings or abandoned (Libova, 2005). From a legal standpoint, it is easier in the Russian Federation for parents to relinquish their children than in the United States, for example (St. Petersburg–USA Orphanage Research Team, 2005).
Reasons for Departures
Children depart BHs at various ages and for various reasons. In 2004 in the entire Russian Federation BH system, 57.9% were adopted (a substantial increase over the 17% in 1993), nearly all internationally (only 0.9% to Russian parents), and 18% were restored to their biological families (Konova, 2005). Otherwise, children who remain in the BHs until approximately 4 years of age are transferred to “Children's Homes” within the Ministry of Education for those who do not have serious disabilities or to “Internats” under the Ministry of Labor and Social Care for those with the most severe disabilities. In 2002 in St. Petersburg, for example, 18.3% were returned to their biological families, 8% graduated to Children's Homes and 6.1% to Internats, 45.2% were adopted internationally (primarily to the United States, Germany, Scandinavia), and 14.4% were adopted by Russian parents (Libova, 2005). International adoption rates can vary substantially with political circumstances and domestic adoptions with economic conditions and region of the country.
THE BHs, CAREGIVERS, AND CHILDREN IN THE CURRENT STUDY
The current study was conducted in three BHs in St. Petersburg. They were among the five BHs in St. Petersburg that the International Assistance Group (IAG), a private Pittsburgh-based agency specializing in placing Russian children in American families, drew children to be adopted. Consequently, the three BHs used in this study were not randomly selected; rather, they were among the best in St. Petersburg, and their directors were the most cooperative with the aims and conditions of this project.
Children in the BHs
The children entering these three BHs have been described as comprehensively as any orphanage group in the literature (St. Petersburg-USA Orphanage Research Team, 2005).
Children's Birth Circumstances
Very briefly, children entering these three BHs generally represent the entire range of birth circumstances, but a substantial minority have serious perinatal complications, including higher than typical rates of low birth weight (27% <2,500 g) and very low birth weight (5.5% <1,500 g); lower average birth weight (2,798.4 g relative to a Russian Federation mean of 3,380 g); correspondingly lower average birth lengths, head circumference, and chest circumference than Russian Federation averages; and relatively lower Apgar scores (7.2 and 8.2 at birth and 10 min, respectively). Children residing in these BHs at any one point in time tend to have more adverse birth characteristics than those just arriving because of selective adoption and restoration to biological families.
Disabilities
Approximately 8% of children entering the three BHs but 21% of those in residence at any one time were considered by the current Research Team to have a disability, defined by scores on the Functional Abilities Index (Simeonsson & Bailey, 1988, 1991) that would interfere with Battelle Developmental Inventory (BDI) performance typical of this group (see Chapter IV). The most common functional disabilities pertained to physical health, mental ability, communication, and limited limb movements.
Children's Development
Children arrive at the BHs with delayed physical and behavioral development and tend to remain so. Approximately half the children in residence fall below the 10th percentile of standards for the northwestern region of the Russian Federation (St. Petersburg Pediatric Medical Academy, 2000) on height, weight, head circumference, and chest circumference, and 92−97% are below the median. Scores on the BDI relative to U.S. standardization percentiles show that children are similarly delayed at intake and while in residence. For BDI total score, 68% of residents are below the 10th percentile and 96% are below the median; children are especially delayed on the Personal–Social subscale (St. Petersburg–USA Orphanage Research Team, 2005).
Departures
Over a 6-year period (1997−2002), 21% of children from these three BHs were adopted annually to the United States, 38% were adopted to other countries (mostly Scandinavia and Germany), 28% were returned to their biological parents, 7% graduated to Children's Homes, and 5% were transferred to Internats. Most adoptions (89% to the United States, 70% to other countries) and 66% of the reunifications to biological parents occurred within the first 24 months of life. Such children were likely to have nonspecific at-risk diagnoses; children graduating to Children's Homes were more likely to have fetal alcohol syndrome and Down syndrome; and those transferring to the Internats tended to have cerebral palsy, Down syndrome, hydro- and microcephalous, and so on.
Consequently, the majority of children (64% of those departing in any single year) are younger than 24 months, and because the average age of children arriving at the BHs is 6.4 months, one can estimate that slightly less than two thirds of the children reside in the BHs <18 months. Further, there is substantial selective attrition in which children with better birth circumstances and physical and mental development are more likely to be adopted or reunited with their parents before their second birthday.
The Behavioral Culture of the BHs
Generally, these BHs are acceptable with respect to medical care, nutrition, sanitation, safety, toys, and equipment and lack of physical or sexual abuse. But a behavioral “culture” exists, complemented by restrictive structural circumstances, that is characterized by minimum social and emotional interactions or relationships between caregivers and children. This culture has been comprehensively described (St. Petersburg–USA Orphanage Research Team, 2005) and is similar to that reported to exist in many other orphanages. It is briefly described below with the reasons given for major elements; it is important to understand the rationale for these practices, because the interventions implemented in this project were designed to change these rationales and the entire behavioral culture of the BH.
BHs Acceptable on Most Aspects of Care
The BHs are acceptable with respect to most aspects of care. Medically, the BHs are operated under the auspices of the Ministry of Health, directed by a pediatrician, and have several physicians on staff and available throughout the day except on weekends. While caregivers have some degree of specialized training (23% receive <1 year, 48% 1−2 years), such training and continuing education tends to focus on health and safety. Children's health is monitored periodically and appropriate treatment administered within limited economic conditions. Common drugs are administered, and children are not medicated for behavioral control.
The physical environment is reasonably safe. Serious accidents, injuries, and medical errors must be reported, may be investigated, and negligent staff may be terminated. The facilities are relatively bright with many windows.
Sanitation is acceptable. The BHs are reasonably clean, and the children are bathed and cleaned regularly, although some have diaper rash.
Childrenare fed an appropriate, balanced, and nutritious diet, which was determined for this project to be adequate by international standards (Kossover, 2004). While no data exist on how much of the diet children actually eat, it is widely known that orphanage children eat substantial amounts of food (i.e., hyperphagic), and these children appeared to the authors to be no exception.
There are numerous toys available on each ward, many provided by domestic sponsors and adoption agencies including IAG, and there are a variety of learning materials, although these seem to remain on shelves and be used less frequently. Some specialized equipment for children with disabilities is available (e.g., wheel chairs, walkers), but such equipment is not used to a great extent.
While caregivers occasionally yell or physically restrain behaviorally deviant children, discipline is not frequently administered, in part because children are taught to be conforming (although a few do occasionally aggress against one another). Abuse by a caregiver is considered a very serious offense with consequences for the caregiver.
Social–Emotional Relationship Deficiencies
In contrast to the acceptable standards for most aspects of care, the extent and nature of the social and emotional interactions between caregivers and children are extremely limited and noticeably deficient, similar to many other orphanages in the literature (St. Petersburg–USA Orphanage Research Team, 2005). On the one hand, the general level of care provided by the staff is not extremely deficient when measured by the HOME Inventory (institutional 24-month version; Bradley & Caldwell, 1995; Caldwell & Bradley, 1984) and compared with U.S. family child care providers (Bradley et al., 2003). BH caregivers do score significantly lower than U.S. family child care personnel on HOME total score and the subscales of Responsivity, Organization, Learning Materials, Variety, and a special Sociability index of items created for this project (St. Petersburg–USA Orphanage Research Team, 2005). But the total score difference was small (2.31 points), and this deficit could be totally accounted for by certain structural aspects of the orphanage and the residential nature of the BHs. However, U.S. family child care is not a particularly enviable standard, because the quality of care across a variety of U.S. early childhood facilities is considered only “fair” (NICHD Early Child Care Network, 2000), quality is typically worse in U.S. family and home environments than in centers, and in at least some locations, the quality is getting worse as demand outstrips the availability of trained providers (Fiene et al., 2002). Moreover, the HOME consists of pass–fail items, and so the prevalence beyond yes/no of behaviors is not reflected in its score; and while items pertaining to social interactions are represented, emotions and relationships do not play a prominent role on the HOME. On individual items, BH caregivers talk and initiate activities with the children less frequently (even though they only need to talk to one of the 10−14 children once in 45 min of observation to receive credit for such an item), and they have more traditional attitudes toward childrearing that emphasize caregiver-directed rather than child-directed (i.e., responsive) interactions as reflected on the Parental Modernity Scale (NICHD, 2000; Schaefer & Edgerton, 1985) than U.S. caregivers (St. Petersburg–USA Orphanage Research Team, 2005).
In contrast to the HOME results for general caregiving, specific observations in one of the orphanages document the minimum amount of caregiver–child interaction. Muhamedrahimov (1999) observed caregivers with children birth to 3 months and 3 to 10 months of age once a week from 9:30 a.m. to 12:30 p.m. over a 2-month period, which hours included routine caregiving and “free time.” Across these two groups of children, caregivers initiated interaction with the children approximately 10% of the total available time (approximately 18 min). They responded to children's initiations of social interaction <1% of the time (<2 min), children cried for approximately 11 min before a caregiver responded, there was essentially no talking during more than half the time the caregivers were engaged in routine caregiving, and on average an individual child interacted with a caregiver for any reason for only approximately 12.4 min during the 3-hr period and nearly half of this was associated with feeding.
Feeding in particular represents a prime example of the lack of social–emotional interaction between caregivers and children. Infants up to 3−4 months are bottle fed, typically with no social interaction and occasionally using bottles propped on pillows. After approximately 4 months, a caregiver places the child on her lap facing laterally or directly away from her, holds the child tightly with one arm against her body while holding a large bowl of food under the child's chin, and feeds the child with a large spoon. Systematic observations showed the caregivers gave children a spoonful of food plus scraped excess food from the child's mouth twice every 5 s, and the average time to feed a child was 7.1 min with actual feeding occurring over 5.1 min. Essentially no social interaction occurs except to encourage eating or to occasionally look at the child.
Caregivers go about their caregiving duties in a business-like, perfunctory manner with little social interaction and even less emotion. Most caregivers are expressionless most of the day, and talking is as minimal during changing and bathing as it is during feeding. Most interactions with children are caregiver directed—changing and bathing are done “to” rather than “with” the child (“ready or not, here comes the water”) in assembly line fashion. Individual conformity to group standards is expected, and even dance and music activities are conducted en masse in prescribed ways often with little enthusiasm or enjoyment. Toys are frequently demonstrated to the child by the caregiver, who expects the child to imitate her action and use the toy in the “prescribed” way (St. Petersburg–USA Orphanage Research Team, 2005).
Why are caregivers so socially and emotionally aloof? Much of the BH style appears to be “institutional” rather than Russian cultural. First, this characteristic is frequently reported to exist in other orphanages. Second, on a questionnaire given to a sample of 63 caregivers in one of the BHs in this study (Muhamedrahimov, 1999), 57% said that the law on BHs dictated that their main work was medical care and education, and 37% said they were unwilling to form attachment relationships with the children. Essentially all of the children leave the orphanage, many within a few months after arriving, and at least some caregivers do not want the pain of separation that might result if they form relationships with those children. Also, caregivers say they are too busy, which is true at times (e.g., when they must feed 10−14 infants in approximately an hour) but not at other times (e.g., during nap time when all children are in their cribs).
Children's Behavior
This lack of caregiver–child social–emotional interaction and relationships presumably is reflected in the children's behaviors (St. Petersburg–USA Orphanage Research Team, 2005). Infants spend a great deal of time in their cribs or playpens with little to do, often engaged in stereotypic or self-stimulation behaviors (e.g., rocking, repetitive shaking of an object, head banging). Interactions with toys or other objects are simplistic, repetitive, autonomous, and rudimentary (e.g., banging, shaking, mouthing). After 6 or 8 months of age, children tend to have vacant or empty looks on their faces, relatively devoid of affect. They look at other children and strangers as if they were objects, staring blankly and examining a person as something to be explored or studied but not socially engaged.
Older children tend to play in isolation or in parallel with one another, similarly without much emotional expression. They rarely engage in sustained, reciprocal interactions of a contingent or cooperative sort with each other. They often stand or sit with nothing to do or they play with objects in the prescribed way, conforming to adult direction rather than being creative, imaginary, or experimental in their play. When strangers visit the wards, there are no displays of wariness or fear of a stranger; instead, toddlers stare and older children often are indiscriminately friendly, running up to a stranger and hugging him or her repeatedly.
Children with disabilities often receive even less attention. They are typically confined to their cribs, chairs, walkers, or playpens, often sitting or lying in contorted, asymmetric, and uncomfortable positions. Self-stimulation behaviors are very common, and these children do not seek social interaction. They tend to be lethargic, inactive, unresponsive, and display limited social–emotional expression. At some point in history, children with disabilities in most societies were not encouraged in their development and were isolated from other children, and this was especially true during the Soviet period, which emphasized group, not individual, work and accomplishment. Further, it was felt that children with disabilities would use resources, and typically developing children might learn unproductive habits if they were housed with children with disabilities. Further, there is still the medical belief, also once common in the United States, that children with disabilities are not able to improve developmentally and thus encouraging their development would be futile.
Structural Constraints on Social–Emotional Interactions and Relationships
The behavioral culture described above is promoted by a variety of employment and operational characteristics of the BHs, each of which has a rationale. As indicated above, caregivers tend to work long hours but few days per week. Such a system is not unknown in medical circles because it promotes continuity of care for sick children. In addition, BH caregivers largely prefer this system, because it allows them several consecutive days off to be with their families or to hold a second job, it minimizes transportation and meal costs that are not trivial when the salary for the job is so minimal, and salary is augmented for working night shifts. This practice, however, means that children do not see the same caregivers from one day to the next.
Children are also housed in homogeneous age groups, and then are transferred to a new set of caregivers approximately when they reach the milestones of crawling, walking, and multiword sentences. Historically, homogeneous age groups for young children were virtually unknown throughout the world's cultures until group care of young children emerged (Hartup, 1976; Konner, 1975). Homogeneous groups were created so that children could learn to socially interact with children of their own age and to provide educational experiences to children who were similar in their knowledge, language, and motor skills. The same principles that govern homogeneous educational practice after age 6 were simply applied to groups of younger children. Safety was also a consideration. Children with vastly different motor skills may hurt one another, and they can be managed more easily if they are at the same level of development and have equipment (e.g., playpens) that matches that level. But to keep groups homogeneous with respect to age and to maintain group size when children are coming and going from the BHs at various ages, “graduations” to new groups and caregivers are needed periodically. The consequence, however, is that children do not have the opportunity to have long-term relationships with a consistent set of caregivers.
Similarly, children with disabilities are also segregated, not only to provide them with specialized equipment and caregivers who are experienced in caring for such children, but as a reflection of the more general segregation of children and adults with disabilities in contemporary Russian society, just as it was some decades ago in the United States.
Common Themes in Orphanages Elsewhere
While orphanages can vary substantially in their conditions for children, several elements of the BH “culture” described above have been reported in the literature on orphanages in other European and East European countries (e.g., Groze & Ileana, 1996; Hough, 1999; Johnson et al., 1996; Kaler & Freeman, 1994; Provence & Lipton, 1962; Rosas & McCall, 2008; Sloutsky, 1997; Spitz, 1945; Tizard & Hodges, 1978; Tizard & Tizard, 1971; Vorria et al., 1998a, 1998b). Common themes across these reports include a two-room suite for housing children, many different caregivers and periodic “graduations” to new caregivers, minimum training of caregivers, caregivers who work long hours and spend little time interacting or talking with children, caregiver social–emotional detachment from children, caregiver-directed interaction, group scheduling of caretaking activities, children spending long hours in cribs or playpens often engaged in stereotypic self-stimulation behaviors, caregivers who do not respond quickly to crying, children who ignore or are indiscriminately friendly to strangers, and children who do not seem to know how to play with objects or peers (St. Petersburg–USA Orphanage Research Team, 2005).
History of This Project
Background
The groundwork for this project began separately in St. Petersburg and in the United States before a collaborative project was conceived.
In St. Petersburg
Democratic changes in post-Soviet society provided a context for the St. Petersburg City Committee in 1992 to start a city-wide pilot project called “Infant Habilitation” (Kojevnikova, Chistovich, & Muhamedrahimov, 1995), which was to provide interdisciplinary aid to children from medical, biological, and social risk groups in the first months of their lives. The program emphasized working with infants and their families in a preventive manner and discouraged the common practice of parents relinquishing their children and separating children from their families. The program was to begin in one BH directed by Natalia Nikiforova and in a newly organized intervention service at a progressive child care center (Center for Inclusion) at which Rifkat Muhamedrahimov was scientific leader and assisted by Oleg Palmov, the three members of the St. Petersburg Research Team of the current project. The program was influenced by philosophical advances in Sweden (Bjorck-Akesson & Brodin, 1991), early intervention programs in the United States, and the emerging literatures on attachment, mental health in infants and young children, and caregiver–child interaction-centered programs (e.g., Ainsworth et al., 1978; Beckwith, 1990; Bowlby, 1969; Brazelton & Cramer, 1991; Crittenden, 2001; Emde, 1987; Greenspan & Wieder, 1998; Krauss & Jacobs, 1990; Osofsky, 1995; Osofsky & Connors, 1979; Stern, 1985).
In the BH, professionals started using assessments of children's development to guide educational activities and to stimulate children with severe disabilities who had previously been considered untrainable. Cooperation between the BH and the Center for Inclusion produced workshops on early social–emotional development and intervention programs as well as studies of the characteristics of the social environment of children in the BHs (e.g., Muhamedrahimov, 1999). This collaboration fostered ideas of possible ways to provide a better social–emotional environment, a more family-like environment, and more consistent caregiving in the orphanages (Muhamedrahimov, 1999; Muhamedrahimov, Palmov, & Nikiforova, 1996).
In the United States
At the same time, the IAG, a Pittsburgh adoption agency working in several BHs in St. Petersburg and elsewhere, was interested in improving the care provided to children in the orphanages. IAG sent Christina Groark, Co-Director of the University of Pittsburgh Office of Child Development and a specialist in creating collaborative intervention service programs for young children, and Kathryn Rudy of the Office of Child Development to St. Petersburg in 1992 to meet with a variety of politicians as well as orphanage administrators and child development specialists, including those who would become the St. Petersburg Research Team, to explore possibilities for BH improvements.
The St. Petersburg–USA Orphanage Research Team
In 1994 Groark and Rudy were accompanied by Robert McCall, Co-Director of the University of Pittsburgh Office of Child Development, to visit St. Petersburg, and in 1998 Groark and McCall plus Nikiforova, Muhamedrahimov, and Palmov collaboratively began to design specific changes in a BH that would likely improve the development of children. Long planning sessions took place at several meetings in St. Petersburg and in the United States over the next several years. Thus, the current project was designed as an international collaboration. It was not a U.S. project dropped into the orphanages of St. Petersburg or a St. Petersburg project simply in need of technical assistance; it was the result of a true partnership that required the contributions of all five of its members.
III. RESEARCH DESIGN AND INTERVENTIONS
This chapter describes the general research design and the two interventions implemented in this project.
HYPOTHESES AND UNUSUAL FEATURES
The current study was guided by several hypotheses and was unusual in numerous respects.
Hypotheses
The primary general hypothesis was:
An improved social–emotional early environment and the opportunity to develop caregiver–child relationships in the first year or two of the lives of institutionalized children will produce more advanced development in physical growth and functioning, mental and language abilities, personal–social behavior, and more mature caregiver–child interactions and social–emotional behaviors that reflect more positive relationships with caregivers. This hypothesis follows from the theoretical and empirical literature cited in Chapter I.
Several more specific hypotheses guided this work.
The early social–emotional-relationship environment can be improved through training and certain structural changes pertaining to the physical environment, employment practices, and daily procedures, and children who experienced both of these interventions will improve developmentally to a greater extent than those experiencing only training and both of these groups should be better than children having no intervention at all. As described below, training emphasized warm, sensitive, responsive caregiver–child interactions, and structural changes created an environment that promoted caregiver–child relationships; thus, the two interventions supported each other and should improve development more than training only.
The interventions were designed to promote developmentally appropriate caregiver–child interactions, and thus the longer children were exposed to the interventions, which were intended to match the child's changing developmental status, the greater the children's developmental improvement.
The interventions should benefit children with a variety of disabilities as well as typically developing children.
BASIC RESEARCH DESIGN
A quasiexperimental design was used in which two interventions and a control condition were implemented in the natural environments of three Baby Homes (BHs) for children birth to approximately 4 years of age in St. Petersburg, Russian Federation (see also Groark, Muhamedrahimov, Palmov, Nikiforova, & R. B. McCall, 2005; Muhamedrahimov, Palmov, Nikiforova, Groark, & R. B. McCall, 2004).
Between-BH Research Design and Timeline
Figure 1 presents the basic between-BH research design and the timeline of interventions and assessments. Three BHs each received a different intervention condition.
Figure 1.

Design and timeline of study. Children's assessment schedule: Intake, 3, 6, 9, 12, 18, 24, 36, 48 months and departure.
Two types of interventions were employed (described below). Training provided caregivers with knowledge of early childhood development of typically developing children and those with disabilities and encouraged caregivers to interact with children in developmentally appropriate, warm, caring, sensitive, responsive ways, especially while performing routine caregiving duties and during play periods. Structural changes consisted of a set of physical, employment, and procedural changes designed to provide an environment more conducive to developing caregiver–child relationships by reducing group size and having fewer caregivers who were more consistently present in children's lives.
Both interventions contributed to the overriding goal of changing the “institutional” behavioral culture characterized by aloof, perfunctory caregiving conducted impersonally in large groups by many changing caregivers to an atmosphere that was more typical of warm, sensitive, responsive “parent–child” interactions conducted in a more “family-like” set of circumstances. The interventions, each based on a research literature, focused more on attitudes and behavioral styles (e.g., be responsive, talk, interact, be warm and caring, display emotions and feelings, develop relationships) coupled with knowledge of children's behavioral development that each caregiver would carry out in her own way and adapt to different situations and different ages of children, rather than a set of specific behavioral actions, activities, or organized programs of activities that would be carried out according to an established schedule. Although a main purpose was to partially separate the effects of training only from training coupled with structural changes, we expected the two interventions to complement and synergize each other. Further, the literature on attachment and the development of children adopted from institutions, for example, suggests that this new behavioral culture should be most influential in children's lives between approximately 6 and 18−24 months of age, and most orphanage children spend at least part of this interval in residence.
Training Plus Structural Changes
Both the Training and Structural Change interventions were implemented in one BH, hereafter abbreviated T+SC. Procedurally, before any interventions were implemented, baseline assessments were administered on caregivers and children in residence at the time (see Chapter IV). This was followed by implementing training, which consisted of “classroom” training followed by supervision, and by simultaneously implementing structural changes, some of which were enacted over a longer period as children entered and left the BH. When both interventions were completely implemented, assessments began annually on caregivers and at specific ages for children.
Training
Training Only, hereafter abbreviated TO, was given to a second BH. Procedurally, baseline assessments were conducted initially, followed by training and supervision, and then the scheduled assessments. Because the same personnel were required to implement training in both BHs, T+SC was trained first followed by TO.
No BH received structural changes alone. The rationale for this decision was based on limited financial resources and on the expectation that structural changes were likely to have limited benefit for children unless caregiver behavior was changed through training. That is, closer contact with fewer caregivers who continued to behave in an aloof, business-like, unresponsive, and insensitive manner was hypothesized to be of limited benefit to children. This expectation may be wrong: The structural changes that reduced group size and number of caregivers and produced more consistency in caregiver–child assignments might have elicited more warm, sensitive, responsive caregiving behavior naturally (J. Belsky, personal communication, March 30, 2006), and a pilot intervention (Smyke et al., 2002) involving fewer and more consistent caregivers but without formal training reduced the frequencies of caregiver-reported reactive attachment problems but did not significantly improve reported language development.
No Intervention
The third BH continued operation as usual and received No Intervention, abbreviated NoI. It entered the project after training was completed in TO. Baseline assessments were conducted as in the other BHs, followed immediately by scheduled assessments on caregivers and children.
Design Complexities, Threats to Validity, Limitations
While the basic between-BH design appears straightforward, numerous complexities existed. While these complexities and potential threats to validity are typically presented in the discussion section, they are given here to assist readers in understanding several statistical strategies and the importance of certain results that minimize potential confounds.
Nonrandom Assignment of BHs
The three BHs were not randomly selected among BHs in St. Petersburg nor were they randomly assigned to experimental conditions. The three BHs were selected because they were among the best in St. Petersburg and their directors were willing to cooperate with the procedures of this project. One of the directors was willing to implement structural changes, another wanted training, and the third believed in the “traditional methods” commonly employed in BHs. Thus, all three directors believed in the interventions they received. While it was not obvious that the directors differentially influenced the results, from a practical standpoint directors must have some commitment to their intervention or control condition for it to be implemented appropriately (see Chapter XII). Consequently, results should not be generalized to orphanages randomly assigned an intervention without the director's commitment to that intervention.
BH Differences
The three BHs were very similar in their general physical facilities, toys and equipment, medical care, nutrition, and sanitation, and caregivers were similarly trained, employed on similar schedules, and maintained similar behavioral styles. Inevitably, however, as in any quasiexperimental study conducted in naturalistic environments, the three BHs were not identical. Analyses of baseline data (not reported) indicated that these differences did not clearly favor one versus another BH. Nevertheless, statistical procedures were employed to deal with initial differences for most child outcome measures.
Children With Disabilities
While all the children are considered “at risk,” some children arrive at the BH with frank disabilities, which span the entire range of possible syndromes except AIDS (those children are assigned to a separate facility). T+SC tended to be sent more children with disabilities than the other two BHs, because it was a site for pediatric students to observe such children. While it was clear in TO and NoI which children were considered by BH personnel to have a disability because they were assigned to special wards, the structural changes intervention integrated children so it was no longer always clear which children that BH decided had disabilities. As a result, the Functional Abilities Index (Simeonsson & Bailey, 1988, 1991) was introduced and a criterion implemented (see Chapter IV) to designate children as typical or with disabilities, and analyses were usually conducted separately on these groups of children.1
Age Variability
While most children arrived at the BHs within the first 6 months of life (average age is 6.4 months; St. Petersburg–USA Orphanage Research Team, 2005), children arrived at any age up to approximately 4 years. Further, children left the BH at various ages, typically in the first 2 years of life if they were adopted or restored to their biological parents and after age 4 if they were transferred to other institutions. Consequently, children had variable lengths of residency and exposure to the treatment conditions, which occurred at different ages. Four months was arbitrarily considered the minimum amount of exposure to the interventions after they were completely implemented (or 4 months of residency after NoI baseline was started).2 Analytic procedures were employed that dealt with age at initial assessment and age variations within different lengths of exposure to the interventions when this seemed theoretically relevant.
Selective Attrition
As noted above, children who were adopted or restored to their parents tended to have fewer disabilities and perhaps be healthier, more advanced developmentally, and perhaps more personable, and they left the BHs at younger ages than other children. These circumstances produced selective attrition, which can be confounded with length of exposure to the interventions. Selective attrition tended to occur similarly in all three BHs, so between-intervention comparisons are relatively unconfounded. However, explorations of the effects of length of exposure (i.e., “dose response”) and its potential interaction with intervention group were studied with both a cross-sectional sample of all children exposed either 4−9 or 9+ months, which provided the maximum N but was potentially influenced by selective attrition, and a longitudinal sample of children assessed after 4−9 and 9+ months, which possibly was a selected subsample and had smaller N, but could reveal intraindividual change. As a result, most child outcomes were analyzed on four samples—cross-sectional and longitudinal samples of typical children and children with disabilities. It should also be noted that length of exposure is confounded to some extent with specific ages at exposure, with the 9+ months exposure group having experienced the intervention at somewhat older ages.
The complexities of the database outlined above limited our ability to calculate simple correlations among dependent variables and between covariates and dependent variables, as would usually be reported. These would be more complicated analyses than usual and are not reported here.
Independent and Blind Assessments and Coding
Many assessments, including the assessments of caregivers’ behavior on the ward, children's general developmental progress, and a structured caregiver–child interaction procedure were administered and scored by independent personnel (typically graduate students in psychology) hired specifically for these tasks. Other data were routinely collected by BH professional staff as part of the general operation of the BH, including periodic assessments of children's physical growth and medical diagnoses and illnesses. BH personnel also were taught to administer the Functional Abilities assessment, because they were most familiar with the child's capabilities. Obviously, none of these assessments could be conducted blind with respect to intervention group. While the structured assessment of caregiver–child interaction was videotaped and clearly identifiable information was minimized on these tapes, coders of all the caregiver–child interaction variables reported in Chapters X and XI could determine from the room and caregiver personnel which intervention group was represented. In addition, several assessors and coders were used for each measurement and attempts were made to distribute them across intervention groups to balance any observer differences. Assessors and coders were not told the hypotheses or any results, but the general intent of the study was implicitly clear. Also, child mental and behavior assessments were all administered in one sitting, although different measures were taken from different components of the assessment procedure (except for the Infant Affect Manual and attachment measures). While this lack of total independence and blinded assessment constitutes a potential scientific limitation, such circumstances commonly exist in quasiexperimental naturalistic studies and interpretive emphasis will be placed on the total pattern of results across such conditions to minimize the influence of any potential bias inherent in any one.
Sequential Implementation of Interventions and Secular Change
It was necessary to train the T+SC group first followed by the TO group to be able to use the same trainers and accommodate the amount of work required to train and supervise caregivers. This raised the possibility of certain confounds, specifically secular changes that might have occurred in the Russian Federation and having the training personnel learn something from the initial training of T+SC staff and use those lessons to improve the subsequent training in the TO BH. Although foreign adoption rates changed as a result of political circumstances during the course of the project and economic conditions progressively improved, such secular changes were unlikely to have had much influence on low-income individuals, such as parents relinquishing their children and caregivers. Further, lessons learned from the initial T+SC training should have improved training and results for TO, which would be counter to the hypothesized T+SC>TO results and did not occur.
A more threatening secular change was the sudden and unexpected death of the director of the NoI BH and the political ousting of the director of the TO orphanage during the course of the study. Both events had the potential to produce anxiety and uncertainty in caregiver staff, although this might be stronger among BH administrators and professionals who work more directly with the BH director than among caregivers. Fortunately, the assessment battery included assessments of anxiety, depression, and job satisfaction, and with only one or two exceptions, longitudinal data did not reveal obvious effects of these unanticipated events on caregivers’ attitudes or behaviors with children (see Chapters VII and X).
Baseline Versus Intake Initial Assessments
During the baseline period before any interventions were implemented, all children in residence were given an initial set of assessments. Children who arrived at the BH during or after any intervention was implemented were given their initial assessments within two weeks of intake. All children's outcome assessments analyzed in this report were made after at least 4 months exposure to the completely implemented interventions. Consequently, the time between a child's initial assessment and the 4+ months outcome assessment could vary from approximately 4 months for a child who arrived after implementation was completed to as much as 16−18 months (implementation could take up to 12 months) for a child in residence during baseline (although relatively few children stay this long). Preliminary analyses compared these extremes on Battelle performance, and while differences occasionally were found, they were not systematic or consistent. Consequently, this variation between children was subsequently ignored, and any variability associated with this difference became part of the error term in analyses.3
Repeated Testing
No procedural controls or comparison groups were implemented to assess directly possible effects of repeated testing. However, any benefits of repeated assessments should be spread evenly among the intervention groups, so even interactions of length of exposure with intervention group should not be attributable to repeated testing.
Caregiver “Acting” for the Assessor
The training clearly told caregivers in the T+SC and TO BHs what behaviors were expected, and caregivers knew when an assessor was observing their behavior on the wards or in structured caregiver–child interaction assessments. Therefore, caregivers could perform the expected behaviors while being assessed, but not at other times when assessors were not present. If this were a major bias, then T+SC and TO caregivers should behave similarly because both groups knew what was “expected,” and children in these two groups should similarly provide identical results if the caregivers did not change when assessors were absent (children did not know what was “expected”). This pattern of results did not occur. Occasionally, caregivers from T+SC and TO, and sometimes from all three BHs, were on their “best behavior” at the first assessments, but TO and NoI caregivers reverted to their typical behavior as time went on. Also, while T+SC and TO caregivers were given the same training, there were substantial and pervasive differences observed between T+SC versus TO caregivers and children. Therefore, it is unlikely this potential bias played a major role in the results.
Hawthorne Effect
Some attempt was made to minimize a potential Hawthorne effect in which the T+SC personnel might do better because they knew they were the major intervention BH. Each intervention group received numerous visits by the Research Team before and during the project as well as some tangible benefits, including some remodeling of caregiver space, additional furniture, and even videotaping for a program describing the project. In addition, caregivers in each BH were compensated for attending assessments. Finally, the directors of each BH desired the experimental condition assigned to their BH. Nevertheless, it was impossible to control perfectly for Hawthorne effects, which is the case in most quasiexperimental naturalistic studies.
Conclusion
The above provisions and data analytic procedures permit the total design to cover, at least to some extent, all of the major features of the prototype longitudinal intervention study (e.g., Solomon & Leesac, 1968).
Unusual Features
To the best of the authors’ knowledge, this project is unusual in several respects relative to one or both of the recent orphanage intervention studies described in Chapter I (i.e., Smyke et al., 2002; Sparling et al., 2005) and with respect to the literature on training and interventions in early childhood contexts more generally:
This is one of the more direct tests of the hypothesis that a social–emotional-relationship intervention can improve the development of young children in an orphanage in which medical care, nurturing, sanitation, safety, toys, equipment, and lack of abuse were at acceptable levels. It must be acknowledged that the social–emotional-relationship interventions represent a specific emphasis, but they include elements that would also be considered stimulation for mental, communication, and motor development. For example, improving the social–emotional interaction between caregivers and children (e.g., encouraging more talking and responsive interactions) also can be expected to stimulate the language and mental development of children. Thus, the interventions in this project, similar to other responsive caregiving interventions (e.g., Landry et al., 2006), are primarily but not purely social–emotional-relationship building; it is difficult to imagine a comprehensive social–emotional-relationship intervention that would not include such stimulation.
It is one of the largest institutional intervention studies, involving three orphanages and a maximum of 530 caregivers and 954 children, although the samples available for most analyses are much smaller but nevertheless larger than the previous studies.
The current study is one of the few quasiexperimental tests of the effects of both training in sensitive and responsive caregiving and structural changes designed to promote relationship building in an early childhood facility, and effects for these two interventions can be partly separated.
The study is one of the most direct and comprehensive tests of the psychosocial short stature hypothesis that physical growth can be improved by quasiexperimental interventions that improve the social–emotional-relationship environment without changing nutrition and medical care.
It is one of the largest intervention studies for children birth to 4 years of age that includes all types of disabilities (except HIVand AIDS) plus typically developing children in a homogeneous context that explores social–emotional-relationship interventions (rather than skill development) and measures all major aspects of development (Shonkoff, Hauser-Cram, Krauss, & Upshur, 1992).
While the study was quasi-experimental, data were available on birth circumstances, caregiver behavior, and children's initial developmental values that could be covaried from the outcomes.
The interventions were implemented by regular staff members, designed to be self-sustaining after the project and its funding terminated, and potentially could be implemented in new orphanages for the cost of training and structural modifications.
It is one of the largest attempts to train otherwise minimally trained caregivers of young children coupled with the most comprehensive and independent assessments of caregiver attitudes, behavior with the children, and especially measurements of the development of children in their care.
THE TRAINING INTERVENTION
The primary purpose of the training intervention was to teach caregivers to be more socially responsive in their interactions with children in every aspect of life in the orphanage. The training taught new information and encouraged behaviors more typical of Russian birth parents (e.g., Bronfenbrenner, 1970) but that were less commonly displayed in the BHs, such as (1) being more warm, affectionate, and responsive to individual children; (2) being more child-directed (i.e., responsive) than adult-directed; (3) promoting more independence and creativity in children rather than obedience and conformity; (4) learning how to be more emotionally available, sensitive, and responsive during all aspects of care for children between birth and 4 years of age (caregivers had been assigned to children of a specific age); and (5) learning how to care for and position children with a variety of disabilities in ways that would allow the children to participate more fully in developing relationships with caregivers and experiencing the perception of effectence that comes with a socially responsive environment.
Train-the-Trainer Strategy
A train-the-trainer approach was adopted for two main reasons. First, the trainers, who were St. Petersburg professionals working in the BHs, could modify the U.S.-supplied training materials to fit the specific needs of the personnel of the BH. While this meant that the training might be slightly different for T+SC versus TO, the training actually received by caregivers was more likely to be typical of training in general (e.g., a good teacher matches the curriculum material to the level and circumstances of the learner) and more appropriate to the specific orphanage context. Second, the trained professionals could train new replacement staff and in the future professionals and caregivers in other BHs in St. Petersburg, in the Russian Federation, and perhaps in other countries.
However, training the trainers meant that certain topics had to be added to the curriculum solely for trainers to support them as teachers and some as supervisors of the caregivers. This was necessary, because when the project started, there were few professional or educational programs of training, except for medical nurses and pediatricians, in the Russian Federation that were specifically aimed at the care, nurturing, and education of children birth to 4 years of age, precisely the ages of the children in the BHs. Consequently, even most of the professionals had minimum formal training in modern approaches to promoting development in infants and young children or in how to motivate and teach adult learners. Further, although some senior professionals in the BHs were charged with supervisory responsibilities, supervision was not consistently a part of the BH day-to-day routine, yet the American research literature indicates that training alone without continuous on-the-ward supervision is relatively ineffective, not only in the child care context (Kelley, 1999) but in many others. Consequently, material on supervision was included.
The Curriculum Philosophy
The common elements of the training intervention consisted of (1) a set of curriculum modules that constituted the trainer curriculum, most of which also formed the caregiver curriculum; (2) the train-the-trainer strategy; and (3) the training process that was used.
Smith, Miller, and Bradekamp (1998) proposed that the basis of training staff who will work with children in inclusive settings be a combination of Vygotsky's sociocultural theory (Berk & Winsler, 1995), the Division of Early Childhood (DEC) of the Council for Exceptional Children Recommended Practices (DEC, 1993), the National Association for the Education of Young Children (NAEYC) Developmentally Appropriate Practices (Bradekamp & Copple, 1997), and the Personnel Standards recommended by both organizations (DEC, 1995). Smith et al. (1998) described the key shared components of the DEC, NAEYC, and Vygotsky approaches, and these common themes plus adult learning theory and practices guided the development of the training materials and training process. At the same time, the training program was designed to be sensitive to the values and philosophy toward children of people in the Russian Federation (e.g., Bronfenbrenner, 1970) as well as to follow the lead of contemporary Russian Federation professionals (e.g., Galiguzova, Mescheriakova, & Tcaregurodtceva, 1990; Muhamedrahimov, 1999) who advocated more socially responsive caregiving and more attention to social and emotional development in the caregiving of orphanage children.
The curriculum also blended elements of five major perspectives. The psychoanalytic point of view focuses on children's freedom to select their own activities (e.g., Anastasiow & Nucci, 1994) and to form relationships and representations of self and others (A. Freud, 1937; Mahler, Pine, & Bergman, 1975). The infant mental health approach emphasizes developing close relationships and attachments with a few consistent caregivers (e.g., Ainsworth, 1979; Ainsworth et al., 1978; Bowlby, 1958, 1969; Brazelton & Cramer, 1991; Emde, 1987; Greenspan & Wieder, 1998; Osofsky, 1995; Stern, 1985). The environmental approach rests on the belief that the arrangement of the environment will foster learning based on the child's interests, largely through child-directed activities rather than teacher-directed instruction (e.g., Peterson, 1987). The behavioral approach emphasizes some teacher-directed instruction and the use of behavioral contingencies to achieve behavioral control (e.g., Strain et al., 1992), and the developmental approach stresses matching teaching methods and context to the developmental abilities of the children (e.g., Safford, Sargent, & Cook, 1994). The Research Team discussed how to combine elements of each perspective, specifically promoting child-initiated activities, responsiveness of caregivers to appropriate child initiations, positive (i.e., social) rewards, and the promotion of development for children with and without disabilities through developmentally appropriate practices.
Phases of the Training Intervention
Initially, the St. Petersburg–U.S.A. Orphanage Research Team discussed the nature of the training and how it should be implemented. Then the training intervention was conducted in seven phases, and these phases were implemented first in T+SC and subsequently in TO (see Table 1). The procedure was as similar as possible for the two BHs, but certain adjustments had to be made to accommodate different circumstances. For example, the initial planning for training was shorter in the second TO BH because much had already been planned in general terms when preparing for the first T+SC BH. Also, caregiver training and supervision took longer in TO, because there were substantially more caregivers (N = 108 vs. N = 76).
TABLE 1.
Schedule of Training Intervention Phases in the Two Baby Homes (BHs)
| Phases | T+SC BH | TO BH |
|---|---|---|
| I. Planning for training initiation | June/July 2000 (8 weeks) | Mid-November-mid-December 2001 (4 weeks) |
| II. BH observation | August 2000 (2 weeks) | December 2001 (2 weeks) |
| III. Professional training | September 4-October 6, 2000 (4 weeks) | January 14-February 8, 2002 (3 weeks) |
| IV. Material modification and trainer preparation for teaching | October 7-October 17, 2000 (2 weeks) | February 9-February 28, 2002 (3 weeks) |
| V. Caregiver training | October 17-December 15, 2000 (9 weeks) | March 2001-May 29, 2002 (13 weeks) |
| VI. Supervision (implementation training) | March 2001 (2 weeks), April 2001 (2 weeks), and May-September 2001 (12 weeks) | September 2002-December 2002 (15 weeks) |
| VII. Policy development | Continuously, as needed | Continuously, as needed |
TO = Training Only; T+SC = Training + Structural Changes.
Phase I. Planning for Training Initiation
The American Training Director, Jacqueline Dempsey, PhD, spent time on the wards of the BH meeting the Special Teachers and the caregivers, observing their routine and behaviors, and actually joining them when appropriate in performing their duties, including routine caregiving, cleaning, feeding, changing, and other activities. The purpose was not only to acquaint Dempsey personally with the caregivers and with their current activities and behavioral style but also to develop a collegial relationship with them that would engender trust, confidence, respect, and friendship.
Phase II. BH Observation
In this 2-week phase, the Training Director observed caregivers to understand how they behaved, the routines they followed, and what aspects of training they could reasonably be expected to implement and how. For example, when children were awake, caregivers were very busy and had no extra time, so social responsivity would need to be implemented, not primarily as an extra activity, but as a behavioral style ingrained in how staff conducted routine caregiving activities.
Phase III. Professional Training
This phase, conducted by the Training Director in cooperation with the St. Petersburg Research Team and consultants Ludmila Istomina and Joy D. Osofsky, consisted of intensive training over a 25-work-day period of the professionals of the BH, which included the Administrative Director (a pediatrician), pediatricians, neuropathologists, Special Teachers (i.e., similar to special educators in the United States, who would become the caregivers’ supervisors), counselors, head nurse, and social worker. Some of these professionals became the trainers of the caregivers in the subsequent phase, while other professionals participated in the training program to become aware of the changes being implemented so that they could support them in the operation of the BH. A total of 14 professionals were trained in the first T+SC BH and 12 in the second TO BH.
Training the professionals included coverage of the written curriculum of modules, hands-on application through modeling and demonstrations with a few selected infants from the BH, training videos, and observations on the ward with follow-up discussions.
Nineteen individual written Training modules were developed for use by the BH professionals to ensure a common initial foundation across professionals and caregivers in both BHs. The modules typically included a projected amount of time the specific training should take, a listing of materials needed for the session, a description of an introductory group activity, overhead transparencies, a brief description of what to say while presenting the material on each transparency, practice activities, and a culminating activity. The modules covered material that would be taught to the caregivers plus material to help the professionals teach the caregivers.
Some modules were adapted from existing training programs [i.e., the Northeastern Regional Higher Education Institute, the Family Focused Early Intervention System (FFEIS) modules], while others were developed specifically for this project by members of both U.S. and St. Petersburg Research Teams. Modules covered administration and supervision; adult learning (professionals only); expected caregiver behaviors; behavior management; Carolina Curriculum (professionals only); consultation and conflict management; risk categories and disabling conditions; feeding and adaptive behavior; touch therapy and infant massage; naturally occurring teacher strategies; play; signs of possible visual, auditory, or emotional problems in young children; stimulating cognitive, emotional, language, and motor development; positioning and handling; teams and teaming; primary and secondary caregiver roles (only T+SC); and caregivers, attachment, and infant mental health. Providing warm, caring, sensitive, responsive interactions with children was stressed in all modules.
Phase IV. Material Modification and Trainer Preparation for Teaching
Following their training, professionals volunteered according to their expertise and interests to teach the specific topics to the caregivers. In addition, they met with the Training Director and Project Manager (Palmov) to discuss (1) any changes needed in the materials and proposed schedule, (2) whether one domain or another should be emphasized, (3) accommodations to the caregivers’ level of knowledge, and (4) making the material more consistent with the culture and experience of the caregivers. Ultimately, all decisions regarding content were made by the St. Petersburg trainers responsible for that module.
Phase V. Caregiver Training
The professionals trained the caregivers who provided direct care of a general type to the children on the wards (N = 76 in T+SC, N = 108 in TO). The same Training was offered on each of 4 consecutive days, and the caregivers attended the day that was most convenient for their work schedules. The number of caregivers attending each session varied from 15 to 35, and the sessions were conducted by the BH professionals, St. Petersburg Research Team members, and consultants under the supervision of the Training Director and the Project Manager. Caregivers attended 12−14 training sessions for a total of approximately 60 hr. Although training and supervision took longer in TO because there were more caregivers, each caregiver received the same amount in T+SC and TO BHs. All professionals and caregivers were compensated at their normal hourly rate for the extra time spent in Training, plus they received a $50 bonus after fully completing the Training.
Phase VI. Supervision (Implementation Training)
Special Teachers were designated to monitor and supervise caregiving staff on a day-to-day basis with respect to implementing the content of the training. Because Special Teachers had little or no preparation in observing, evaluating, and guiding staff, they were trained to do so.
The first step was to train the Special Teachers to observe the caregivers with respect to the kinds of behaviors the classroom instruction was designed to promote. A set of written observational guidelines was developed to help Special Teachers know what to look for in caregiver behavior. These guidelines consisted of 7−20 specific caregiver behaviors within five domains: (1) responsiveness; (2) developmental appropriateness, individuation, and adjustment to the behavior of the child; (3) emotional tone/relationships; (4) language; and (5) best practices. The Training Director and Project Manager first discussed each item with the group, and at subsequent sessions presented films of an adult (non-BH caregiver) working with individual children which were then critiqued and discussed. Then the Training Director conducted three practice sessions while the Special Teacher watched in which the Training Director worked in a group of children while the caregiver and the Special Teachers “scored” the Training Director on each item and discussed their ratings.
Next, the Training Director taught each Special Teacher individually to make direct observations and provide feedback to the caregivers in the group to which she was assigned and would ultimately supervise. Each caregiver in that group was asked to prepare to be observed by the Special Teacher, the Training Director, and a translator for a 30-min period, followed by a discussion of the observation with the Training Director and the Special Teacher. The Training Director and the Special Teacher then agreed on positive behaviors to praise and one recommendation for improvement to be worded in a very concrete, positive, encouraging way, which information was recorded on a form.
The Training Director conducted three to five such formal observations each day. In addition, all of the Special Teachers met with the Training Director and the Project Manager weekly to discuss problems, brainstorm ideas for changes within specific groups, and identify issues for which additional Training or materials would be helpful.
To train new staff hired after training was completed, the Project Manager and Training Director, with input from the professionals, condensed the training into 10 half-days for approximately a total of 25 hr of training. New staff were then trained by the professionals of each BH periodically when enough new staff had been hired to make it worthwhile.
Phase VII. Policy Development
Although the BHs had a variety of internal rules and regulations, some methods of handling various situations were formalized in written “guidelines” or “policies.” The project staff identified a variety of issues for which they felt formal guidelines or policies would be useful. Policy statements were drafted and reviewed by the Training Director and Research Team as needed during and after training.
THE STRUCTURAL CHANGE INTERVENTION
The structural change intervention was intended to complement training by changing a variety of structural, employment, and procedural circumstances that research and best practice suggest should encourage closer and more consistent relationships between children and caregivers. Structural changes consisted of a set of changes, each of which is described below, preceded in each case by the conditions that existed before structural changes and that continued to characterize the TO and NoI BHs.
Group Size
The size of the group of children who lived together in a single suite of rooms was cut in half from 10−14 to 5−7. This change was consistent with Russian Federation regulations (but rarely implemented) as well as American child care literature relating smaller group size to quality of care and developmental benefits for children, presumably because smaller groups provide trained teachers more opportunities to implement their specialized skills with children (Kontos et al., 1995; Love, Schochet, & Meckstroth, 1996; NICHD Child Care Research Network, 1997, 2000; Peters & Pence, 1992).
Before Structural Changes
Before the intervention, children were housed in groups of 10−14 in wards consisting of a single sleeping room, an eating room that was also used by staff to keep records, a living/play room, a toilet/bathroom, a small kitchen area where food that was prepared in a single institutional kitchen was dished up and distributed to the children, and a small vestibule that contained lockers for clothes and chairs when children prepared to go outdoors. The groups of children were homogeneous with respect to age and disability status so that children were cared for en masse—all children slept, ate, and played at the same time and with considerable group conformity. The result was that the group was too large for children to be given individualized attention, and caregivers were stressed during feeding (especially of infants) and caretaking times but had little to do when children slept.
After Structural Changes
Each large group of 10−14 children was divided into two subgroups of 5−7 children. The entire group of children (e.g., 10−14 children) continued to sleep in one room, but the two other rooms were reassigned, one to each subgroup, and each room was to serve as dining/living/play room for that subgroup. To implement this change and to encourage each subgroup to remain in their own room to maximize contact with their own caregivers, these two rooms had to be made physically separate, so walls were built and doors added on two wards that lacked them. Further, some toys and equipment had to be purchased so that each subgroup had their own; otherwise, caregivers and children would need to “borrow” toys and equipment from the other subgroup, thus interrupting the focus on staying in the subgroup. This was especially true for equipment supporting children with disabilities. Also, large cribs and playpens that dominated the main rooms were removed to prevent caregivers from simply leaving children in these facilities and to provide larger living and play areas.
Fewer Caregivers
This component of structural changes was designed to lessen the number of different caregivers children experienced each week and over their period of residency and to provide more contact with a few selected caregivers who would be present every day. This was consistent with the conceptual principle that children need a few stable caregivers with whom to develop close relationships (e.g., Bretherton & Waters, 1985; Carlson & Sroufe, 1995) and that caregiver stability in child care settings is associated with better outcomes for children (e.g., Anderson et al., 1981; Barnas & Cummings, 1994; Howes et al., 1994; Kontos & Fiene, 1987; NICHD Child Care Research Network, 2000; Oppenheim et al., 1988).
Before Structural Changes
A variety of practices and preferences, some of which could not be easily altered, contributed to children having many different caregivers.
First, caregivers felt their jobs were arduous, psychologically unrewarding, low paying, and low status (Muhamedrahimov, 1999). Some caregivers viewed the job as somewhat depressing, because the children were abandoned by society and many had disabilities in a society that was generally not comfortable with people with disabilities. So few caregivers worked at the BH every day.
Second, both the BH administrators and caregivers preferred caregivers to work very long hours on a single shift and then not work at all for 2 or 3 days. The BH, operated under the auspices of the Ministry of Health and directed by a pediatrician, preferred Medical Nurses to work 24-hr shifts so that the medical needs of children with illnesses and disabilities could be handled consistently across 24-hr periods, rather than changing staff every 8 hr and risking communications failures. Similarly, some caregivers preferred to work long shifts (10, 14, or 24 hr), some wanted to minimize transportation costs (which represented a substantial percentage of their low wages) and to hold other jobs or be home with their own children on their days off. Both Medical Nurses and Assistant Teachers, the majority of the caregiving staff, could find more lucrative employment elsewhere in the medical and educational systems. These employment practices meant that most caregivers tended to work only 1 or 2 days in a row with 1−3 days off.
Third, the BH had a practice of “graduating” children from one set of caregivers to another approximately when children started to crawl and then to walk and at 24 months, although the precise ages varied between BHs. This practice had been implemented so that caregivers could specialize in children of a specific age. Of course, it also meant that children had no caregivers for longer than approximately 3−6 months during the first 2 years of life.
Fourth, the government provided caregivers with 52−56 days of vacation per year, and turnover among staff was reportedly approximately 15−30% per year.
Fifth, to cover staff vacancies because of vacations, illnesses, and resignations, some staff worked overtime, but they worked in whatever group had a vacancy at the moment. So they were new to the children in that group, and they may be assigned to a different group the next time they were a substitute.
The net result of these practices was that children entering the BH in the first few months of life had approximately 9−12 caregivers per week, from 60 to 100 different caregivers plus professionals during the first 2 years of their lives, and typically no caregiver today whom they saw yesterday or would see tomorrow.
After Structural Changes
The goal was to provide individual children with closer and more frequent and consistent contact with fewer caregivers.
Primary and Secondary Caregivers
A new category of personnel was created, Primary Caregiver, whose ranks were filled predominately by Assistant Teachers but also by some Medical Nurses and Nursery Nurses. Two Primary Caregivers were assigned to each subgroup and were instructed to stay in the room assigned to that subgroup and work with those five to seven children to the most exclusive extent possible. Primary caregivers were required to work 5 days a week, 4 days for 7 hr a day and 1 day for 12 hr (a day the other primary caregiver had off). They were assigned staggered shifts, with one primary caregiver working from 7:30 a.m. to 2:30 p.m. and the other from 1:30 p.m. to 8:30 p.m., so that one of them was available to the children for 13 hr or most of the children's waking day. Further, their 2 days off were also staggered, so that one of the primary caregivers was present every day and both were present on 3 days a week.
The position of Nursery Nurse was eliminated and most Medical Nurses were given a new name, Secondary Caregiver. Four Secondary Caregivers were assigned to each subgroup, but they continued to work a 24-hr shift once every 4 days. All other staff continued to work the same schedule they had before. Thus, both Primary and Secondary Caregivers were assigned to subgroups, but only Primary Caregivers changed their work schedules.
The design of these changes can be seen in Table 2, which presents a simplified version (without staff turnover, substitutions, variable hours, absences, flexibility of hours, etc.) of staffing before these changes were implemented at the top and a simplified version after these changes were implemented at the bottom. Note that the number of caregivers was reduced from approximately 9 to 6 (a 33% reduction), and whereas children formerly saw no caregiver on consecutive days (although that did happen occasionally), children saw one of their two Primary Caregivers every day and the same Primary on several consecutive days. Caregiver:child ratios during most of the daytime hours had been approximately 1:4+ before and 1:3+ after structural changes, so this aspect did not change very much.
TABLE 2.
Simplified Schedule of Caregiver Work in a Group of 12−14 Children Before Structural Changes (Top) and in a Subgroup of 5−7 Children After Structural Changes (Bottom)
| Before Structural Changes | ||||||||
|---|---|---|---|---|---|---|---|---|
| Number of Work Hours |
||||||||
| Position | person | Sunday | Monday | Tuesday | Wednesday | Thursday | Friday | Saturday |
| Nursery | a | 14 | 14 | 14 | ||||
| Nurses | b | 14 | 14 | |||||
| c | 14 | 14 | ||||||
| Medical | d | 24 | 24 | |||||
| Nurses | e | 24 | 24 | |||||
| f | 24 | 24 | ||||||
| g | 24 | |||||||
| Assistant | h | 10 | 10 | 10 | ||||
| Teachers | i | 10 | 10 | |||||
| After Structural Changes | ||||||||
|---|---|---|---|---|---|---|---|---|
| Number of Work Hours |
||||||||
| Position | Person | Sunday | Monday | Tuesday | Wednesday | Thursday | Friday | Saturday |
| Primary | a | 7 | 7 | 7 | 7 | 12 | ||
| Caregivers | b | 7 | 7 | 7 | 12 | 7 | ||
| Secondary | c | 24 | 24 | |||||
| Caregivers | d | 24 | 24 | |||||
| e | 24 | 24 | ||||||
| f | 24 | |||||||
Substitutions within the group
Procedures were developed to assign new replacement staff and substitutes to specific groups rather than to any group needing someone at that time so that individual children would be exposed to fewer different caregivers over the year. Specifically, a fifth Primary Caregiver was assigned to a group to replace any of the four Primaries assigned to its two subgroups. If a second Primary Caregiver was absent, an attempt was made to have a Secondary Caregiver from that same group replace that Primary Caregiver. Similarly, caregivers who were willing to work overtime to replace other caregivers were encouraged to do so within their subgroups or groups to the extent possible. If a caregiver needed to replace a caregiver outside her group, attempts were made to always have her replace caregivers in a single specified group so that she become a substitute for only one other group (or as few groups as possible).
No graduations
The practice of changing caregivers and groups periodically was discontinued, which would reduce by a factor of 2−3 the total number of caregivers children experienced over their first 2 years of residency. Eliminating these periodic “graduations,” which is called “looping” (Edwards & Raikes, 2002), was more complicated than it first appeared and required the following two corollary changes that also promoted a more family-like atmosphere in each ward and increased the opportunities for caregiver–child interaction.
Integration by age
The subgroups were integrated by age as a function of attrition. That is, newly arriving children, most of whom were young infants, were distributed among all of the subgroups that had a vacancy. This allowed the subgroups to maintain a constant number of children and to use staff efficiently, while at the same time those children remaining in the BH would have the same caregivers over their entire residency. This intervention was consistent with a literature indicating improved child development in age-integrated groups (e.g., Bailey, Burchinal, & McWilliam, 1993; Bailey, McWilliam, Ware, & Burchinal, 1993).
Integration by disability status
Assigning new arrivals to whichever subgroup had a vacancy meant that the groups progressively would become integrated with respect to disability status as well as age. This intervention was consistent with the literature indicating more social interaction and improved social development of children in integrated settings (Buysee & Bailey, 1993; Chandler, Lubeck, & Fowler, 1992; DeKlyen & Odom, 1989; Guralnick, Connor, Hammond, Gottman, & Kinnish, 1996; McEvoy, Odom, & McConnell, 1992; Odom & Bailey, 2001; Odom & Brown, 1993).
These two changes were initially met with some concern by the staff. Some worried they could not handle the continuous variety of caretaking tasks, older children might hurt the infants, they could not care for children with disabilities or children who were different ages, integration would produce chaos on the ward, and caregivers would have more work and get “no breaks.” Project researchers emphasized that caregivers were not being asked to do more but rather to be more interactive when they were performing their routine assignments. For example, caregivers were encouraged to sit with the children during meals, talk with them, ask them about their food, and engage in conversation, rather than stand in the corner and monitor them. Also, play time could be staggered to some extent, with younger children sleeping while older children played, thus giving caregivers an opportunity to play with the older children. Conversely, older children could play by themselves while caregivers fed only 2 or 3 infants (rather than 10−14). Because integration by age and disability was implemented by attrition, it proceeded gradually and gave caregivers time to adjust.
Family Hour
“Family hour” was established to ensure that children and caregivers spent at least 2 hr each day interacting with each other, under the assumption that warm, responsive, reciprocal interactions would promote relationship building and improve the children's social and mental development (e.g., DeWolff & van IJzendoorn, 1997; Stams et al., 2002; van IJzendoorn & Sagi, 1999).
Before Structural Changes
Before structural changes, caregivers arrived and departed the wards throughout the day while performing a variety of chores, specialists took out individual or groups of children for various learning and therapeutic activities, and many biological and prospective adoptive parents and visitors would come to the wards at any hour of the day. Even after structural changes was implemented and caregivers were assigned to subgroups of children who lived in separate rooms, both children and caregivers often “crossed over” to the other subgroup because children and caregivers had to pass between the rooms to go to the toilet, outside, or to the kitchen and older children wanted to see their friends in the other subgroup.
After Structural Changes
Family hour consisted of 1 hr in the morning and 1 hr in the afternoon of each day during which the doors between the two living/play rooms of the two subgroups were closed and children and staff were expected to stay in their own subgroup room, playing and in peer- or caregiver–child interaction. Primary and secondary caregivers remained in the subgroup rooms, and visitors were not permitted. This system of frequent short-term “confinements” to the room of one's subgroup was more manageable and enforceable and seemed to accomplish the purpose of setting aside time specifically during which caregivers were to interact only with the children in their subgroup. This seemed to work, because soon older children would ask visitors to “come to my room.”
Pull-Out Groups
The practice of pulling children out of their subgroups for specialized services was minimized to maintain the subgroups as a child's main residence and to encourage coordinated team work among diverse staff.
Before Structural Changes
The BH provided a variety of specialized experiences and professional services to the children, either by taking an entire group to the music room, for example, or by pulling individual children out of their groups to provide speech and language lessons, specialized medical therapy, gymnastics, play sessions, and educational activities.
After Structural Changes
Pull-out services were changed during structural changes in two ways.
More specialized instructional services were conducted in the subgroup
Specialized services, such as massage and some special education activities, were encouraged to be held in the subgroup rather than in a private office. This was implemented so that the primary and secondary caregivers could observe what was done with the child, participate in the activities, suggest effective stimulation and materials for specific children, be partners with the professionals, and do some of the same activities when the specialized professional was not present. It made such activities a routine part of the subgroup, which was to be the child's main residential identity. Also, it permitted Special Teachers to observe caregiver activities in the subgroup and to provide guidance and encouragement in their role as supervisor. Of course, some therapeutic services did need privacy, quiet, and special facilities; but to the extent possible and appropriate, special services were encouraged to be held in the subgroup.
Some pull-out activities were organized by age and disability status
Individual children were pulled out of different subgroups to form groups that were relatively homogeneous with respect to age and ability level for activities that needed to be geared to homogeneous groups, such as, music, gymnastics, play sessions, excursions, art, sensory and fine motor stimulation, theater, and sign language and communication groups. Not only did this make the pull-out activities more appropriate for the children, but it broadened their peer contacts with agemates outside of their subgroup and group.
Staff Organization
Staff were organized and encouraged to work as a team to provide children with a more integrated, seamless living experience.
Before Structural Changes
There was little organization or integration of services across different levels of staff, partly because caregivers often worked in different groups on different days and at different times and could not consistently follow through on specialized activities.
After Structural Changes
Teams of professionals (e.g., Special Teachers, Pediatricians, Massage Therapists, Nurses, Social Workers, and Psychologists) were organized in both the T+SC and TO BHs (only during Training), facilitated by the St. Petersburg Research Team members. The teams discussed the needs of specific children, the needs of particular groups, the physical space for children, staff problems, supervision issues, and concrete plans of action to address pertinent issues. Each team met weekly or every 2 weeks. In addition, a Professional Team of BH administrators and professionals was organized and met every 2 weeks to discuss professional and administrative policies of the BH.
IV. ASSESSMENTS
This project included a great variety of assessments and measures on the caregivers and children. The assessments can be divided into four categories, those that assess (1) the implementation of the interventions, (2) outcomes in the caregivers, (3) outcomes in the children, and (4) outcomes of caregiver–child interactions. In addition, a variety of other information was collected on both caregivers and children that was used as categorization indices and covariates for caregiver and child effects.
ASSESSING THE IMPLEMENTATION OF THE INTERVENTIONS
Several measures were taken to demonstrate that the interventions were indeed implemented and produced the intended changes in the caregiving and structural environments in the Baby Homes (BHs).
The Implementation of Training
Pre/Posttest on Training Content
It was necessary to demonstrate that both the professionals and the caregivers actually learned the content of the classroom training.
Description
The Training Director created multiple-choice (four alternatives) questions covering every major aspect of the course content as contained in the written curriculum before any modification by BH professionals. The U.S. Research Team critiqued these items for form, accuracy, and appropriateness, and a revised set of 80 items were then divided into two test forms (Form A, Form B) each of which represented a sample of all of the course content and which could be considered equivalent, parallel tests (see Chapter V).
Procedure
The pretest was given by the Director of Training to both the professionals and caregivers on the first day of classroom training and the posttest was administered on the last day of classroom training. Generally, half of each group was given Form A and half Form B as their pretests (except the professional group in T+SC, all of whom were given Form A as their pretest) and then the other form was administered as the posttest. Certain psychometrics are presented as results in Chapter V.
Assessments of Structural Changes
The several components of structural changes implemented only in T+SC were assessed with different strategies to demonstrate that their implementation was accomplished as intended.
Fewer and More Consistent Caregivers
A major intent of adding Primary Caregivers, eliminating graduations, and assigning a restricted number of caregivers to be potential substitutes to specific groups was to reduce the number of different caregivers children experienced in a week and over the term of their residency and to increase the amount and consistency of exposure to those fewer caregivers.
Description
The official employment documents of each BH consisted of a record for every staff member of 16 different circumstances pertaining to the presence or absence and the number of hours worked for that staff member on every day of the month. The BHs also kept caregiver assignment records of the date each caregiver was assigned to work with a specific group of children and the date they terminated that assignment (i.e., assigned to another group), including substitutions. Comparable child assignment records indicated for each child the date of intake and the dates the child was assigned to each group and subgroup for the duration of the child's residence in the BH. These records permitted the calculation of which caregivers (and how many different caregivers) worked for how many hours and days in each group and subgroup of children. Variables extracted from these records included the number of consecutive days caregivers worked in each group and subgroup, the number of caregivers a child saw per month and accumulated over months in residency, and the number of children a caregiver served.
Group Size, Division of Wards
Dividing the groups into two subgroups was a structural change designed to promote relationships between the children and their caregivers.
Description
Group and subgroup sizes could be tracked from the child assignment sheets described above.
Age and Disability Integration
Description
The BH child assignment records tracked which children were assigned to which group and subgroup. The child's birth date, age, and Functional Abilities Index (FAI) were used to determine the mean age and functional ability per group and subgroup of children. Then the mean age and functional ability for the entire BH was subtracted from each group/subgroup mean, respectively, to reflect the extent each group/subgroup was similar to the BH as a whole. The more these differences approached 0.0, the more integrated the groups/subgroups.
Equipment
Certain equipment was purchased and distributed to groups and subgroups to make each subgroup self-sufficient, avoid the need for caregivers to leave the subgroup for equipment, and to support children with disabilities so that they could attend to and participate more easily in the activities and social relationships of the ward.
Description
The BH kept records of equipment added to the wards.
ASSESSING OUTCOMES IN CAREGIVERS
Changes as a result of the interventions were assessed in caregivers in four domains: (1) observed caregiver behaviors with the children on the wards; (2) problems, satisfaction, and attitudes toward their employment; (3) attitudes toward children; and (4) anxiety and depression.
Caregiver Behaviors With the Children
HOME Inventory of Caregiver Behavior
The intended consequence of training and structural changes was greater caregiver social interaction with the children and more warm, caring, responsiveness to child-initiated behaviors and activities. To document such changes, the HOME Inventory was administered by independent observers before any intervention was implemented, after implementation was complete, and annually thereafter for all Primary and most Secondary Caregivers (or Assistant Teachers and Medical Nurses in other BHs).
Description
A single-age version of the group-care modification (NICHD Study of Early Child Care Manual) of the HOME Inventory (24-month version; Caldwell & Bradley, 1984; see also Bradley & Caldwell, 1995) was used. A single-age version was used because groups of children in structural changes would be integrated by age and disability status. The 24-month version was selected because it was the middle age of children in the BHs, the younger versions are not much different than the 24-month version, and many of the children older than 24 months remaining in the BHs were likely to be delayed in development.
The HOME (Caldwell & Bradley, 1984) is one of the most widely used research assessments of home environments of young children, and it was adapted for use in group care environments by the NICHD Early Childhood Research Network. It consists of 5−11 items in each of six variety, clusters (Responsivity, Acceptance, Organization, Learning Materials, Involvement) that are scored yes or no. Subscales and total scores represent the sum of items scored yes.
The HOME (and all other scales originally in English) was translated by a professional translator who was also a psychologist, and the translations were checked and discussed by the bilingual members of the St. Petersburg Team. Another bilingual psychologist reviewed the translation and practiced administering the scale. Wording of items was modified slightly in consultation with Robert Bradley to fit the BH environments. Items that uniformly did not apply to the BH environments (e.g., a pet is accessible to children) were kept in the Inventory so that the scores reflecting the BHs could be compared with scores for other groups and environments. One original item was changed: The original item “the child eats a meal with a caregiver or other children once a day” was separated into “eats a meal with a caregiver. . . ” and “eats meals with other children at least once a day” and scored positively if at least one of these two separate items was passed. This was because children always ate in groups, and dividing the item permitted us to examine specifically if the caregiver ate with the children, which was encouraged by the intervention. At the same time, the combined item would be comparable to the original form.
Because the project was particularly interested in promoting social interaction between caregivers and children, a special a priori Sociability subscale was created by summing all items on the HOME that pertained to the social behavior of caregivers and children. Specifically, the Sociability subscale included the following 21 items: “Caregiver continuously vocalizes to children at least twice; responds verbally to children's vocalizations or verbalizations; tells children name of object or person; caregiver's speech is distinct, clear, and audible; caregiver initiates verbal interchanges with observer; caregiver converses freely and easily; caregiver spontaneously praises children at least twice; caregiver's voice conveys positive feelings toward children; caregiver caresses or kisses children at least once, caregiver responds positively to praise of children offered by observer; caregiver responds to any child's display of anxiety and distress; cuddly toy or role playing toys available; caregiver talks to children while doing household work; caregiver invests maturing toys with value via personal attention; caregiver structures children's play periods; caregiver provides toys that challenge children to develop new skills; biological mothers provide some care daily to some children; caregiver reads stories to children at least three times weekly; child eats meal with caregiver or children once a day; caregiver and children visit or receive visits from neighbors or friends once a month or so.”
Procedure
The HOME Inventory assessed an individual caregiver of 5−14 children, typically with other caregivers present. If the caregiver performed an item at least once focused on at least 1 child, she was given credit for that item. Thus, the scoring reflected the “presence” of the target behavior, not its “extent.” This also meant that for some items the vast majority of caregivers received credit, thus producing a ceiling effect that reduced sensitivity to individual differences (but this is true for all applications of the group version of the HOME). All caregivers in T+SC destined to be Primary and Secondary Caregivers and comparable caregivers in the other BHs were administered the HOME during baseline, after the interventions were completely implemented, and annually thereafter. New caregivers were given the HOME approximately 7−10 days after starting work but before replacement training began and then approximately annually thereafter. Only enough replacement staff were administered the HOME to maintain HOME data on all Primary Caregivers and two Secondary Caregivers for each subgroup of children in T+SC; a minimum of six caregivers per group of 12−14 children were assessed in the other two BHs.
A HOME assessment consisted of 60 min of observation time, including at least 45 min in which the children were not asleep and not being fed, changed, or bathed (i.e., have “free time”) plus 10 − 15 min in which they were engaged in feeding/eating, changing, or bathing. Such observations typically were conducted at 10−12 a.m. and 4−6 p.m. when children were in the playroom. The observation time includes the interviewing of the caregiver.
Previous reliability and validity
The reliability of the HOME in the literature is typically quite good. Moreover, HOME scores are found to correlate with a variety of contemporary and future child behaviors, lending credence to its validity as a measure of environmental circumstances that relate to children's development. In particular, for example, the Responsivity subscale, a particular focus in this project, has been found in home-reared samples to correlate with motor, social, and mental competence in young children (Bradley et al., 2001) and to predict mental performance later in adolescence (Pettit, Bates, & Dodge, 1997). The HOME is also sensitive to preventive early interventions designed to improve home environments, which produce increases in HOME scores, especially Total and Learning Materials, Involvement, and Responsivity (Bakermans-Kranenburg, van IJzendoorn, & Bradley, 2005).
Training and current reliability
One member of the St. Petersburg Research Team and one psychologist coder were widely experienced in administering the HOME Inventory. These two became the “experts” who constituted the continuing standard of performance for all subsequent assessors. Assessors were psychology graduate students and were trained by these experts using the manual in group training sessions, and then experts and assessors practiced by conducting the HOME observation and scoring on caregivers in a preschool for children with and without disabilities that was not a BH. These practice sessions were followed by discussions of individual items to help assessors develop a common definition and standard for scoring. Such practice sessions continued until assessors scored 90% of the items identically to an expert on three of four consecutive assessments, which typically required about six such practice administrations.
Formal reliability was determined for the original set of two assessors and one expert, with either an expert and one assessor or an expert and both assessors simultaneously observing and independently scoring a specific caregiver (again in a preschool environment that was not a BH). The reliability sample consisted of 16 caregivers each having 3−9 children ranging in age from 3 months to 4 years with 1 or 2 children per group having a disability. This arrangement produced 34 pairs of assessments to be analyzed. There was no difference in the reliability of the two assessors with the expert versus the two assessors with each other. Across pairs of raters and groups of children, 88% of the pair-wise comparisons were within 1 point of each other on the total score (scores ranged between 21 and 38). All of the six subscales were scored within 1 point of each other (scores range from 0 to 10), and 87% were identical. On four subscales, perfect agreement was achieved in 91+% of the pair-wise comparisons (the exceptions were 68% for Responsivity, 71% for Acceptance). Therefore, the two assessors were considered reliable for both total score and the six subscales, with essentially all pair-wise ratings within 1 point.
Correlations between pairs of the expert and assessors were also calculated for each subscale and total score across the 34 pairs of assessments described above (ignoring lack of independence). Correlations were .98−1.00 for four subscales and .90−.91 for Acceptance and Responsibility; the correlation was .98 for the Total Score.
Approximately 18 months after the project started when the second BH baseline assessments were about to start, two new assessors were trained and they plus one previous expert were assessed for reliability with essentially the same procedure. Eight caregivers were observed, each rated by one expert and two assessors producing 72 paired comparisons between new and expert on the subscales and 16 paired comparisons on the total score. On the total score, 63% of the scores were within 1 point, and 75% were within 2 points, while 86% of the subscales were scored identically and 100% were within 1 point by pairs of assessors.
Correlations between pairs of assessors were again calculated with subscale rs ranging between .64 (Involvement) and .91 (Variety) and .63 for the Total HOME. These reliabilities were lower than in the original reliability assessment because the caregivers they rated for reliability purposes were much more similar in scores (i.e., restricted range); in contrast the percent agreement was quite similar to the original assessors. Therefore, the new assessors were considered essentially comparable to the expert, to the previous assessors, and to each other.
Problems, Satisfaction, and Attitudes Toward Employment
The effectiveness of the intervention rested almost entirely on the caregivers, and if implementing the interventions created more stress, they were less satisfied with their jobs, and they did not receive much support from their colleagues, it is unlikely the interventions would be implemented as intended. Conversely, it was possible that the improved interactions and relationships with children for caregivers in T+SC would result in greater job satisfaction and less stress.
Job Stress and Coping
Caregivers occasionally complained before any interventions that the job would become more stressful. Part of the training intervention was aimed at team building and work relationships among staff, and so it was hoped that the strategies caregivers adopted in coping with problems would become more constructive. Therefore, a questionnaire was included on styles of coping with problems.
Description
The Job Stress and Coping Responses or COPE Inventory (Carver, Scheier, & Weintraub, 1989) was selected. The scale consists of 31 items that represent approaches to solving problems, and the respondent is asked to indicate on a 4-point scale whether she does the specified coping strategy from not at all to most of the time. The 31 items are grouped into 12 a priori subscores of 1−4 items including active coping, planning, suppression of competing activities, restraint, seeking social support for instrumental reasons, seeking social support for emotional reasons, positive reinterpretation and growth, acceptance, turning to religion, focus on venting of emotions, denial, and behavioral disengagement. A factor analysis (Carver et al., 1989) revealed five factors: (1) action planning, a combination of active coping and planning; (2) seeking social support for emotional reasons; (3) use of alcohol and drugs; (4) positive reinterpretation and growth; and (5) acceptance.
Procedure
This scale was included in a large questionnaire battery that was administered to caregivers at baseline, after all interventions were implemented, and annually thereafter. New staff were administered the battery shortly after being hired but prior to replacement training and then approximately annually thereafter.
Previous reliability and validity
Evidence for the scale's convergent and discriminate validity and the reliability of its subscales has been presented by Carver (Carver & Scheier, 1994; Carver et al., 1989, 1993). This scale has been used in a variety of circumstances involving employees coping with organizational changes (e.g., coping strategies and distress; Begley, 1998) or personal stressful transitions (Carver & Scheier, 1994; Carver et al., 1993).
Working in the BH
Before interventions, some caregivers felt there was too much work and limited positive support from coworkers or supervisors (Muhamedrahimov, 1999). It was expected that the interventions, which emphasized teamwork and positive relationships with children and fellow staff, would improve the caregivers’ attitudes toward their jobs and reduce the number of perceived problems.
Description
A 26-item scale originally created by Dewe (1988), modified by T. Begley (personal communication, September 21, 1999), and recast and named Working in the BH was used, which assessed on a 5-point scale how often or big a problem various aspects of the job posed for the respondent. The items are classified into five a priori subscales of 2−5 items (inflexibility/rigid, work overload, difficulty working with coworkers, difficulties working with supervisors and administration, difficulties working with children with severe disabilities and diseases) plus a total problem score over all five subscales.
Procedure
This scale was included in the caregiver battery described above. Because it was related specifically to the work environment of the BH, it was not included in the intake battery for new employees but was included thereafter.
Scale of Social Support
Parts of the training emphasized team building and relationships with coworkers and supervisors, so a scale was used to assess possible changes in the extent to which caregivers perceived social support on the job and from whom.
Description
A four-item questionnaire was employed that was developed by Caplan, Cobb, French, Van Harrison, and Pinneau (1975) and used by Begley and Czajka (1993) in their study of worker response to an organizational change. The four items ask separately for the respondent's (1) boss, (2) other employees, or (3) spouse, friends, or relatives the extent each provides four different kinds of social support (putting aside their activities to help, ease of discussing issues with them, extent you can rely on them, and willingness to listen to your personal problems). Respondents replied on a 4-point scale from not at all to very much. The sum of the four items for each type of support person plus the sum over all four types were used in data analyses.
Procedure
The scale was included in the battery of questionnaires given to caregivers, but it was not given to new caregivers during their initial assessment.
Attitudes Toward Children
Before the interventions, the behavioral atmosphere of the BHs was highly caregiver-directed, controlling, conforming, and with minimum social and language interaction or relationships with children (Muhamedrahimov, 1999). The interventions were designed to change both the atmosphere and the caregiving behaviors in the BHs, which in turn might alter the caregivers’ attitudes toward children.
Taking Care of Children in the BH
It was likely (Muhamedrahimov, 1999) that some caregivers found certain aspects of caring for children distasteful, and such negative attitudes might be lessened by the interventions, which were aimed at making caregiving in the context of relationships a more rewarding task. Therefore, a scale was used that reflected the extent to which various aspects of the caregiving task bothered the caregivers, and it was expected that there might be more tolerance after the interventions.
Description
A 13-item scale (1 additional item not used) of concerns pertaining to taking care of children originally attributed to Marshall and Barnett and used by the NICHD Early Child Care Research Network requested caregivers to indicate on a 4-point scale from not at all to very strongly how much 13 aspects of child caregiving disturbs or bothers the caregiver. Concerns included cleaning up children's messes, being with young children all the time, a child crying or whining a lot, juggling conflicting tasks or duties, lack of appreciation from the children's parents, low salary, little career advancement, and lack of society's recognition for the work.
Procedure
The scale was included in the caregiver battery, but it was not part of the battery when administered to new caregivers at the beginning of their employment.
Parental Modernity Scale
Because the caregiving in the BHs before interventions was so traditional and caregiver dominated and because a major aim of the interventions was to promote social responsiveness to children's initiations, it was useful to have a measure of the extent to which caregiver attitudes might become less traditional (i.e., very caregiver-directed and not very sensitive, responsive) and perhaps more progressive (i.e., children as independent beings) after the interventions.
Description
The Parental Modernity Scale (Schaefer & Edgerton, 1985) is a questionnaire in which respondents are asked to report the extent to which they disagree or agree on a 5-point scale with 30 items reflecting a progressive versus a traditional attitude toward caring for children. The eight progressive items included “children should be allowed to disagree with their caregiver if they feel their own ideas are better, children learn best by doing things themselves rather than listening to others, children have a right to their own point of view and should be allowed to express it, it is all right for children to disagree with the caregiver, and a child's ideas should be seriously considered in making group decisions.” The 22 items reflecting a traditional orientation included “children should always obey the caregiver, children will not do the right thing unless they must, the most important thing to teach children is absolute obedience to whoever is in authority, children must be carefully trained early in life or their natural impulses will make them unmanageable, children generally do not do what they should unless someone sees to it, caregivers should discipline all the children the same, and children will be bad unless they are taught what is right.” The scale yields traditional and progressive scores, which tend not to be correlated. The original scale was modified to fit the BH context by changing the words “parent” or “teacher” to “caregiver” and changing “my child” to “children.”
Previous reliability and validity
Schaefer and Edgerton (1985) reported internal consistency and split-half reliabilities from .88 to .94, and test–retest reliability of .84 for a sample of 175 mothers including 44% African Americans randomly selected from 28 kindergarten classes in rural, suburban, and urban American schools.
Anxiety and Depression
Previous research on the caregivers in the BHs (Muhamedrahimov, 1999) indicated that many of them expressed anxiety and depression, some portion of which might be associated with their caregiver job. The interventions were intended to improve relationships among caregivers and between caregivers and children, which might reduce anxiety and depression.
Spielberger State–Trait Anxiety Inventory
This scale of state and trait anxiety reflected nonclinical concern and anxiety.
Description
The Spielberger (1983) questionnaire represents two scales of 20 items each, one reflecting the respondent's “current” feelings (State Anxiety) and the other their “usual” experiences (Trait Anxiety). Respondents rate on a 4-point scale each of the descriptors from not at all characteristic of them to extremely characteristic. The scales have been translated into Russian and were in common use by the St. Petersburg Research Team. Items on the Current Anxiety (State) Scale reflect typical manifestations of anxiety (“I feel tension, I feel relaxed, I'm nervous, I'm terribly worked up, I'm highly excited, and I'm out of sorts”), while items on the Usual Experiences (Trait) Anxiety Scale reflect more persistent traits (e.g., “I can come into tears easily, I would like to be as happy as others are, expected difficulties usually worry me a lot, I tend to avoid crucial and dangerous circumstances, all sorts of trifles distract and worry me”).
Procedure
The Spielberger scales were part of the caregiver questionnaire battery at each administration.
Previous reliability and validity
The reliability and validity of these scales have been widely documented (Spielberger, 1983); the scales have been translated into 66 languages and dialects and used in >15,000 published studies.
Zung Self-Rating Depression Scale
There was a desire to assess mild depression among the caregivers and to determine whether there was less such depression after the interventions.
Description
The Zung Self-Rating Depression Scale (SDS; Zung, 1965) consists of 20 items that reflect primarily somatic aspects of anxiety and moderate amounts of depression (e.g., “I have periods of crying or closeness to tears, I sleep poorly at night, I notice that I lost weight, I feel anxiety and cannot keep still, I am more irritated than usual, I feel that I am useful and necessary, my life is full enough”). Respondents reply on a 4-point scale with respect to the frequency from never to almost always that the characteristic describes them.
Procedure
The SDS was part of the caregiver questionnaire battery given at each administration.
Previous reliability and validity
The SDS has been demonstrated to be reliable and highly correlated with other self-report anxiety and depression measures; it is best suited for assessing anxiety and moderate depression (Carson, 1986).
Beck Depression Inventory—II
Although not frequent, severe depression had been observed in one or two caregivers (Muhamedrahimov, 1999) before this project began, and so an index of severe depression was included.
Description
The Beck Depression Inventory—II (Beck, Steer, & Brown, 1996) is a revised version of one of the most widely used assessments of serious depression in the research and clinical literatures. It consists of 21 items in which the respondent indicates one of four levels of severity of a given circumstance, for example, whether the respondent feels like a failure, feels guilty, has thoughts of suicide, excessive crying, sleep loss, concentration, fatigue, and so on.
Procedure
The Beck was included in the caregiver questionnaires battery given at each administration.
Previous reliability and validity
The Beck and its predecessors have been used in the research and clinical fields for >35 years and their psychometric properties are well known (see Beck, Steer, & Garbin, 1988; Steer, Beck, & Garrison, 1986). The internal consistency of the BDI-II was α = .91 (Beck, Steer, Ball, & Ranier, 1996) and test–retest reliability was r=.93 (Beck et al., 1996).
ASSESSING OUTCOMES IN THE CHILDREN
The comprehensive assessment of children covered three domains: (1) physical growth, (2) functional abilities, and (3) general behavioral development.
Physical Growth and Functioning
Because the BHs operate under the Ministry of Health, diagnoses, health care, and physical growth were emphasized and routinely monitored by BH health professionals.
Perinatal Information, Child History
Adverse perinatal conditions may be related to developmental progress, so information on birth circumstances were used as covariates in analyses of children's development.
Description
Most children arrive at the BHs shortly after birth, and their hospital birth records are routinely forwarded to the BH. While these records are largely in hand-written narrative form, they tend to cover the same items of information, especially birth date, demographics, Apgar ratings of the infant at birth and 10 min after birth, labor characteristics, pregnancy complications, physical size (height, weight, head circumference, chest circumference) at birth, weight at discharge, and date of discharge.
Additional history on the child is obtained at intake into the BHs. This consists of the date of arrival at the BH and date and destination at discharge from the BH. These data allowed calculations of the child's age at arrival, departure, and at each assessment plus the length of exposure to the interventions.
Chronic and Acute Disorders Checklist
BH physicians kept detailed records of diagnoses of disabilities, diseases, and infections, which were useful as moderators of development, especially in children with disabilities.
Description
BH physicians examine children regularly and record any diagnoses. The project systematized the recording process by creating checklists of the most frequent chronic and acute disorders. Medical disorders in the Russian Federation are sometimes defined or labeled differently than in the United States; hence, an attempt was made to translate Russian Federation diagnoses into their American counterparts when possible.
Procedure
Physical exams were conducted by BH physicians at intake, 3, 6, 9, 12, 18, 24, 36, and 48 months and at departure. Extra intake and departure assessments were conducted only if the child arrived or departed >1 month from a regularly assessed age during the first year of life and 2 months from a scheduled assessment thereafter. All assessments on the children followed this schedule.
Physical Growth
Institutionalized children are known to be physically smaller than their home-reared peers, and institutionalized children who are adopted immediately gain weight in their new homes (Blizzard, 1990; Johnson, 2000a, 2000b). While some institutions may provide an inferior diet, the BHs in this study do not (Kossover, 2004). Some physical growth specialists believe that the smaller size of institutionalized infants and their growth spurt after adoption is associated in part with the increased stability and responsiveness of caregivers (Blizzard, 1990; Johnson, 2000a, 2000b), and this study is one of the few quasi-experimental tests of this psychosocial short stature hypothesis.
Description and procedure
BH physicians recorded height, weight, head circumference, and chest circumference at each of the regular physical exams. Physicians measured “height” in infants as “recumbent length” by placing children who could not stand alone on their backs with head against a vertical edge, depressing the knees, and measuring the child's length. Weight was assessed on counterbalanced scales and head and chest circumference with tape measures.
Functional Abilities Index (FAI)
It was necessary to be able to evaluate the effect of the interventions on children who were developing typically as well as on those with specific types and degrees of limitations. Medical diagnoses, while useful for some purposes, were deemed insufficient in this regard, because of differences in the diagnostic systems of the Russian Federation and the United States and because some diagnoses (e.g., cerebral palsy) may include children who vary greatly in the nature and extent of their limitations. Moreover, some of the interventions, especially the structural changes that provided better equipment and encouraged its use with children with disabilities, had the potential of improving development for children having specific functional limitations. Therefore, an index of functional abilities was used to categorize children into those developing typically versus with disabilities as well as to be used as a covariate within these groups.
Description
The Abilities Index, originally developed by Simeonsson and Bailey (1991), was modified to be specific to the orphanage context by Muhamedrahimov, Palmov, and Istomina (2000) and called the Functional Abilities Index (FAI). The FAI contains nine domains plus associated subdomains, including audition; behavior and social skills; intellectual functioning; motor functioning (left and right hands, arms, legs scored separately); intentional communication; tonicity (tightness and looseness of muscle tone); integrity of physical health; eyes (left and right eye scored separately); and structural status (shape, body form, and structure). This scheme produced a total of 19 separate ratings, each of which consisted of a 6-point scale (normal/typical, suspected problems, mild problems, moderate problems, severe problems, profound/extreme problems). However, the original six levels for each domain were defined more specifically by Muhamedrahimov et al. (2000), with the approval of Rune Simeonsson and Donald Bailey, to match the procedures commonly used by the BH Special Teachers and neuropathologists who made these ratings for this project.
Procedure
The FAI ratings were made during the physical exams on the schedule described above. To conform with routine BH procedures and to utilize the expertise of BH professionals, the motor functioning and tonicity ratings were made by BH neuropathologists or a specialist in motor and physical development, while the other scales were rated by Special Teachers, who are trained in educating children with disabilities.
Current reliabilities
No reliabilities on the original Abilities Index were published, but reliabilities reported here conform to the experience of the original authors (R. J. Simeonsson, personal communication, February 28, 2001).
Reliabilities were determined separately for the ratings made by the Special Teachers and those made by the neuropathologists on a sample of 30 children from 5 to 52 months. Only 2 children were totally free of any known possible disorder; 18 had mild risks or problems that likely would not affect their functioning in a major way (e.g., growth insufficiency, hernia, heart disease); and the remaining 10 had more severe disorders, including 5 with Down syndrome, 3 with cerebral palsy, 1 with fetal alcohol syndrome, and 1 with a hearing impairment. As a result of this diversity, scoring spanned the entire range of six levels for essentially all of the 19 scales.
For the 330 paired ratings over the 11 scales rated by an expert in motor behavior and the six Special Teachers, 85% were identical, 98.8% were within 1 point, and only 1.2% differed by 2 points. Identical agreement was 90−97% for the Audition, Vision, and Structural Status Scales and 70−83% for the Social Scales, Intellectual Capability, Intentional Communication, and Integrity of Physical Health. The six raters ranged between 78% and 95% in perfect agreement with the expert.
For the 240 paired ratings over the eight scales rated by the neuropathologists and motor expert, 73% were identical, 97% were within 1 point, and only 3% differed by 2 points. Identical agreement was 78−83% for hands and arms, but 55% for legs; agreement for both tonicity scales was 73%.
The FAI variable used most frequently in this report was the total score, and the total score for the reliability sample of children was correlated for two sets of raters. This correlation was .99.
Eighteen months later, reliabilities were calculated for the FAI, which was conducted by specialists in TO. This involved four Special Teachers and a neuropathologist who assessed 20 children 3−48 months, 8 of whom had specific disabilities of a variety of sorts. The correlation across children for pairs of raters was again .99.
Classification of typically developing children versus children with disabilities
The FAI was used to identify those children who had disabilities severe enough to interfere with their growth and behavioral development from more typically developing children. A child with disabilities was defined to be one who had at least one of the nine FAI ratings equal to 5 or higher (“severe” or “profound/extreme” problem) or four or more scores >3 (“mild problem”). This approach was designed to be sensitive to specific extreme disabilities as well as more pervasive but less extreme conditions. This classification produced two groups, which shall be referred hereafter as typical and disability, which were highly divergent with minimum overlap in their Battelle Developmental Inventory total scores, and the classification had substantial stability over a span of 1 year and moderate stability thereafter (St. Petersburg–USA Orphanage Research Team, 2005).
General Behavioral Development
The Battelle Developmental Inventory (BDI; LINC Associate, 1988) was selected to measure developmental progress of children in a variety of domains, because the item pool was more practical and relevant (“authentic”) to the context of the BH and it was designed to deal with children with disabilities as well as typically developing children.
Description
The Battelle is appropriate for children birth to 95 months and provides a total score and subscale scores for Gross Motor (that includes muscular control, body coordination, and locomotion), Fine Motor (fine muscle, perceptual–motor), Adaptive Behavior (e.g., attention, eating, dressing, personal responsibility, and toileting), Cognitive (e.g., perceptual discrimination, memory, reasoning, academic skills, concepts), Communication (receptive, expressive language), and Personal–Social (interaction with adults and peers, expression of affect, self-concept, coping, social role). A few items were not appropriate for children living in the BHs, either because the behavior or equipment was not routinely available or because the questions referred to grammatical properties of English that had no appropriate analog in Russian. Of the nine inappropriate items, only two were relevant to children <48 months of age (Adaptive: “Child drinks from a tap,” 24−35 months; Expressive Communication: “Child uses articles the and a,” 36−47 months). These items were automatically scored as passed rather than artificially penalize BH children.
Previous Reliability and Validity
Test–retest reliability (4-week interval) was calculated separately within each 6−12 month segment of the total age range for each subscale. These reliabilities were almost all in the .90s and most were .95 and above (LINC, 1988). The reliabilities for the Battelle total score were, with two exceptions (72−83 months, 84−95 months), .97−.99 across the age span.
Norms
The available norms on which scaled scoring is based were from 1988 and based upon approximately 50 children for each 6-month age range. Even accepting the outdated and relatively small samples, we judged these norms and percentile rankings to be of dubious relevance to the BH population. Therefore, we used raw scores or in the case of the total score we calculated a Development Quotient (DQ) (raw score converted to mental age using the published conversion tables divided by chronological age multiplied by 100). We determined that the regression of mental age on chronological age for BH children without intervention was quite linear across the age range in this study, indicating that the DQ ratio was appropriate at all ages. Thus, the DQ provided a single score that could be used to compare children's performance across different ages, but these DQs could not be related to the mean (e.g., 100) and percentiles that are often used for IQ scores.
Procedure
The Battelle was administered by independent examiners (psychologists, graduate students in psychology) to individual children accompanied by the caregiver who knew the child best or had the best relationship with the child after the free play–separation–reunion assessment at each of the scheduled ages. Each session was conducted in a special assessment room and was videotaped in the event scoring required checking.
Current Reliabilities
Oleg Palmov of the St. Petersburg Team was trained by a certified Battelle administrator and became the “expert” and then trained two assessors on 10 children ranging in age from 28 to 55 months who were not residents of the BHs. Four of these children were typically developing and the others had various degrees of cerebral palsy, mental retardation, hyperactivity, deafness, and Down syndrome typical of the BH population. The training consisted of jointly administered assessments, discussion of administration and scoring, and solo administrations by the assessors with criticism from the expert. Training was terminated when assessors agreed with the expert on 90% of the individual items on three of four consecutive joint administrations.
Formal reliability on 19 children was assessed during baseline at T+SC. The children ranged in age from 10 months to 5 years with most 1−3 years old. Seven had clearly diagnosed disabilities (two Down syndrome, two cerebral palsy, two fetal alcohol syndrome, and one intraventricular hemorrhage). One assessor administered the BDI in the room with the child and caregiver, while the expert and other assessor scored the infant independently through a one-way window (except on five assessments in which the extra assessor was in the room with the child). This produced three independent scores for each child, except that the expert missed one and each of the two assessors missed two assessments.
The raw scores, unadjusted for the age of the child, were used in this analysis. The correlations between the expert and each of the two assessors were similar to the correlations between the two assessors for each of the five subscales and the total score. The medians of the three correlations within each domain and for the total score were all .99. Analyses of variance on the three raters, 19 subjects, and items within each scale showed for the subscales that while children and items accounted for substantial variability (partial η2), raters accounted for <.01 of the variability. Raters accounted for 5% of the variability in total score.
These rs may be inflated because of the substantial range of score values associated with age; hence, the differences in scores between pairs of three assessors were determined for each subscale separately, for the subscales combined, and for the total score over the 47 pairs of assessments that were available for these three assessors. Over all subscales combined, 93% of the pairs of scores were within 1 point of one another (ranging from 87% for the Motor subscale to 100% for the Communication subscale). For the total score, 87% of the pairs of scores were within 2 points. From this perspective, for approximately 90% of the cases, unreliability was <2% of the average subscale score and approximately 1% of the average total score.
More than 2 years after the project started, additional assessors were added and reliabilities determined. Training was on 9 children, and formal reliability was determined on a sample of 19 children ranging in age from 5 to 48 months. Again, the median pair-wise correlation across examiners was .99 for subscales and for total scores. For the subscales, 84−100% of pairs of scores were within 1 point, and for the total score 89% were within 2 points. This was comparable to the initial reliabilities reported above.
ASSESSING OUTCOMES IN CAREGIVER–CHILD INTERACTIONS
To complement the HOME Inventory of caregiver behavior on the wards and to obtain an assessment of children's emotions and relationships with their caregiver, a structured free play–separation–reunion procedure was used, and caregiver, child, and dyadic behaviors were rated on three types of instruments.
Parent–Child Early Relational Assessment (PCERA)
A major purpose of both interventions was to promote positive social–emotional relationships between children and caregivers. It was anticipated that children would display more mature play and positive affect and caregivers more positive affect and reciprocal involvement with the children. The PCERA (Clark, 1985), originally developed for assessing parent–child relationships, provided assessments of the social–emotional behavior of the child, caregiver, and the caregiver–child dyad behavior.
Description
The PCERA consists of ratings of social–emotional behaviors on 5-point scales for 29 caregiver characteristics, 28 child characteristics, and 8 dyadic characteristics. The caregiver characteristics reflect tone of voice, affect (positive, negative), mood, attitudes expressed toward the child, affective and behavioral involvement, and style (e.g., flexibility, creativity, intrusiveness, consistency). The child items include 8 ratings of mood and affect (i.e., expresses positive and negative affect, happiness, apathy, anxiousness, irritability, sobriety, and emotional stability), 15 ratings of behavioral/adaptive abilities (e.g., alertness, initiating or responding, avoidance, compliance, assertion, rhetoric competence, quality of exploratory play, attentional abilities, robustness, persistence, impulsivity, self-regulation, consolability, and focusing on caregivers’ emotional state), 2 ratings of activity level (passivity, hyperactivity), and 3 ratings of communication (visual contact, communicativeness, readability). With respect to the dyadic relationship, the PCERA provides four ratings of affective quality of interaction (anger, flat, tension, enthusiasm) and four ratings of mutuality (joint attention, reciprocity, organization and regulation of interactions, state similarity).
Procedure
The PCERA was conducted during baseline or when a child entered the BH (1−2 weeks after arrival) but no earlier than 3 months of age and at 3, 6, 9, 12, 18, 24, 36, and 48 months or at departure. Separate intake and departure assessments were conducted only if the child arrived or left between scheduled assessments. The caregiver who had the best relationship, who knew the child best, or who spent the most time with the child accompanied the child to each assessment. Note that a single caregiver might accompany several different children, and the same caregiver might not accompany a given child to assessments at different ages.
The assessment was conducted in a specially equipped room and began with the caregiver feeding the child 100 g of fruit puree and engaging in a structured task that varied in nature with the age of the child (diapering, getting the child to use a rattle, having the child try to find a block hidden under a cup, building a tower of cubes, etc.). This was followed by a 5-min free-play session in which the caregiver and child sat on a blanket on the floor and the caregiver was instructed to play with the child using a variety of toys placed in front of them.
Previous Reliability and Validity
When applied to 12-month infants and their parents and condensing the 5-point scale into a 3-point scale (1+2, 3, 4+5), Clark found pairs of raters to agree on 82−89% of the 65 items with a mean of 84%. Validity has been assessed in a variety of studies (the PCERA is estimated to be used in over 200 studies world wide), and it has shown discriminate validity between various groups of high-risk versus well-functioning parent–infant dyads (Clark, 1999).
Current Coder Training and Reliability
All sessions were videotaped, and coding of the 65 variables was made from these tapes. Rifkat Muhamedrahimov of the St. Petersburg Research Team and one coder had been trained by Pia Mothander, a Swedish expert, to administer and score the PCERA, and they were considered the “expert standard.” Assessors were instructed in group sessions and then practiced on a set of videotapes of children similar in age to those in the BHs but from other institutions. Coders practiced on such videotapes until they reached 90% agreement (within ± 1 point on the 5-point scale) on the 65 items on three out of four consecutive assessments.
Formal reliabilities were determined on a sample of 20 children ranging in age from 3 months to 5 years (14 were between 7 and 12 months of age). Except for two children with cerebral palsy and two with Down syndrome, the other 16 children were without diagnosable disabilities. Four coders and the expert viewed the videotapes of the 20 caregiver–child dyads and rated each of the 65 variables on 5-point scales. When comparing the expert versus each of the four coders across all items, 58% were coded identically and 95% were coded within 1 point of each other. Each of the four coders had similar results when compared with the expert. The four coders produced six pairs of coders, and the ratings for each pair were then compared across all variables. Of these pairs of ratings, 55% were scored identically and 95% were scored within 1 point of each other. Therefore, the four coders were regarded as reliable with each other and each with the expert.
After approximately 18 months (Year 3 of the project), six new coders were added. The new coders were compared with the expert on 22 children (11 boys, 11 girls) ranging in age from 9 to 36 months, three of whom had some type of disability (cerebral palsy, nonspecified). The reliability figures were nearly the same as for the original set of coders, with 96% of the paired ratings of the 65 variables identical or within 1 point.
The 65 individual ratings were factor analyzed to determine subscales. Reliabilities for these factors scores, which were the primary variables from the PCERA that were analyzed in this study, are presented in Chapter X.
Infant Affect Manual (IAM)
Because it was expected that children would develop better relationships with their caregivers as a result of the interventions, an assessment was needed that more directly measured the nature and extent of the relationship between children of a great variety of ages and their caregivers. So the free play episode (used also for the PCERA ratings) was followed by two separation–reunion sequences, and the IAM (Osofsky, Culp, Hann, & Carter, 1988; Osofsky, Muhamedrahimov, & Hammer, 1998) was employed to score a variety of caregiver, infant, and dyadic social–emotional responses. The IAM was selected because it could score the same socio-emotional variables for children of a great variety of ages, and it would be reasonably fair to children with disabilities, some of whom would be limited in the usual scoring of attachment categories.
Description
The IAM (once called the Dyadic Affect Scale) rates the emotional expressions on the faces and emotional behavior of the child and the caregiver. For example, eight child emotions are rated including joy, interest, excitement, surprise, distress, sadness, anger, and fear plus manipulative passivity–activity, gross motor passivity–activity, stereotypic movements, aggressive behaviors toward objects, and aggressive behavior to people. The caregiver is rated on the same basic eight emotions. Ratings (0−5 points) are made of each variable for each of the six 30-s segments of each of the 3-min episodes. Derived variables for children include the highest rating among the six 30-s ratings for positive emotional tone (joy, interest, excitement, surprise), negative emotional tone (distress, sadness, anger, fear), the number of different positive and negative emotions that are expressed, and (for children) passivity–activity (sum of manipulative and gross motor) and disruptiveness (sums of stereotypic movements, aggression to objects and people). Desired variables for caregivers are the first three above.
Procedure
The free play–separation–reunion procedure was conducted in a special assessment room in each BH and consisted of a 5-min free play (only the last 3 min were scored for the IAM) followed by 3-min episodes consisting of first separation, first reunion, second separation, and second reunion. This differs from the standard Strange Situation Procedure in the number and sequence of episodes and the videotape camera operator is the “stranger” who remains in the room videotaping during the entire assessment (i.e., the child is never alone). The assessment was conducted at each of the scheduled child assessment ages.
Current Coder Training and Reliability
No previous reliability data on the IAM were available. Coders were trained in the same way on the IAM as on the PCERA. Formal reliabilities were determined on children and their teachers in an inclusive child care and education day center, not from the BHs. A single video camera was available (rather than two that were used when assessing children from the BHs), which meant that occasionally the caregiver's expressions were not in view and had to be omitted for reliability purposes. Tapes were selected for reliability coding from a library; hence, the same children were not necessarily involved in the assessment of reliability for each episode. A total of 15 infants and their caregivers were used for the free play and reunion episodes and 11 children for the separation episodes. One child had Down syndrome and one cerebral palsy in each of these groups, which were distributed approximately evenly between 6 and 36 months of age and by gender. Coding was conducted by one expert (Muhamedrahimov), who was an author of the revised rating scale, and five coders. Pair-wise comparisons were made between each coder and the expert as well as between all pairs of coders.
There were no obvious differences in the reliabilities between the expert and the coders versus between the coders, and so these categories were combined. While there were no obvious differences between reliabilities for the free play versus the separation and reunion episodes for either the children or the caregivers, these categories were assessed separately because subsequent data analyses will be performed separately on these episodes.
Over all types of episodes, reliabilities were slightly higher for ratings of caregivers than for ratings of children. Specifically, over all kinds of episodes and rater comparisons, pairs of raters of individual emotions agreed on 82% and were within 1 point on 97% when rating the children. Only 1.0% of pairs differed by 3 or more points. When rating the caregivers, pairs of raters agreed perfectly on 89% of the occasions and were within 1 point on 99%.
With respect to the free-play session, pairs of raters produced identical ratings of children's emotions on 83% and were within 1 point on 97%. Identical agreement was somewhat lower for the interests (61%) and gross motor items (69%), but pairs of raters were within 1 point for at least 91% of all 13 items. For caregivers, pairs of coders were identical on 88% and within 1 point on 100%. Identical agreement was somewhat lower for the joy (67%) and excitement (68%) items, but raters were within 1 point on at least 96% of the occasions for all 13 items.
Reliabilities were combined across separation and reunion episodes. With respect to ratings of children, 81% of the pairs of raters agreed perfectly and 97% were within 1 point of one another. Perfect agreement was lower for the interests (59%), stereotypic movements (63%), and manipulation (69%) items, but all 13 items had at least 90% of the pairs of ratings within 1 point. For ratings of caregivers, 91% of the paired ratings were identical, and 99% were within 1 point. Perfect agreement was lower for the manipulation (67%), gross motor (71%), and interests (70%) items, but except for the interest scale (88%), raters agreed within 1 point on 98+% of the other 12 items.
The major variables to be analyzed in Chapter XI were the summary scores defined above. Correlations between pairs of coders (including the expert) were calculated across available children and separately across caregivers for each of the summary variables in free play, the two separations combined, and the two reunions combined. For the children's summary scores, the median correlations for the expert with the coders and then among coders were .96 and .92 for positive emotional tone, .95 and .92 for negative emotional tone, .79 and .72 for number of emotions, .93 and .89 for passivity–activity, and .90 and .89 for disruptiveness. For caregivers, these correlations were .95, .92; 1.00, 1.00; .83, .81; .91, .88; and 1.00, .96 for the summary scores, respectively. Thus, reliabilities were acceptable and similar across types of episodes, expert–coder versus coder–coder, and across the 13 different items and several summary scores.
When more coders were added in Year 3 of the project, reliabilities were again calculated between seven old plus new coders and the expert. The reliabilities were similar to the initial coders in that 92−96% of the ratings were identical or within 1 point for a sample of 22 children from 9 to 36 months of age including 5 children with disabilities. The median correlations between the expert and coders for the five summary scores for 5 children's measures were .79−.96 and among coders were .69−.88; for caregivers, these median rs were .83−1.00 and .45−.75, respectively. Caregiver reliabilities were lower, despite good percent agreement, because of restricted range in the reliability sample.
Attachment Codings
Although attachment theory provided a good deal of the rationale for the interventions in this study, the primary measures of social–emotional behavior and relationships were the PCERA and IAM. These assessments could be conducted on children of 3−48 months of age who were both typically developing and with disabilities and they represented a broad range of emotions and social behaviors with the caregiver. In contrast, the traditional assessment of attachment was appropriate only for a small age range (11.5−18 months of age), is potentially less appropriate for orphanage children because they are accustomed to caregivers coming and going and are often indiscriminately friendly with other people or display stereotypic behaviors that are difficult to clarify (MacLean, 2003), and we did not conduct the full strange situation procedure. Nevertheless, it was of interest to code the traditional attachment classifications and attachment behaviors even under the modified procedure and for a restricted age range of children to determine if children in the interventions displayed more organized attachment behaviors than controls and whether the traditional attachment categories, behavioral ratings, and dimensions were mutually consistent and interpretable in the traditional way.
Description
Three types of attachment variables were coded. First, children were classified according to the traditional attachment categories of A (Insecure-Avoidant), B (Securely Attached), C (Insecure-Resistant; Ainsworth et al., 1978), and D (Disorganized/Disoriented; Main & Solomon, 1990) on the basis of the entire free play/separation/reunion observation.
Second, four behavior ratings on 7-point scales were made of Proximity Seeking, Contact Maintaining, Avoidant Behavior, and Resistance as defined by Ainsworth et al. (1978) after both reunion episodes. Proximity reflected the intensity and persistence of the child's effort to gain or regain contact with or proximity to the caregivers. Contact Maintaining was the degree of activity and persistence in the child's efforts to maintain contact with the caregiver once he or she gained it. Avoidant Behavior consisted of the intensity, persistence, duration, and promptness of the child's avoidance of proximity and of interaction with the caregiver even across a distance. Resistance was the intensity, frequency, or duration of resistance the child displayed to the caregiver who came into contact with or proximity to the child or attempted to initiate interactions or engage the child in play.
Third, the attachment dimensions of (Proximity+Contact−Avoidance) and (Resistance) were calculated according to Fraley and Spieker (2003), who argued that these two dimensions largely account for traditional attachment categorization.
Procedure
Attachment variables were coded only on children who had experienced at least 4 months of the interventions or residency in NoI and who had an assessment between 11.5 and 18 months of age, because this age range is the most appropriate for assessing attachment variables with this type of procedure. If two assessments were available in this age period, the one at the oldest age was used. Only typically developing children were analyzed because some disabilities would limit children from displaying certain behaviors relevant to the classifications and ratings.
Attachment variables were separately assessed by a single coder who had been trained by Patricia Crittenden in 2002 with .9 reliability with Crittenden and was experienced in such coding. Behaviors were coded separately after each reunion episode but attachment classifications were identical and the behavior ratings were identical except for a few cases across the two reunion episodes. While not independent, this result provided partial evidence of the internal, intracoder consistency of such codings. The coder, similar to the PCERA and IAM, could not be totally blind to intervention groups.
V. EVIDENCE THAT THE INTERVENTIONS WERE IMPLEMENTED AS PLANNED
The pattern of results presented in this chapter indicates that both the training and structural change interventions were successfully implemented.
TRAINING
The training was evaluated with two parallel forms of a 40-item multiple choice test that were administered to T+SC and TO staff at the beginning and at the end of training.
Professionals
Baby Home (BH) professionals (i.e., professional staff who did not care for children on the wards) were given the tests before and after their brief training in preparation for helping to train the caregiving staff. Because there were very few professionals and both forms of the test were not yet available at pretesting for the T+SC professionals, statistical analyses on their test scores were not warranted. Nevertheless, as one might expect, mean scores for professionals were higher on the pretest (M = 24.7) than caregivers (see Figure 2), presumably because of their advanced education, and, while they gained fewer points from pre- to posttest, they still scored better on the posttest than caregivers (M = 29.7). Thus, as expected, professionals tended to score higher than caregivers consistent with their education, but apparently they still learned something from the training.
Figure 2.
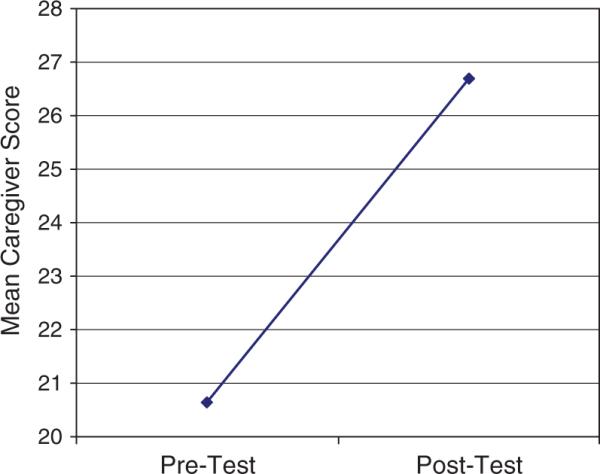
Mean pre- and posttraining test scores for caregivers in T+SC and TO BHs.
Caregivers
Caregivers (i.e., women who spent all of their working hours on the wards taking care of children) were the primary agents of the training intervention. Pre- versus posttraining test scores over the content of training are reported below: HOME scores reflecting caregivers’ ward behavior are presented in Chapter VI, and caregiver behaviors in structured sessions with individual children are described in Chapters X and XI.
Test Psychometrics
Over all caregivers who were trained and tested before and after training, there was no difference in mean scores between the two test forms (25.30 vs. 25.31), and there was no difference between the two forms when used as either a pretest (21.52 vs. 22.36) or as a posttest (28.56 vs. 28.74 for Form A vs. B, respectively). In these senses, the two forms were equivalent.
Second, by mistake, three caregivers who took Form A and three who took Form B as their pretests took the same form as their posttest, while all other caregivers took different test forms on their pre- versus posttestings. These six individuals did not show significantly greater gains from pre- to posttest (average 7.83) as those individuals whose pre- and posttests were different forms (average gain of 7.67). This result permitted using their data in the following analyses and indicated that relatively little of the pre- versus posttest gains were associated with memory of pretest information.
Pre–Post test Gains
Figure 2 presents the mean pre- and posttest scores for caregivers in the T+SC (N = 89) and the TO (N = 96) BHs combined. A Pre–Post × BH (T+SC, TO) × Pretest Form analysis of variance (ANOVA) produced a very substantial pre- versus posttest main effect, F(1, 181) = 352.69, p<.001, with a partial η2 effect size of .66. The three-factor interaction was also significant, F(1, 181) = 6.44, p = .012, but accounted for far less variance (.03). It indicated that although the test forms were equivalent in mean values, TO caregivers gained less if Form A was their posttest. Generally, however, caregivers in each BH test form group displayed significant pre–post gains.
New Caregivers
Caregivers who were hired to replace original staff members were given a short course of training when there were sufficient numbers of new employees to merit group training. The first group of 20 replacement caregivers was given the same pre- and posttests with 9 receiving Form A and 11 Form B as their pretest. Again, pretest scores for the two forms were nearly identical. Replacement caregivers showed improvement from a pretest average of 20.00, which was nearly the same as the original caregivers’ pretest mean, to a posttest mean of 28.20, slightly higher than the original caregivers, perhaps because they had a few weeks’ experience on the wards with the previously trained caregivers. These results showed that replacement caregivers learned as much from their briefer training as the original caregivers did from their more extensive training (see also Chapter VI for new caregiver HOME scores).
STRUCTURAL CHANGES
Structural changes, implemented in only one BH (i.e., T+SC), consisted of several physical, employment, and procedural changes that were intended to promote caregiver–child relationships by reducing the number and increasing the consistency of caregivers and producing a more family-like environment.
Smaller Groups, Primary Caregivers
Two structural changes—reducing group size from approximately 10−14 to 5−7 and assigning Primary Caregivers to work 5 days a week—were intended to reduce the number of caregivers children experienced per month, reduce the number of children per caregiver, and increase the number of consecutive days worked by Primary versus other caregivers. These changes were monitored by examining the official employment records of each BH that contained the number of hours and days staff worked as well as which caregivers and children were assigned to which wards on which days.
Caregivers per Child per Month
The ward assignments for caregivers and children were compared to determine how many different caregivers were assigned to each child's ward while the child was residing in that ward during each calendar month. Substitutes for caregiver illness and vacations were omitted from this count by eliminating all caregiver assignments to a group that were <8 days or that were embedded in an assignment to one other group. The number of different caregivers was then averaged over all children who resided in that BH, a 5-month moving average was calculated, and an average was computed for each 3-month quarter year to smooth out the trends.
The results are presented in Figure 3. For T+SC, a baseline period occurred, training began, and then structural changes were begun approximately March 2001 and completed by October 2001. The TO and NoI BHs were brought into the study later, and neither experienced any structural changes. All BHs were understaffed at the beginning (2000−2001), until 2003, which is why T+SC is lower than TO and NoI during baseline. However, the number of caregivers per child in T+SC dropped quickly from approximately eight to six with the advent of structural changes in 2001. No changes occurred over time for the other two BHs in which children experienced between 10 and 12 caregivers per month throughout the study or approximately twice as many as T+SC. Note that Figure 3 does not reflect additional caregivers to cover substitutions for illness, vacations, or other temporary reasons, caregiver turnovers, or graduations. For example, in T+SC, substitute caregivers were assigned to specific groups so that the same few caregivers served as substitutes each time they were needed in a specific group, whereas whoever was available was used in any group before structural changes and in the other two BHs. Thus, the number of caregivers per child per month presented in Figure 3 represents “permanently assigned” caregivers and underestimates the actual number of different caregivers children experienced in a month.
Figure 3.
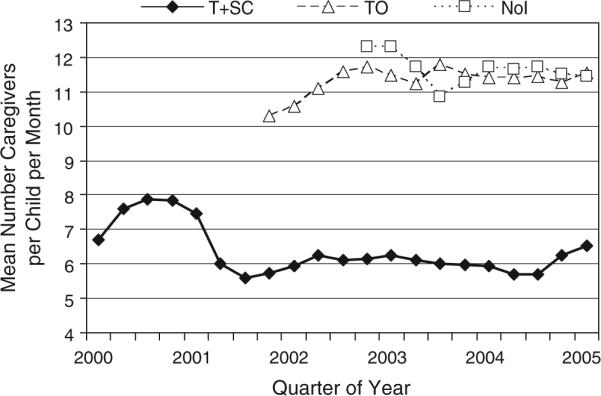
Mean number of caregivers per child per month.
Caregivers per Child Accumulated Over Residency
Figure 3 also does not reflect the structural change of eliminating “graduations” from one set of caregivers to another that typically occurred at least three times in the first 2 years of life (at approximately 9, 13, and 24 months). The cumulative number of different caregivers experienced by children over their period of residency varied with the length and the particular ages a child was in residence.
Figure 4 presents the mean number of different caregivers assigned to a child's group or subgroup for at least 8 consecutive days (again not counting embedded assignments) accumulated over various lengths of children's residency. The trends for TO and NoI are much steeper than for T+SC. The longer the TO and NoI children remained in the BHs, the more different caregivers they experienced, in part because of graduations. For example, children who resided in the T+SC BH for 19+ months experienced approximately 30+ different caregivers compared with approximately 60−100 in TO and NoI. These figures include staff turnover, graduations, and reassignments, but they do not include most short-term substitutions for illnesses and vacations (although caregivers could have 10−11 consecutive weeks off for vacation) nor do they include the variety of professionals who delivered specialized services. So even these figures underestimate the total number of adults children experienced.
Figure 4.
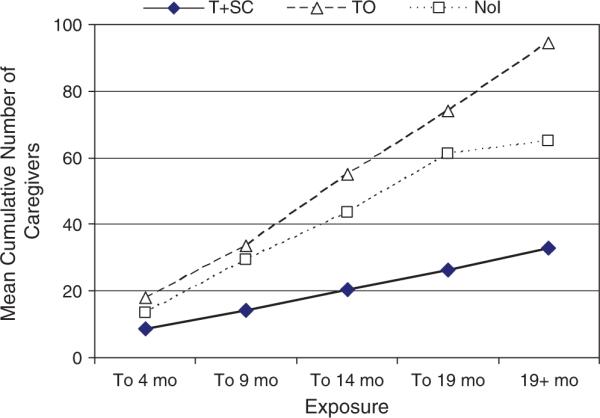
Mean cumulative number of caregivers per child (Ns range from 216 to 282 children per BH at 4 months to 8−25 at 19+ months).
Children per Caregiver
The reduction in group size should produce fewer children per caregiver, permitting the caregiver to devote more attention to individual children. Figure 5 presents the mean number of children per caregiver per month calculated as above in each of the three BHs over time. Before the initiation of structural changes, T+SC caregivers had 10−11 children to care for at a time, which was reduced to approximately 6 after the structural changes intervention was implemented. Caregivers in the other BHs cared for 12−14+ children.
Figure 5.
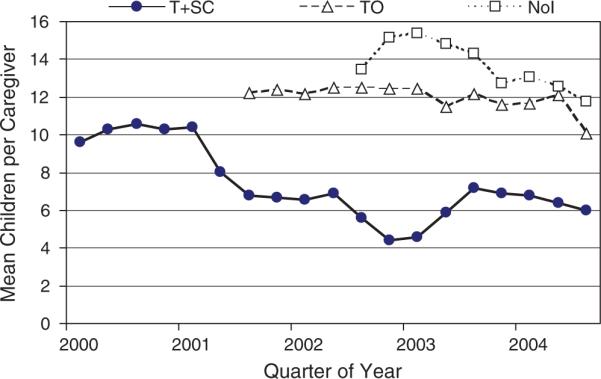
Mean number of children per caregiver per month.
Consecutive Days Worked
In T+SC, two Primary Caregivers (plus a designated substitute) and four Secondary Caregivers were assigned to each subgroup of children. Primary Caregivers were required to work 5 days per week staggered so that at least one was present every day, whereas Secondary Caregivers did not change their employment schedules, which tended to be approximately 24 hr on and 72 hr off. Figure 6 presents the mean number of consecutive days worked for Primary and Secondary Caregivers in T+SC and all caregivers in TO and NoI, calculated in the manner described above. Generally, caregivers worked approximately 1.2 days in a row, occasionally working longer than 24 hr or returning on a second day to substitute for other caregivers. After structural changes, however, Primary, but not Secondary, Caregivers in T+SC worked between 3 and 4 consecutive days in a row, reflecting the staggered schedule that insured at least one Primary Caregiver was present every day.
Figure 6.
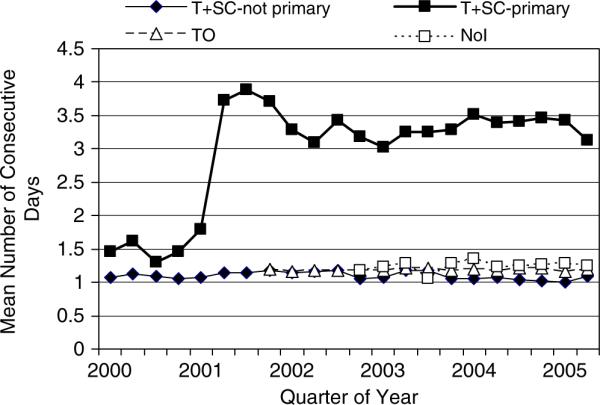
Mean number of consecutive days worked per month.
Staff Turnover
It was possible that the interventions might influence staff turnover rates, which then might be confounded with the interventions. While staff turnover would be included in the accumulated number of caregivers per child (i.e., Figure 4), turnover rates were investigated directly for Primary and Secondary Caregivers in T+SC compared with caregivers in TO and NoI.
A Caregiver Group (T+SC Primary, T+SC Secondary, TO, NoI) × Time Point (Baseline, Implementation, Postintervention 0−1, Post-intervention 1−2) ANOVA on monthly turnover rates revealed a caregiver group main effect, F(3, 156) = 3.02, p = .03, that was qualified by a near significant interaction with time point, F(9, 156) = 1.84, p = .06. Simple effects tests showed caregiver group differences only during baseline, F(3, 156) = 3.75, p = .01, and implementation, F(3, 156) = 2.58, p<.06, which consisted of significantly higher turnover rates for T+SC Secondaries during these periods.4 There were no significant pair-wise differences in turnover between caregiver groups after the interventions were implemented. Thus, while some increased turnover occurred in T+SC in anticipation of and during implementation of staffing and employment changes, no differences occurred thereafter.
Integration by Age and Disability
Another structural change was to integrate groups with children of various ages and with or without disabilities. In contrast to the above changes that could be implemented completely in a very short time, integration was accomplished by attrition and replacement of children in groups over a longer period of time.
Age Integration
The mean age on the first day of each month of children per group was calculated, the mean age of the entire BH on that date was subtracted from this value, a 5-month moving average was calculated, and then the average per group for each quarter year was computed and plotted in Figure 7 for the T+SC (top), TO (middle), and NoI BHs (bottom). Subtracting the BH average removes any overall differences between BHs in the ages of resident children and shows the extent of age variation within each group relative to the total age variation in the BH. Groups that reflect the same age distribution within groups as the entire BH will average 0.0. Figure 7 shows that groups in T+SC converge on 0.0 over the course of the intervention; that is, groups eventually contained the same average age within the group as the entire BH (i.e., were integrated by age). In contrast, group lines for TO and NoI are essentially parallel and spread over the entire range of values, reflecting very homogeneous ages within but heterogeneous ages between groups which were maintained the entire length of the study. Note that two groups were combined with other groups in T+SC shortly after the initiation of structural changes, and new groups were added periodically in the other BHs.
Figure 7.

Mean age per group minus BH average across time for the three BHs. Lines that converge on 0.0 reflect heterogeneous ages with groups (i.e., age integration).
Integration by Disability
The mean total score on the Functional Abilities Index (FAI) of children in a group was calculated per month minus the mean FAI for the entire BH in the same manner described above and plotted in Figure 8 across the term of the study. For T+SC, these values converged on 0.0 over time, indicating that the mean level of disabilities within each group reflected the level of disabilities in the entire BH (i.e., were integrated by disability status). In contrast, TO had essentially only one group of children relatively homogeneous for disabilities and all other groups homogeneous for typically developing children, whereas NoI started with two but ended with four groups of children with mild disabilities. No TO or NoI group showed any convergence toward heterogeneity (i.e., 0.0) over the course of the study.
Figure 8.

Mean Functional Abilities Index per group minus the BH average across time for the three BHs. Lines that converge on 0.0 reflect within-group heterogeneity with respect to disabilities (i.e., disability integration).
Discussion
A major task for this project was whether the interventions could be implemented successfully in an orphanage with long-standing traditional practices. The answer was yes; the training and structural changes interventions were implemented as planned. Training produced increases in knowledge of child development, disabilities, and sensitive, responsive practices in both the original and replacement caregivers. Structural changes produced fewer caregivers per children per month and substantially fewer cumulative numbers of different caregivers across a child's length of residence as a result of stopping “graduations.” Also, there were fewer children per caregiver, more consecutive days worked by Primary Caregivers, and integration of groups by age and disability in T+SC.
Although no data are presented, Family Hour was implemented in T+SC, consisting of an hour in the morning and an hour in the afternoon in which children were confined to their subgroups, visitors and specialized therapists were minimized, and caregivers were instructed to be with the children. Also, to accommodate the smaller groups, additional toys and equipment were purchased so that each subgroup was self-sufficient in this regard.
Collectively, structural changes produced fewer caregivers who were present more consistently and thus had more opportunity to develop relationships with children; integration meant that caregivers had more time with individual children (they could play with older children while infants slept and feed fewer infants while older children played by themselves), and children with disabilities were exposed to the full array of group activities. The effects of training and structural changes on the actual behavior of caregivers with children on the wards are presented in the next chapter on the HOME Inventory.
VI. CAREGIVER BEHAVIOR ON THE WARDS (HOME INVENTORY)
Caregiver behavior with the children on the wards was assessed with the HOME Inventory at several time points before and after any interventions. It was expected that training+structural changes (T+SC) would increase to a greater extent than training only (TO) and both more than the no-intervention (NoI) group.
METHOD
Participants
Analyses of each set of outcome measures were conducted on two samples. The first, labeled quasi-cross-sectional, consisted of all caregivers who were assessed at each particular time point in each Baby Home (BH). The typical cross-sectional analysis was conducted, which considered each time point to be an independent sample, even though there was partial and variable overlap in caregivers available within a BH at each of the three time points. Violation of the independence assumption has a conservative effect on significance levels and effect sizes. This analysis had the advantage of reflecting the total status of each BH at each time point because it included all the main caregivers working at each BH at each time. This sample also contained the maximum number of caregivers with available HOME data, including new caregivers if they were assessed after replacement training within the time period defined. However, it was subject to any selective staff retention or hiring, because departing and new caregivers were included at the times they were employed.
A second sample was a true longitudinal sample, which was limited to only those caregivers who were assessed at all three time points (i.e., baseline, Postintervention 0−1, Postintervention 1−2) common to all three BHs. If an assessment occurred within 6 months of a previous assessment, it was omitted in these analyses and a subsequent assessment used. This sample reflected true intraindividual change, and not selective departures or hiring. However, it was smaller and selective to the extent that caregivers who stayed through the interventions may be unusual in some respect.
Variables
Three sets of measures were analyzed: (1) The HOME Inventory total score, because it is the most general and commonly reported measure; (2) a Sociability Index composed of the HOME items that reflected caregiver–child social interaction and social behaviors to demonstrate that the social–emotional intervention specifically changed the social behavior of caregivers; and (3) the six subscales of the HOME, to examine the breadth of the training effects on several aspects of the BH caregiving environment.
Time Points
Home assessments were conducted at up to five time points defined in relation to the implementation of the interventions. Baseline assessments were made approximately during the 3 months before the start of implementing any intervention. The Postintervention—First Year (Post 0−1) assessment was conducted within 3−9 months of the completion of the intervention for T+SC and TO groups and within a year after baseline for NoI, and the Postintervention—Second Year (Post 1−2) assessment was given approximately 12 months following Post 0−1. Two other assessments, Post 2−3 and Post 3−4, were given only to T+SC approximately 12 months after the preceding assessment. T+SC intervention was implemented before TO and NoI started, and only T+SC had time for additional assessments before the project ended.
Analyses
All analyses were conducted as Intervention (T+SC, TO, NoI) × Time (Baseline, Post 0−1, Post 1−2) ANOVAs or MANOVAs. Graphs of results portray the two additional follow-up assessments (Post 2−3, Post 3−4) for T+SC for the quasi-cross-sectional design only (not enough cases were available for the longitudinal sample), but statistical analyses compared intervention groups only for the three time points that all BHs had in common.
HOME INVENTORY TOTAL SCORE
Quasi-Cross-Sectional Sample
The mean HOME total score for the quasi-cross-sectional sample of all caregivers available (Ns 46−65 per BH, median = 51.5) at each of the first three time points for each intervention group are presented at the top of Figure 9.5 The analysis revealed an intervention effect, F(2, 466) = 10.59, p<.001, and an Intervention × Time Point interaction, F(4, 466) = 25.02, p<.001, η2 = .18). Simple effects tests revealed that only T+SC showed significant time point changes as a function of its intervention, F(2, 466) = 75.87, p<.001, η2 = .25. Fs for time points within the other intervention conditions were <1.10. Moreover, the T+SC group increased significantly (p<.001) from baseline to Post 0−1, while no pairwise time point comparison was significant for either of the other intervention BHs.
Figure 9.

HOME total score for the quasi-cross-sectional (top) and the longitudinal samples (bottom) of caregivers in T+SC, TO, and NoI BHs as a function of time.
Intervention groups differed significantly from each other within each time point—baseline: F(2, 466) = 17.59, p<.001; Post 0−1: F = 24.88, p<.001; Post 1−2: F = 22.69, p<.001. More specifically, at baseline, T+SC started at a lower level than each of the other two intervention groups (ps<.001) and was higher than both other groups at both posttime points (ps<.001). TO was greater than NoI (p<.003) at Post 1−2, which result provides very partial evidence that TO produced some effect on HOME total scores, but this effect is associated mainly with a nonsignificant increase in TO and a nonsignificant decline in NoI over time.
Longitudinal Sample
The same total score results for the true longitudinal sample are presented at the bottom of Figure 9 (T+SC N = 39, TO N = 36, NoI N = 48). Generally, these longitudinal data show the same major effects as found for the larger quasi-cross-sectional sample, indicating that the changes in the general caregiving climate in the different intervention groups transpired within individual caregivers who were present for all three time points and were not simply the result of differential attrition or hiring of new caregivers between intervention groups across time.
More specifically, there was a significant intervention effect, F(2, 120) = 7.41, p<.001, and a significant Intervention × Time interaction, F(3.8, 227.2) = 18.24, p<.001, η2 = .23. As in the quasi-cross-sectional sample, change over time was significant only for T+SC, F(2, 119) = 40.68, p<.001, η2 = .41, and the change occurred only from baseline to Post 0−1 (p<.001). Although the NoI group showed only a marginally significant (p<.08) decline across time, its decline from Post 0−1 to Post 1−2 was significant (p<.037), which produced a difference between TO and NoI at Post 1−2 (p<.003).
SOCIABILITY INDEX
A major goal of the interventions was to improve the amount of social behavior in general and sensitive, responsive interaction between caregiver and children in particular. Thus, items were taken from the HOME to create a Sociability Index for this project that specifically reflected social behaviors.
Quasi-Cross-Sectional Sample
The results for the Sociability Index for the quasi-cross-sectional sample are very similar to that reported above for the total score and are presented at the top of Figure 10. There was a main effect for intervention, F(2, 466) = 9.80, p<.001, and for the interaction of Intervention × Time, F(4, 466) = 8.40, p<.001, η2 = .07. The interaction was due almost solely to the T+SC group, which was the only intervention group to show a change across time as a result of their intervention, F(2, 466) = 23.59, p<.001, η2 = .09, and this was due to its significant increase from baseline to Post 0−1 (p<.001). There were no significant three-group intervention differences at baseline (p = .09), but T+SC was significantly higher than TO and NoI (ps<.001) at both postintervention time points.
Figure 10.

The special HOME Sociability Index for the quasi-cross-sectional (top) and longitudinal (bottom) samples of caregivers in T+SC, TO, and NoI as a function of time point.
Longitudinal Sample
The Sociability results for the longitudinal sample were generally similar to those reported above for the quasi-cross-sectional sample and are presented at the bottom of Figure 10. Again, there was an intervention main effect, F(2, 120) = 4.80, p<.01, and an Intervention × Time interaction, F(4, 240) = 7.02, p<.001, η2 = .11. Only the T+SC intervention group showed a significant change over time, F(2, 119) = 17.10, p<.001, η2 = .22, which represented an increase from baseline to Post 0−1 (p<.001), and the level of Sociability stayed largely the same (even increasing slightly) thereafter. There were no differences between intervention groups at baseline (F<1.00), but intervention groups differed at both postintervention time points (ps<.001), mainly because T+SC was higher than the other two groups (ps<.03 vs. TO, ps<.01 vs. NoI).
HOME SUBSCALES
The six HOME subscales were first analyzed with a MANOVA followed by univariate ANOVAs separately for the quasi-cross-sectional and longitudinal samples. The graphs and statistical results for the longitudinal sample were nearly identical to those of the quasi-cross-sectional sample except for lower significance levels, perhaps because of smaller Ns.
MANOVA
The multivariate analysis on the six subscales for the quasi-cross-sectional sample produced an intervention main effect, F(12, 922) = 14.69, p<.001, that was qualified by the expected Intervention × Time interaction, F(24, 1609.5) = 9.19, p<.001, η2 = .11, indicating that the multivariate profiles from baseline through postintervention were different for the three intervention groups. This multivariate interaction was also significant for the longitudinal sample but with substantially more variance accounted for, F(24, 218) = 6.25, p<.001, η2 = .41. Further, this interaction was significant for all six subscales in both samples.
Specifically, both the T+SC and TO quasi-cross-sectional groups displayed significant multivariate change across time—F(12, 922) = 24.49, p<.001, η2 = .24; F = 3.90, p<001, η2 = .05, respectively—but the NoI group did not (F<1.00). The same results were observed for the longitudinal sample, but because the error was smaller in the longitudinal sample, the estimated effect sizes were much larger—.66 for the T+SC and .30 for the TO group.
Univariate Results
Figure 11 presents the change over time for each of the three intervention groups separately for each of the six HOME subscales based on the larger quasi-cross-sectional sample. Table 3 presents the corresponding statistical results for the quasi-cross-sectional sample at the left and some of the corroborating results for the longitudinal sample at the right. For both samples, Table 3 provides for each of the six subscales the F, significance level, and effect size (η2) for the Intervention × Time interaction followed by the results of the simple effects tests for time within each of the intervention groups. Additionally, for the quasi-cross-sectional sample (results were very similar for the longitudinal sample), significant pairwise comparisons between intervention groups at the two postintervention time points are listed.
Figure 11.

HOME subscale scores for the quasi-cross-sectional caregivers from T+SC, TO, and NoI BHs as a function of time point.
TABLE 3.
Statistical Results for Intervention χ Time MANOVA and ANOVAs for HOME Subscales
| Quasi-cross-sectional sample |
Longitudinal sample |
|||||||
|---|---|---|---|---|---|---|---|---|
| Intervention χ Time | Time w/in Interventiona |
Intervention χ Time | Time w/in Interventiona |
|||||
| Postintervention | Postintervention | |||||||
| HOME subscale | F(η2) | Intervention | F(η2) | 0−1 | 1−2 | Intervention | F(η2) | |
| MANOVA | 9.19*** (.11) | T+SC | 24.49*** (.24) | 6.25*** (.41) | T+SC | 17.50*** (.66) | ||
| TO | 3.90*** (.05) | TO | 3.90*** (.30) | |||||
| Univariate ANOVAs | ||||||||
| Responsivity | 7.80*** (.06) | T+SC | 21.76*** (.09) | T+SC > TO† | T+SC > TO* | 4.32** (.07) | T+SC | 9.33*** (.14) |
| T+SC > NoI† | T+SC > NoI* | |||||||
| Acceptance | 4.76*** (.04) | T+SC | 4.47** (.02) | T+SC > TO† | 3.81** (.06) | T+SC | 2.59†(.04) | |
| T+SC > NoI† | ||||||||
| Organization | 4.32** (.04) | T+SC | 19.14*** (.08) | T+SC > TO*** | T+SC > NoI*** | 3.77** (.06) | T+SC | 15.29*** (.20) |
| T+SC > NoI*** | TO > NoI*** | |||||||
| TO > NoI*** | ||||||||
| TO | 12.86*** (.05) | TO | 9.48*** (.14) | |||||
| Learning materials | 43.66*** (.27) | T+SC | 123.90*** (.35) | T+SC > TO*** | T+SC > TO*** | 38.61*** (.39) | T+SC | 82.06*** (.58) |
| T+SC > NoI** | T+SC > NoI*** | |||||||
| Involvement | 3.68** (.03) | T+SC | 8.80*** (.04) | T+SC > NoI*** | T+SC > NoI** | 2.36* (.04) | T+SC | 6.56*** (.10) |
| TO > NoI† | ||||||||
| Variety | 8.08*** (.07) | T+SC | 32.71*** (.12) | T+SC > TO** | T+SC > TO*** | 10.69*** (.15) | T+SC | 28.92*** (.33) |
| T+SC > NoI*** | T+SC > NoI*** | |||||||
| TO > NoI* | ||||||||
| TO | 9.69*** (.04) | TO | 8.57*** (.13) | |||||
Note.
Only significant increases from baseline are listed. Ns for quasi-cross-sectional and longitudinal samples for T+SC = 43−65, 39; TO = 46−52, 36; NoI = 51−54, 48.
p ≤ .10
p ≤ .05
p ≤ .01, p ≤ .001.
General Themes
Several general themes are consistently apparent. First, the intervention groups displayed different patterns of change over time for each of the six subscales, the T+SC group had significant change across time on each subscale, and the T+SC group achieved higher levels than the NoI control group for every subscale at both postintervention time points (except for the Acceptance subscale). In terms of effect size, the T+SC intervention had its greatest effect on Learning Materials (η2 = .58 in the longitudinal sample), Variety (.33), and Organization (.20), which subscales reflect more structural elements of the environment, and significant but weaker effects on the behavioral subscales of Responsivity (.14), Involvement (.10), and Acceptance (.04). TO displayed multivariate improvement, but this occurred only for the Organization and Variety subscales.
Baseline Differences
Although there were baseline differences between intervention groups, these tended to work against the main hypotheses. For example, T+SC was significantly lower than both of the other groups on Responsivity, Acceptance, Learning Materials, Involvement, and Variety, although it was higher on Organization. Thus, comparing absolute levels of the groups on the two outcome assessments represents a conservative assessment of the influence of the interventions, especially for T+SC, which had to overcome substantial baseline deficits relative to the other groups to show significantly higher scores at the two postintervention time points.
Specific Subscales
T+SC was substantially more effective at producing change in the caregivers from baseline to postintervention and higher levels of positive caregiver behavior at both intervention time points than TO. While T+SC displayed significant change for each subscale, TO had significant change across time only for Organization and Variety. T+SC produced more positive caregiver behavior than TO and NoI on most subscales at most postintervention time points (Table 3).
As with total score, essentially all of the change on subscales occurred between baseline and Post 0−1 (conducted within a year following the complete implementation of the intervention); and with the exception of a significant increase for T+SC for Organization, there were no significant changes in any group between Post 0−1 and Post 1−2 (despite apparent trends to that effect in the graphs). Thus, training produced improvement within a year of its complete implementation, and the benefits were sustained thereafter—at least over 4 years for T+SC.
New Caregivers
While caregivers employed when the training intervention was implemented in T+SC and TO received approximately 60 hr of training spread over 12−14 weeks, new caregivers who replaced departing staff were given a short course of training of approximately 25 hr spread over 2 weeks. The fact that the quasi-cross-sectional sample, which included new caregivers, had essentially the same HOME total score as the longitudinal sample that did not include new caregivers (see Figure 9), suggests that replacement caregivers scored similarly to their more extensively trained colleagues, but it was important to examine this question directly.
The HOME total scores for all originally trained caregivers employed at Post 0−1 and all employed at Post 1−2 (overlapping but not true longitudinal) were compared with similar scores for all new caregivers assessed for the first time during these time points (independent groups) in a Caregiver (Original, Replacement) × Intervention (T+SC, TO, NoI) × Time Point (PI 0−1, PI 1−2) ANOVA. There was no significant caregiver group main effect, F(1, 306) = 1.41, p<.24, or interactions with caregiver group (ps = .24−.32), and no simple effects caregiver group differences within an Intervention × Time Point cell (ps = .11−.77). Thus, replacement caregivers performed at the same level as their more extensively trained colleagues, matching the different levels of caregiving that distinguished the intervention conditions.
Discussion
These results show that training in the context of structural changes (T+SC) produced a substantial and sustained increase in HOME total score and subscales. This increase was greater for T+SC than for TO, which showed some but smaller and less consistently significant increases. While the graphs show that TO appears to be better than NoI, statistically the differences are minimal and related mostly to an unexplained decline for NoI (perhaps NoI caregivers progressively stopped displaying “good caregiving” with repeated assessments). The results were remarkably consistent across the two samples, in which the quasi-cross-sectional sample provided a total snapshot of all caregivers within each BH at each time point (larger Ns, but subject to possible selective departures and hiring that might differ between BHs) while the true longitudinal sample demonstrated that change indeed occurred within individual caregivers who were employed across the entire three time points (smaller Ns, and possibly a selected sample if caregivers who remained employed for 3 years were unusual in some respect). Effect sizes for change over time within T+SC were substantial (.66 in the longitudinal MANOVA) but much less for TO (.30).6 Replacement caregivers performed similarly to their more extensively trained colleagues within each intervention condition, also indicating that differential turnover in staff between BHs did not influence caregiving levels.
Rapid Improvement
The graphs for HOME total score and subscales show that improvements occurred to nearly their maximum extent within the first year after the T+SC intervention was completely implemented, but few improvements occurred in TO. This implies that the structural changes that supported training produced benefits within the first year. Except for the complete integration by age and disability status, structural changes were implemented approximately 6−12 months before the first postintervention HOME assessment. Further, T+SC caregivers also knew during training what the structural changes were going to be, and knowing they would have more consistent contact with fewer children may have motivated T+SC caregivers to implement their training immediately.
Persistence of T+SC Improvements
It is notable that the T+SC group remained high over all postintervention time points (see Figures 9-11), even nearly 4 years after T+SC had been completely implemented. This stands in contrast to a decline in effects that often occurs in intervention studies. Further, new caregivers who received only 2 weeks of orientation training rather than the 12 weeks of training given initially learned as much (see Chapter V) and performed at the same levels as their more extensively trained colleagues. This may indicate that only a small amount of training is actually necessary if a new caregiver comes to work in an environment in which all the other caregivers behave in the prescribed manner. However, we suspect that a more substantial and intensive training regimen may be required initially, because its primary purpose is to change the behavioral climate and standard of behavior on the wards that existed for years.
Relation to U.S. Home Care Scores
The level of the HOME Inventory total score achieved by the T+SC group in the several years after the intervention (approximately 37 in both samples) is significantly higher—using the quasi-cross-sectional mean at Post 1−2, t(440) = 3.22, p<.002−than the average score of 34.76 reported by Bradley et al. (2003) for caregivers in U.S. nonresidential home care environments. Further, the scores for T+SC include items that the residential context limits, and pretreatment HOME scores were 2.3 points lower than U.S. nonresidential home care as a result of these items (St. Petersburg–USA Orphanage Research Team, 2005). Given this adjustment, caregiving as reflected on the HOME was improved by the T+SC intervention from 21 points below to 4−5 points above average U.S. home care (which is nearly a U.S. standard deviation; Bradley et al., 2003).
Sociability Index
The results for the Sociability Index confirm that some of the increase in total score for T+SC was associated specifically with an increase in social behavior and sensitive and responsive caregiving as intended, and the T+SC level remained high for nearly 4 years following the intervention. While this may have occurred because of good supervision and staff team meetings, it may also derive from interacting with the children—the more the caregivers interacted with the children, the more the children became emotionally alive, responsive, and thus rewarding to the caregivers (Taneja et al., 2001; see also Chapters VIII–XI). Whatever the mechanism, these results hold the promise that the benefits of training can be maintained long after it is implemented if it is also accompanied by structural changes that promote interaction and relationships. Again, it is notable that the T+SC group consistently has Sociability scores at least as high (16.67) as U.S. nonresidential home care providers (Bradley et al., 2003).
Subscales
When the six subscales were analyzed as a multivariate set, the three intervention conditions were markedly differentiated. T+SC produced significant improvement on every subscale, T+SC had more positive caregiver behavior than TO and NoI on most subscales and at most time points, and the T+SC effect size for improvement over time was .66 versus .30 for TO and no significant change for NoI. These results indicate that the T+SC intervention improved every aspect of caregiver behavior represented on the HOME, not just the social behaviors.
In terms of specific subscales, changes in T+SC were largest in terms of effect size for Learning Materials (.58), Variety (.33), and Organization (.20). These subscales reflect structural elements of the environment and changes that could be easily made once rather than caregiver behaviors that must be implemented everyday with individual children that are represented on the subscales of Responsivity (.14), Involvement (.10), and Acceptance (.04), which nevertheless did show significant increases for T+SC. While TO showed general improvement, it was restricted to the Organization and Variety subscales. The smaller effects on Responsivity, Involvement, and Acceptance—major foci of the interventions—may reflect the relative insensitivity of the HOME to higher levels of caregiver performance in these areas (Bradley, 1993) and/or the lower reliabilities for these subscales (see Chapter IV).
VII. ORPHANAGE STAFF ATTITUDES, PERCEPTIONS, AND FEELINGS
The staff of the orphanages had the crucial task of implementing the training and the structural changes, which required very substantial modifications in some of their work schedules and in how they interacted with the children throughout the day, especially those in training+structural changes (T+SC).
The training urged caregivers to interact with the children in warm, caring, sensitive, and responsive ways in contrast to their aloof, adult-directed, and regimented style. Staff initially wondered if it was a good idea for children to have close relationships with caregivers when many would go to harsher and less affectionate and responsive environments in the future.
Caregivers were also concerned about increased workload and responsibilities. While structural changes reduced group size from 12−14 to 5−7, it also expanded caregivers’ responsibility to simultaneously care for children of different ages and children with and without disabilities. Some caregivers were asked to work 5 days a week instead of one 24-hr shift every 4 days. Caregivers were known from questionnaires administered some years before the interventions (Muhamedrahimov, 1999) to have minimum job satisfaction and some degree of anxiety and depression. Would caregivers be able psychologically to cope with what they perceived as new and additional burdens? One said, “How are we going to do all this when we don't have enough time as it is?” Conversely, would they actually improve in job satisfaction and perceptions of personal well-being as a result of developing better relationships with the children and seeing the children flower developmentally with their nurturance?
Caregivers of children working in other contexts are often given training and sometimes asked to implement new curricula or other structural changes, but assessments are typically limited to knowledge gained in training and perceptions of whether they changed their behaviors with children. In only a few studies are observations made of actual caregiver behavior with children. Further, rarely are assessments made of more indirect psychological characteristics, such as job satisfaction; attitudes about children and how to care for them; job stress, coping, and support; and anxiety and depression. It was possible that none of these psychological characteristics would be altered by the training and structural changes; caregivers may simply behave differently on the wards because that is what they were told to do. Conversely, it was reasonable to hypothesize that if the interventions improved caregiver–child relationships and children blossomed socially and emotionally, caregivers would change their attitudes toward caring for children, their jobs, and their feelings about themselves. This chapter explores the extent to which this happened.
METHOD
Analyses were conducted on four samples of staff each covering three time points.
Participants
There were two types of Baby Home (BH) staff (see Chapter II; St. Petersburg–USA Orphanage Research Team, 2005).
Professionals
Professionals consisted of approximately 18−28 individuals per BH, mostly women, who had specialized education or training, were administrators or delivered specific services to the children, and did not spend all day on the wards with the children. Some of these professionals conducted the training of caregivers as part of the train-the-trainer approach, and the Special Teachers had direct supervisory responsibilities over the caregivers. Therefore, the professionals mediated the implementation of the interventions and set a continuing tone and standard for caregiver behavior and attitudes.
Caregivers
Caregivers consisted of approximately 60−90 women per BH who provided direct care to children on the wards essentially all of their working hours. Caregivers directly implemented the interventions; hence, they were hypothesized to change more than the professionals.
Samples
Analyses were conducted on two samples of each type of staff.
Quasi-Cross-Sectional Sample
A quasi-cross-sectional sample was created similar to that described in Chapter VI. It consisted of all professionals and separately all caregivers who were employed in a BH at any one point in time, which would provide a snapshot of each entire BH at each time point. These groups were the major mediators of the interventions for children. The partially overlapping samples across time points were again ignored in the analyses.
Longitudinal Sample
True longitudinal samples of those professionals and caregivers who were employed at all three time points had smaller Ns but could verify that changes occurred over time within individuals and not solely as a function of selective attrition and hiring over the three time points (see Chapter VI).
Time Points
Staff in all three BHs were given a battery of questionnaires on three occasions timed according to the implementation of the interventions in each specific BH. While these time points have the same names and definitions as those reported above for the HOME, assessments were made at different times within the designated intervals.
Baseline (BL) assessments were given to all professionals and caregivers employed during the 3 months before any training or structural changes were implemented. Postintervention—First Year (PI-1) assessments were given to all staff within a year after the intervention was completely implemented in T+SC and training only (TO) and after BL assessments in NoI. Postintervention—Second Year (PI-2) assessments were given within the second year following the implementation of any intervention in T+SC and TO.
Note that the three time points were approximately comparable across BHs with respect to time from the BL assessment, but because BHs were brought into the study in sequence, the three time points represent different points in calendar time from one BH to the next. The interventions were implemented between BL and PI-1, but T+SC took longer to implement than TO, which meant that the PI-1 and PI-2 assessments were made a shorter time after the completion of the T+SC intervention than the TO intervention.
Analyses
Missing or Extreme Data
Scores on scales that contained more than just a few items and that were more than 3 SDs from the mean of the relevant staff type at that time point were considered “extreme.” In addition, staff occasionally did not answer a given item. The mean of the relevant staff type for the specific intervention condition at that time point was imputed in these instances to maximize the N and to preserve the quasi-cross-sectional picture of each intervention condition but at the expense of possibly increasing longitudinal variability within caregivers. Not more than 2−3% of participants and far less than 1% of the items were affected in these ways.7
Analytic Strategy
Intervention BH (T+SC, TO, NoI) × Time (BL, PI-1, PI-2) multivariate (MANOVA) and univariate analyses of variance (ANOVA) were conducted separately for the quasi-cross-sectional and longitudinal samples and separately for professionals and caregivers. Staff type (i.e., professionals and caregivers) was not included as an independent factor in the same analyses because of the substantially different backgrounds of these two groups and because of the large difference in N. Further, the professionals were intervention intermediaries; the caregivers were the primary implementers of the interventions and the major focus of these analyses. Generally, analyses were conducted on each questionnaire separately, using the a priori subscales of the questionnaire as the dependent variables in MANOVAs. An exception to this was the two anxiety and two depression scales that were analyzed as a single set of four dependent variables.
Primary interpretative emphasis was placed on the quasi-cross-sectional results, because this sample provided the most complete and representative picture of each intervention condition (i.e., BH) at each time point with the largest N. The longitudinal analyses were considered complements to the main analyses. Specifically, they might replicate the quasi-cross-sectional results and thus confirm that changes occurred within individuals and not because of selective attrition and hiring. Note that failure to replicate significance levels could be associated with the smaller Ns in the longitudinal (and professional) samples. Conversely, changes could occur in the longitudinal but not in the quasi-cross-sectional sample, which would suggest that longer exposure to the intervention is necessary to produce such changes.
Complicating Circumstances
The main statistical test of interest was the Intervention × Time interaction. Ideally, the T+SC staff should show the greatest amount of change over time, the TO staff should display some but less change, and the NoI staff should not change at all. However, as indicated in Chapter III, the original director of the TO BH, widely respected among BH directors in St. Petersburg because of her long tenure and high professional regard, “resigned” during the PI-1 assessment period, which event was accompanied by her illness, political pressure, and unsubstantiated accusations. Rivalry and conflict between other administrators within the BH occurred before and after her departure. The director of the NoI BH died unexpectedly just before the PI-2 assessments, and a period of uncertainty ensued until caregivers adjusted and a new director was named.
The effect of these events seemed clearly apparent on only one measure; nevertheless, they at least cloud the interpretation of the Intervention × Time interaction. Therefore, the analytic focus will be on the specific hypothesized changes that would be reflected in the Intervention (BH) × Time multivariate and univariate interactions. For example, change across time within each intervention condition was examined regardless of whether the overall interaction was significant, primary to determine if meaningful change occurred in T+SC even if such change could not be compared unequivocally with the other intervention conditions. Main effects for intervention conditions will not be presented because they can reflect initial BL differences.
RESULTS
Questionnaires were divided into two categories: those that reflected job-related attitudes and those that represented more personal psychological characteristics.
Job-Related Attitudes
Job-related questionnaires pertained to traditional versus progressive attitudes toward caring for children, attitudes toward taking care of children and working in the orphanage, job stress, and perceived social support at work.
Traditional Versus Progressive Caregiving Attitudes
Schaefer and Edgerton's (1985) Parental Modernity Scale produces two subscores, a 22-item traditional (e.g., adult-directed instruction and control) and an 8-item progressive (e.g., child self-motivation, independence, and expression; see Chapter IV for details), that are uncorrelated (Schaefer & Edgerton, 1985). Because T+SC emphasized sensitive, responsive adult interactions with children, it was hypothesized that T+SC staff, especially caregivers, would become less traditional and perhaps more progressive after the intervention, the TO staff might show similar but less marked changes, and the NoI staff would not change at all.
Professionals
Professionals in the quasi-cross-sectional sample did not display a significant Intervention × Time interaction in the multivariate (traditional, progressive scores) analysis, Wilks’ λ = .975, F(8, 514) = 0.821, p = .58, and neither univariate interaction was significant—traditional: F<1; progressive: F(4, 258) = 1.40, p = .23. Similarly, none of the interaction results for the longitudinal sample were significant—multivariate: F = 1.09; progressive: F(4, 138) = 1.62, p = .17; traditional F = 1.01.
Caregivers
Caregivers in the quasi-cross-sectional sample displayed no significant multivariate interaction, Wilks's λ = .99, F(8, 1282)<1, and no univariate interactions (Fs<1.05).
Strictly speaking, the results for the longitudinal sample of caregivers were similar. However, there was partial support among T+SC caregivers who were present over the entire time period for the hypothesis that they should reduce their traditional attitudes toward caring for children (see Figure 12). Specifically, the multivariate interaction was not significant by Wilks's λ = .930, F(8, 322) = 1.49, p = .16, but it did approach significance for Roy's largest root (.058), F(4, 162) = 2.36, p = .06. While no interaction was observed for the progressive scale (F<1), the interaction for the traditional scale approached significance, F(4, 101) = 2.05, p = .09. Moreover, T+SC declined on the traditional scale significantly over time consistent with expectations, F(2, 328) = 4.46, p = .01, whereas the other conditions did not change (F<1); and T+SC was significantly lower than the other conditions at PI-1 (p = .03; the difference at PI-2 was p = .10).
Figure 12.
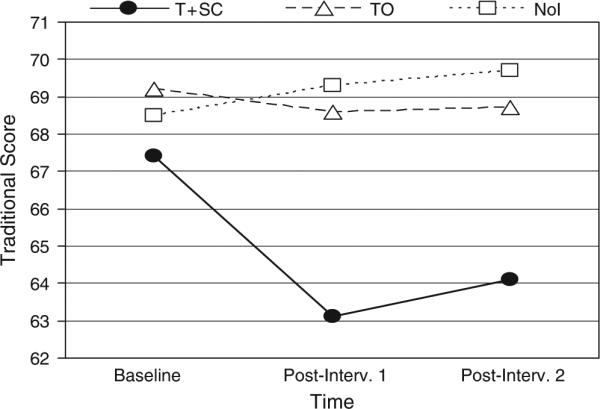
Mean traditional score from the Parental Modernity Scale for the longitudinal sample of caregivers in T+SC (N = 43), TO (N = 60), and NoI (N = 64) as a function of time.
Taking Care of Young Children in the BH
This instrument asked staff to rate on a 4-point scale the extent to which 13 specific aspects of working in the orphanage disturbed them (e.g., children's crying, cleaning up messes, exposure to illness, low salary, society's lack of recognition). The sum of the 13 items was analyzed. While the interventions did not directly address any aspect of child care reflected on this scale, it was possible that the interventions could improve staff outlook and morale, and staff might perceive these aspects as less bothersome than otherwise.
Professionals
For the quasi-cross-sectional sample, there was no significant Intervention × Time interaction, F(4, 259) = 1.76, p = .14, but T+SC professionals displayed a significant increase over time, F(2, 65) = 3.26, p = .045. The longitudinal sample revealed this tendency more strongly, with a significant Intervention × Time interaction, F(4, 138) = 3.33, p = .01, and a significant increase over time for the T+SC professionals, F(2, 138) = 9.55, p<.001. The other two intervention conditions did not show significant changes over time, and T+SC was never significantly different from the other intervention conditions at any time point in either sample. Although one would not necessarily expect professionals to be concerned about caregiving issues because they did not work on the wards, T+SC professionals perhaps became more sensitized, especially in their role as supervisors of staff (which we believe they took more conscientiously than TO professionals).
Caregivers
There were no significant Intervention × Time interactions (Fs<1) and no significant change over time for T+SC (Fs<l) for either the quasi-cross-sectional or longitudinal samples.
Working in the BH
This questionnaire was similar to the previous one in asking staff to rate on a 4-point scale the extent to which various aspects of working in the orphanage represented a problem for them. The items were classified (Dewe, 1988) and modified by T.M. Begley (personal communication, September 21, 1999) into five a priori subscales of two to five items each (inflexibility/rigid, work overload, difficulty working with coworkers, difficulties working with supervisors and administration, difficulties working with children with severe disabilities and diseases) plus a total problem score that was the sum of all five subscales. These scales reflected to some extent how smoothly and comfortably staff adjusted to the interventions.
Professionals
For the quasi-cross-sectional sample of professionals, there was no significant multivariate interaction, Wilks's λ = .893, F(20, 847) = 1.47, p = .08, and no univariate interaction for total problems (F<1) or for any subscale. For the longitudinal sample, however, there was a significant multivariate Intervention × Time interaction, Wilks's λ = .569, F(20, 120) = 1.97, p = .01, and a significant univariate interaction for the subscale of work overload, F(4, 126) = 4.58, p = .002. This effect was principally produced by the professionals in T+SC, who showed a very substantial increase in work overload immediately after the interventions were implemented (PI-1) followed by a decrease to low perceptions of work overload at PI-2. This effect was consistent with their increased responsibility to train and supervise caregivers at the beginning of the project.
Caregivers
For the quasi-cross-sectional sample, there was a significant multivariate interaction, Wilks's λ = .949, F(20, 2117) = 1.69, p = .03. Although no one of the five subscales or the total problems score revealed a significant univariate interaction, the significant multivariate interaction appeared to be produced by the three subscales pictured in Figure 13, which had univariate interaction probabilities of .18, .08, and .12 but which showed other significant differences consistent with expectations. Specifically, caregivers in T+SC showed a near significant decline in inflexibility/rigidity, F(2, 191) = 2.84, p = .06, a significant decline in work overload, F(2, 191) = 4.86, p = .009, and a decline in difficulties working with children with severe disabilities and diseases in which T+SC was significantly lower than the other groups at PI-1 (p<.02) and PI-2 (p<.008).
Figure 13.

Changes over time for the quasi-cross-sectional sample of caregivers in T+SC (N = 61−69), TO (N = 71−83), and NoI (N = 72−77) for the inflexibility/rigidity, work overload, and difficulties with disabilities subscales of the working in the BH questionnaire.
These same effects as pictured in Figure 13 were observed in the longitudinal sample of caregivers with slightly greater statistical significance despite the lower N in these analyses. The multivariate interaction, Wilks's λ = .727, F(20, 310) = 2.68, p<.001, and the univariate interactions for inflexibility, F(4, 328) = 2.37, p = .052, work overload, F(4, 328) = 3.37, p<.01, and difficulties working with children with severe disabilities and disease, F(4, 328) = 3.51, p = .008, were all significant. T+SC caregivers displayed significant declines in inflexibility (p = .03) and work overload (p = .002) and a near significant decline in difficulties with disabilities (p = .09). No other intervention condition showed a significant decline.
Job Stress and Coping
This scale consisted of 31 items reflecting different specific actions one might take to cope with a problem. Staff responded on a 4-point scale from not doing the action at all to doing it most of the time, and participants rated each item with respect to what they usually do. The scale produces 12 subscales composed of one to four items each that reflect different coping strategies.
Professionals
For the quasi-cross-sectional sample, there was no significant multivariate Intervention × Time interaction (Fs<1) and no univariate interactions (11 of 12 Fs<1.07). Similarly, for the longitudinal sample, the multivariate interaction was not significant, Wilks's λ = .335, F(52, 88) = 1.23, p = .19, but three univariate interactions were significant. Specifically, professionals in T+SC showed an increase in planning over time whereas the other intervention groups did not—interaction: F(4, 138) = 3.41, p = .01; T+SC increase over time: F(2, 138) = 4.31, p = .015; T+SC higher at PI-2 than the other groups: F(2, 69) = 4.00, p = .02. Professionals in T+SC increased in Acceptance, whereas the other intervention groups did not—interaction: F(4, 138) = 2.68, p = .03; T+SC increase over time: F(2, 138) = 6.83, p = .001. There was also a significant interaction for behavioral disengagement, but the pattern was not interpretable.
Caregivers
The multivariate interaction was not significant (F<1) and there were no significant univariate interactions (11 of 13 Fs<1) for the quasi-cross-sectional sample. Similarly, the longitudinal multivariate Intervention × Time interaction was not significant, Wilks's λ = .834, F(52, 1226) = 1.13, p = .25; only one univariate interaction was significant, but this simply reflected an extremely high level at baseline for the TO group on venting emotions.
Social Support at Work
Staffs were asked to rate on a 4-point scale from not at all to very much the extent to which they received four kinds of social support separately from their boss; other employees; or their spouse, friends, or relatives. Scores were produced for each of the three potential sources of social support plus a Total Social Support Score that was the average of the three sources.
Professionals
There was no significant Intervention × Time interaction for any of the four scores for the quasi-cross-sectional (all Fs<1) or the longitudinal sample (all Fs<1).
Caregivers
Similarly, there were no significant interactions for either the quasi-cross-sectional (3 of 4 Fs<1) or the longitudinal sample (3 of 4 Fs<1).
Personal Psychological Characteristics
Several questionnaires probed more personal psychological characteristics of staff.
Anxiety and Depression
Earlier reports (Muhamedrahimov, 1999) indicated that many caregivers were depressed and did not find their jobs very fulfilling. It was hypothesized that those in T+SC would develop more social–emotional relationships with children that would become a source of satisfaction and possibly reduce the anxiety or depression in staff.
Four questionnaires probed these feelings, including Spielberger's assessments of state and trait anxiety, Zung's assessment of mild depression, and Beck's Inventory of more severe depression. Multivariate analyses assessed the Intervention × Time interaction using all four scores simultaneously followed by univariate tests of that interaction. In particular, T+SC was expected to show declines over time.
The departure of the director in TO accompanied by internal and external political activities plus the sudden death of the director in the NoI BH produced uncertainty in professionals and caregivers that seemed to become manifest most obviously in these measures of anxiety and depression. As a result, significant interactions reflected to some extent unusually high anxiety and especially depression scores in professionals and caregivers in TO and NoI at PI-1 and PI-2. As a result, the only uncompromised hypothesis was the expectation that anxiety and depression would decline in T+SC, especially by PI-2, allowing for the possibility of increases shortly after the intervention was implemented until participants were comfortable with it. Thus, the primary result of interest was significant changes in T+SC, regardless of whether the Intervention × Time interaction was significant.
Professionals
For the quasi-cross-sectional sample, the Intervention × Time multivariate interaction was significant, Wilks's λ = .889, F(16, 783) = 1.92, p = .02. This largely reflected the interaction for the Beck's Depression Inventory, which consisted of an extremely high score at PI-2 for TO, F(4, 259) = 2.29, p = .06. Professionals in T+SC did not show significant changes over time for any of the four anxiety and depression measures.
The results were the same for the longitudinal sample with a significant multivariate interaction, Wilks's λ = .588, F(16, 124) = 2.36, p = .004, and a significant interaction for the Beck's, F(4, 78) = 3.37, p = .015, which reflected a similar substantial increase for the TO professionals at PI-2. Otherwise, T+SC showed no changes in any measure over the three time points.
Caregivers
For the quasi-cross-sectional sample of caregivers, the general statistics were the same as for the professionals, mainly a significant multivariate interaction, Wilks's λ = .905, F(16, 1953) = 4.06, p<.001, and a significant univariate interaction for the Beck's, F(4, 642) = 9.01, p = <.001, reflecting a substantial increase in depression scores for the TO caregivers at PI-2. However, consistent with the specific hypothesis of a decline in anxiety and depression among T+SC caregivers, all four measures showed significant or near significant declines for T+SC—current (state) anxiety: F(2, 191) = 2.51, p = .08; usual (trait) anxiety: F = 7.32, p<.001; Zung: F = 2.90, p = .057; Beck's: F = 4.79, p = .009. In contrast, except for TO on the Beck's, the other two intervention conditions did not show significant changes across time (all Fs<1 for the NoI). These results are presented in Figure 14.
Figure 14.

Changes over time for the quasi-cross-sectional samples of caregivers in T+SC (N = 61−69), TO (N = 71−83), and NoI (N = 72−77) for current anxiety, usual anxiety, Zung, and Beck's scales.
For the longitudinal sample of caregivers, the pattern of results was the same as pictured in Figure 14 but the statistical results were not quite as clear, especially for the tests of changes over time within each anxiety and depression measure. Specifically, the multivariate interaction was significant, Wilks's λ = .643, F(16, 314) = 4.85, p<.001, accompanied by a significant univariate interaction for the Beck's, F(4, 306) = 14.98, p<.001, again reflecting a sharp increase in Beck's scores at PI-2 for the TO condition. The T+SC intervention produced significant declines in only two of the four measures—current (state) anxiety: p = .33; usual (trait) anxiety: F(2, 328) = 4.00, p = .02; Zung depression: F<1; Beck depression: F = 4.04, p = .02. Although the NoI did not show a significant change in any measure over time, the TO BH declined significantly in current anxiety, F(2, 328) = 8.00, p<.001, and usual anxiety, F(2, 328) = 6.93, p<.001, in contrast to their substantial rise in Beck scores.
DISCUSSION
Generally, as expected, attitudes and perceptions were more likely to change for caregivers than for professionals. Professionals had more education and broader experience; hence, the interventions did not influence them as much. Also, caregivers were more directly and continuously involved and thus were more likely to develop relationships with the children and be personally gratified by their improvement.
Most major results for caregivers occurred in both the quasi-cross-sectional and the longitudinal samples, and if anything the results were stronger in the longitudinal sample, which had the advantage of revealing intraindividual changes but the disadvantage of having a substantially smaller N than the quasi-cross-sectional sample. This general observation lends credence to the interpretation that changes in caregiver attitudes and perceptions were not primarily the result of selective hiring or attrition but rather derived from caregivers’ continuing interaction with the children over a period of at least 2+ years.
While significance levels were sometimes marginal and not totally consistent, the direction of the results indicated that caregivers tended to adjust well to the T+SC intervention, especially with respect to reductions in their perceptions of job stress, anxiety, mild depression, inflexibility, workload, and difficulties with children with disabilities. T+SC caregivers also became slightly less traditional in their attitudes toward children, consistent with the intent of the interventions. In contrast, there were few pervasive or consistent changes in perceptions and attitudes toward aspects of the caregiving job.
Caregiver Work Adjustments
More specifically, caregivers in the T+SC intervention originally worried about how they could manage implementing the intervention, especially how they would cope with both typically developing and children with disabilities as well as children of different ages all mixed within their groups. Nevertheless, after the T+SC intervention was implemented they declined in their perceptions of inflexibility, work overload, and difficulties working with children with disabilities. These results confirm that the major elements of structural changes can be accomplished by caregivers, not only without increasing, but actually reducing, their perceptions of these as problems.
Such changes happened only among T+SC caregivers. We believe structural changes, principally consisting of smaller groups and age and disability integration, contributed to the improvement of caregiver perceptions in T+SC. Obviously, integration required greater flexibility and less rigidity to implement at all, and the fact that it seemed to work (see Chapters VIII–XI) translated into caregivers’ perceptions of greater flexibility. While structural changes eliminated long periods of time in which caregivers had nothing to do while their children slept, caregivers had fewer children (approximately 6 vs. 12), could feed the 2−3 infants while the older children played (rather than feeding 12+ children within an hour or so), and dressed only 2−3 older children for outdoors (perhaps while the infants slept). Thus, the total work atmosphere became less pressured and overloaded, rather than more so as they originally feared. Similarly, Taneja et al. (2001) also found caregivers had more fun after 90-min play periods were introduced. They were reportedly motivated by the developmental improvement they could see in the children, and their work load decreased because the children were more independent.
Also, caregivers were taught how to handle children with disabilities and how to use specialized equipment to help such children be more socially integrated within the group, apparently reducing caregivers’ concern and showing caregivers how to relate to children with disabilities. The result was that children with disabilities were perceived as less of a concern, even though all of the caregivers in T+SC had children with disabilities in their groups, whereas only a small percentage of caregivers in the other conditions had such children in their direct care. Actually caring for children with disabilities, after appropriate training, reduced concern relative to caregivers who had neither training nor direct experience caring for such children.
Anxiety and Depression
Caregivers in T+SC declined to a significant or near significant extent on each of the four anxiety and depression measures. While one might have expected an increase in anxiety and depression immediately after the implementation of the double intervention, this did not happen on any measure for T+SC. It is possible that this decline reflects greater satisfaction and comfort with having interactive social–emotional relationships with children and the pleasure and fulfillment that those relationships brought to the caregivers. This interpretation is supported in part by the lack of such declines among the professionals, who did not spend all day with the children and did not develop the relationships with them that the caregivers did.
The death of the director of the NoI BH was not obviously related to changes in caregiver anxiety and depression (no change over time was significant for NoI for any of the four variables within any of the four samples of staff). However, both TO professionals and caregivers showed a marked increase in Beck's depression but not on the other three anxiety/depression measures after their director was forced out politically. This director was very respected and popular with most of her staff, who perceived her ouster as unjust. Also, some degree of in-fighting for power took place among a few professionals, and together these circumstances may have produced the sharp rise in Beck's depression scores for both types of staff. The rise was not associated with only one or two extreme scores.
The death and departure of directors in TO and NoI approximately 1 year after interventions were completed represented potential confounds to the interventions, but the total pattern of results does not support this interpretation. First, the only empirically obvious possible effect was the spike in Becks depression scores for TO at PI-2 reported in this chapter, but this spike was not present for current (state) and usual (trait) anxiety or the Zung depression scale. Second, a similar sharp inflection did not occur for TO in other caregiver behaviors that were plotted over time, including other attitudes on questionnaires, behavior with children in dyads (except TO caregivers showed less negative emotions; see Chapter X), and HOME scale behavior on the wards. Third, these departures would not have influenced T+SC, which displayed substantial improvements in caregiver behaviors and children's development, often ultimately reaching levels that exceeded the initial levels of TO and NoI participants assessed before these unanticipated events. Thus, the spike in Beck's depression appears to be an isolated deviant value that was not accompanied by corresponding deflections in a variety of other measures of caregiver attitudes and behaviors and children's development; the death and departure of two directors were not empirically supported as influential confounds and they do not compromise the gains made by T+SC caregivers and children.
Traditional Versus Progressive Child Caring Attitudes
Generally, the interventions had no effects on professional and limited effects on caregiver traditional/progressive attitudes toward adult–child relations. However, as hypothesized, there was some suggestion that caregivers who were exposed for 2+ years to the double T+SC intervention became less traditional (but not more progressive) in attitude, this decline was not shared by either the TO or the NoI groups, and T+SC caregivers declined in traditional attitudes to significantly lower levels than the other two groups. It is possible that those caregivers who were present before the T+SC intervention began and could compare the behavior of the children before and after the T+SC intervention became less traditional as a result of seeing the improvement in the children. The TO condition did not produce as much change in the children (see Chapter VIII–XI), and so TO as well as NoI caregivers did not change.
The fact that caregiver attitudes improved on the traditional but not on the progressive scales is perhaps not surprising. First, Schaefer and Edgerton (1985) found the two scales to be uncorrelated for a sample of parents. Further, the traditional scale emphasized teacher-directed interactions with children, which were very commonplace in BHs, and the intervention focusedonencouraging more responsiveness to child-directed initiatives. The progressive scale emphasized the children as independent beings with their own ideas that should be taken seriously by caregivers. This was emphasized less in the interventions, and many of the items on this scale were aimed primarily at caregivers of older children than the infants and toddlers in the BHs.
VIII. INTERVENTION EFFECTS ON PHYSICAL GROWTH
The “psychosocial short stature hypothesis” (Blizzard, 1990; Johnson, 2000a, 2000b) states that children exposed to social–emotional neglect display growth deficiencies called “psychosocial dwarfism” (Skuse et al., 1996). Evidence for the causal role of social–emotional neglect in this condition is mostly circumstantial. Children living in orphanages are substantially delayed in physical growth (St. Petersburg–USA Orphanage Research Team, 2005), and children adopted into British and Canadian homes in the 1990s from globally deficient Romanian orphanages were comparably small in stature at adoption (e.g., Benoit et al., 1996; Rutter & the English and Romanian Adoptees Study Team, 1998).
Children also continue to lose ground while in the socially emotionally deficient orphanage environment (Alpers et al., 1997; Ames et al., 1997; Johnson et al., 1992; Rutter & the English and Romanian Adoptees Study Team, 1998; van Ijzendoorn, Bakersmans-Kranenburg, & Juffer, 2007), and such growth retardation is not likely due to undernutrition. While nutrition may be deficient in some orphanages, institutionalized children are widely known to be hyperphagic (Johnson, 2000a, 2000b; Skuse et al., 1996), and they tend to be higher in weight/height ratio than one would expect (Johnson, 2000a, 2000b). An analysis of the food provided in the current orphanages, in particular, revealed no major deficiencies (Kossover, 2004).
Finally, a small experimental intervention study in which orphanage infants within the first 2 weeks of life were given 15 min of auditory (female voice), tactile (massage), and visual (eye-to-eye contact) stimulation in a scheduled and noncontingent fashion twice a day, 5 days/week for 4 weeks were longer, heavier, and had larger head circumferences than control infants immediately as well as 6 months after the intervention (Kim et al., 2003).
Once children were adopted into British and Canadian homes, children's growth increased to essentially typical levels (Carlson & Earls, 1997; Chugani et al., 2001; Johnson et al., 1992; Rutter & the English and Romanian Adoptees Study Team, 1998), and adopted children show a reversal of their growth hormone deficiency (Alanese et al., 1994; Skuse et al., 1996). Institutionalized children also increase in height and weight when moved to foster care (Nelson, 2006).
The current study represents one of the largest and most comprehensive quasi-experimental studies showing that improvements in the social–emotional-relationship environment, apart from nutritional and other factors, are associated with increases in physical stature.
PRELIMINARY ANALYSES AND STATISTICAL STRATEGY
Several unusual procedures were used to deal with the fact that physical growth increases markedly with age even without interventions; children enter and leave the orphanages at various ages and thus are exposed to the intervention for varying lengths of time and at different ages; selective attrition occurs because healthier and more appealing children tend to be adopted or reunited with their biological parents; children enter the Baby Homes (BHs) at different levels of physical development and the BHs may differ in mean levels before interventions, and Russian and certainly U.S. growth standards are of dubious relevance to orphanage children.8
Age Invariant “Treatment Effect”
An age invariant estimation of the treatment effect was needed so that the children of different ages and different exposures to the treatment could be compared on a common scale that took into consideration the complications listed above.
General Strategy in Creating an Index of “Treatment Effect”
The preintervention baseline data from all three BHs were regressed on age to create an equation that would predict the no-intervention outcome at any age birth to 4 years. The child's deviation from this standard on their intake assessment plus the no-intervention prediction equation were used to estimate each child's no-intervention outcome at the age of the child's outcome (postintervention) assessments. The difference between the child's actual measured outcome and this predicted no-intervention outcome score represented the child's “treatment effect.” This “value-added” strategy, suggested by Byrk and Weisberg (1976) and McCall, Ryan, and Greene (1999), is analogous to the “residual change score method” that has been recommended to evaluate change (Cronbach & Furby, 1970). It allows one to adjust for initial differences between BHs and between children, to deal with children who come and go at different ages, and to control for selective attrition. It accomplishes the latter, because the prediction equation is based on all the residents at one point in time in the BHs, which includes the effects of selective attrition.
Calculations of No-Intervention Developmental Profiles
All children in all three BHs having a preintervention baseline assessment were used to determine the no-intervention developmental profiles. This sample represented at any one point in time the developmental status of children in the BHs from approximately birth to 48 months before any intervention was implemented. Regressions were calculated separately for typically developing children and for those with disabilities (see definition in Chapter IV), for each BH, and for males versus females for each of the four physical-growth measures (i.e., height, weight, head circumference, chest circumference). As expected, equations for typically developing children were markedly different than those for children with disabilities, but within these groups, the slopes for the three BHs and for the two genders were nearly identical. Consequently, a single equation was used for each of the physical-growth measures for typically developing children of both genders and for each BH and a different equation was used for children with disabilities. The best fitting equations were quadratic.
Treatment Effect Calculations
Individual difference error variance potentially could be minimized if no-intervention predictions were made for individual children based on their preintervention assessed value. This strategy assumes some stability of individual differences across age. To test this assumption, correlations were calculated for children in the NoI BH for each of the four physical-growth measures between children's deviations from the NoI prediction equation at preintervention initial assessment with deviations from the NoI equation at their last postintervention assessment. These correlations were all substantial and significant indicating that it was reasonable to use the child's preintervention residual from the no-intervention equation plus the prediction equation to calculate individual children's postintervention deviation.
Thus, each child's “treatment effect” consisted of the child's actual assessed postintervention measurement minus the predicted no-intervention value calculated for that child on the basis of extending that child's initial assessment deviation using the slope of the no-intervention equation over the number of months between pre- and postintervention assessments.
Covariates
A variety of covariates were explored and selected by a multiple-step procedure. This procedure was used for each measure on children in this monograph.
Potential covariates for the physical-growth measures included the initial value (the deviation of the actual observed initial score from the value predicted by the no-intervention prediction equation for the child's initial age), birth weight (both actual and low birth weight yes/no), gestational age, mean Apgar score (average of 0- and 10-min scores), the Functional Abilities Index (FAI) total score, child's age at preintervention assessment, and whether (yes/no) the child received any perinatal artificial ventilation.
Simple Correlation With the Dependent Variable
The first step in determining eligible covariates was to calculate their simple correlations with the dependent variable. Each of the potential covariates listed above had significant correlations with the physical-growth measures.
Sufficient Ns
Only 6% of the sample of typically developing children had experienced artificial ventilation, and gestational age was missing from the hospital reports for 15% of the sample; hence, these variables were eliminated as potential covariates because they would have reduced Ns, which were already minimal in the longitudinal samples.
Minimum Set
The remaining potential covariates were entered into a set of analyses of covariance with the dependent variables, and the unique contribution of each was determined. Those covariates that did not display significant unique contributions were eliminated from the first analysis, the significant covariates entered into a second analysis, and nonsignificant covariates eliminated from it, until a minimum set was obtained that approached being necessary and sufficient. It should be noted that the first such analysis failed to find a consistent effect for the age of the child at the preintervention physical-growth assessment, which implies that once other covariates are entered, the intervention effects to be reported do not vary with the age of the child. This means that the effects on physical growth occur rather uniformly regardless of the age period at which the child experienced the intervention.
Homogeneity of Slope Assumption
The minimum set of covariates also had to satisfy the homogeneity of slope assumption, and if this assumption was significantly violated, the covariate with the least unique variance shared with the dependent variable was eliminated until the assumption could be met.
A Common Set
The above steps were taken separately for each dependent variable, but for purposes of comparability it was desired to have a single set of covariates for all four physical-growth variables. The covariates that most consistently survived the preceding tests were the initial deviation value of the specific dependent variable and birth weight, which became the two covariates used in all of the univariate physical-growth analyses. Each of the four initial deviation values were standardized and averaged for each child and this average standardized initial value was used in multivariate analyses, which do not permit unique covariates for different dependent variables. These two variables conceptually as well as statistically embody the consequences of a variety of perinatal circumstances characterized by the variables that were eliminated, which had simple correlations with the dependent variable but whose effects were subsumed by and reflected in initial value and birth weight. It should be noted that using a single set of covariates for all four dependent measures meant that certain typical assumptions (e.g., homogeneity of slope, significance of correlation of each covariate with dependent variable) were not always met in each analysis.
Covariates for Children With Disabilities
The same steps described above for typically developing children were followed for the purpose of identifying covariates for children with disabilities. The surviving covariates were the same as for typically developing children (i.e., initial deviation score, birth weight) plus mean FAI, which reflected additional initial variations in physical size within the disability group.
Basic Analyses
Several basic analyses were conducted.
Cross-Sectional Analysis
The minimum exposure to an intervention was deemed to be 4 months, a child's final postintervention assessment was used as the outcome variable, and children's final postintervention assessment was categorized as representing either 4−9 months or 9+ months of exposure to the intervention (or after the end of the baseline period for NoI children). Consequently, the first basic analysis was a Gender (M, F) × Exposure (4−9, 9+ months) × Intervention (T+SC, TO, NoI) analysis of covariance with initial value and birth weight as covariates on the child's treatment effect for the last postintervention assessment. For children with disabilities, the FAI was added as a covariate and gender was dropped as an independent variable because of small N (gender rarely was a significant contributor for typical children).
These cross-sectional analyses had the benefit of having maximum N and an unselected sample of children except, importantly, effects of exposure length would be confounded with any selective attrition.9
Longitudinal Analysis
As a complement to the cross-sectional sample, a longitudinal sample would provide evidence that the interventions produced changes within individual children and exposure effects would not be confounded with selective attrition. However, the longitudinal sample would be smaller and somewhat selected because it would consist of children who would not be adopted or restored within 9+ months of intake at the BH. Results for both the cross-sectional and longitudinal analyses on children's outcomes are presented in this monograph, even though they often produced the same general results. Each sample contained a major confound that would severely limit attributing the results to the interventions alone, whereas converging results from both samples constitute a more persuasive argument. The basic longitudinal analysis was a Gender × Exposure (4−9, 9+ months) × Intervention (T+SC, TO, NoI) analysis of covariance with initial value, birth weight, and mean FAI (for children with disabilities) as covariates on the treatment effect for each of the four growth measures.
Multivariate Analyses
For each of the two basic analyses described above, multivariate analyses of covariance were conducted initially using all four physical-growth measures simultaneously as multiple dependent variables. The covariates were birth weight and the mean initial standardized deviation score averaged over the four dependent measures (plus mean FAI for children with disabilities). The multivariate analyses were conducted to evaluate the intervention effects for the general construct of physical growth as defined by the set of four dependent measures.
PHYSICAL-GROWTH RESULTS
The psycho-social short stature and psycho-social dwarfism hypotheses would predict that (1) the two training interventions should produce greater growth treatment effects than the NoI group, (2) T+SC would produce greater growth than TO because of better social–emotional interactions, and (3) there should be a dose–response effect such that children (especially T+SC) would display greater growth treatment effects with 9+ than with 4−9 months of exposure. Generally, these predictions were verified, with minor inconsistencies.
Typically Developing Children
Multivariate Analysis
Table 4 presents the statistical summary of the cross-sectional and longitudinal analyses of physical-growth treatment effects for typical children at the left, beginning with the Gender × Intervention × Exposure multivariate analysis of all four physical-growth treatment effect variables with the mean initial value and birth weight as covariates. Both covariates were highly related to the dependent variables, each main effect and the Intervention × Exposure interaction were significant, and the intervention effect was significant within each exposure level—exposure 4−9 months: F(8, 760) = 2.42, p<.01, η2 = .03; exposure 9+ months: F(8, 760) = 8.27, p<.001, η2 = .08. Generally, males showed greater treatment effects than females on essentially every physical-growth measure and in every cell but with no interactions with the other factors.
TABLE 4.
Statistical Summary of Cross-Sectional and Longitudinal Analyses of Physical-Growth Treatment Effects for Typical and Children With Disabilitiesa
| Typically Developing |
Children With Disabilities |
|||||
|---|---|---|---|---|---|---|
| Intervention | Exposure | Intervention × Exposure | Intervention | Exposure | Intervention × Exposure | |
| MANCOVA | ||||||
| Cross-sectional F(η2) | 7.83*** (.08) | 3.36** (.03) | 2.55*** (.03) | 2.35* (.15) | 1.03 (.07) | 0.99 (.07) |
| Longitudinal F(η2) | 4.09*** (.10) | 7.21*** (.16) | 4.04*** (.10) | 2.88** (.30) | 3.83* (.34) | 1.89† (.20) |
| Height | ||||||
| Cross-sectional F(η2) | 12.39*** (.06) | 0.49 (.00) | 5.72** (.03) | 5.19*** (.14) | 1.10 (.02) | 2.84† (.08) |
| Longitudinal F(η2) | 5.87** (.07) | 0.26 (.00) | 2.50† (.03) | 5.24* (.26) | 2.83 (.08) | 1.49 (.08) |
| Weight | ||||||
| Cross-sectional F(η2) | 12.80*** (.06) | 1.38 (.00) | 1.74 (.01) | 2.75† (.07) | 0.01 (.00) | 0.89 (.03) |
| Longitudinal F(η2) | 5.70** (.07) | 2.36 (.02) | 3.45* (.04) | 4.45* (.23) | 0.37 (.01) | 2.26 (.12) |
| Chest circumference | ||||||
| Cross-sectional F(η2) | 7.04*** (.04) | 0.45 (.00) | 0.80 (.00) | 5.30** (.14) | 0.40 (.01) | 5.04** (.15) |
| Longitudinal F(η2) | 9.42*** (.11) | 0.18 (.00) | 1.28 (.02) | 5.15* (.26) | 1.13 (.03) | 0.30 (.02) |
| Head circumference | ||||||
| Cross-sectional F(η2) | 0.33 (.00) | 11.19*** (.03) | 1.24 (.01) | 2.12 (.06) | 0.40 (.01) | 0.05 (.00) |
| Longitudinal F(η2) | 0.17 (00) | 11.66*** (.07) | 2.51† (.03) | 2.86† (.16) | 4.08† (.11) | 0.48 (.03) |
Note.
Analyses are Gender × Intervention (T+SC, TO, NoI) × Exposure (4−9 months, 9+ months) with initial value deviation and birth weight as covariates for typical plus functional abilities for disabilities. Gender main effect for typicals was always significant but no interactions were significant. Degrees of freedom: cross-sectional MANCOVA typical = 8/760 and 4/380 and disability = 8/108 and 4/54; MANCOVA longitudinal typical = 8/292, 4/148, 8/296 and disability = 8/54, 4/30, 8/60. Univ- ariate ANCOVA cross-sectional typical = 1 or 2/387 and disability = 1 or 2/63; longitudinal typical = 2/149 and 1 or 2/15, and disability = 2/30, 1/33, 2/33.
p ≤ .10
p ≤ .05
p ≤ .01
p ≤ .001.
Height
Statistical results for each ANCOVA for each of the four physical-growth measures for each sample are also given in Table 4. Figure 15 presents the results for estimated treatment effects for the three statistically significant measures for the cross-sectional sample adjusted for initial deviation value at the left and the unadjusted effects for the longitudinal sample at the right (SPSS does not adjust within-subjects effects for between-subjects covariates).10 However, because initial assessment value is used in the no-treatment prediction equation, differences between groups at each exposure level can be interpreted as being associated with the different interventions in both samples. There was a significant intervention effect for height, weight, and chest circumference but not head circumference plus an Intervention × Exposure interaction for height in both samples. Because there was no interaction with gender, the effects in Figure 15 left were replicated for both sexes. For children exposed 4−9 months, both T+SC (p<.017) and TO (p<.012) showed a greater treatment effect than NoI, but only T+SC was significantly greater at 9+ months in the cross-sectional sample. T+SC showed a non-significant trend (p<.088) of a dose–response effect (i.e., 9+ >4−9-month exposure): Children exposed to 9+ months of T+SC produced a 1 cm “dose–response” increment over 4−9 months of exposure.
Figure 15.

Estimated treatment effects for typical children adjusted for initial assessment deviation from expectation and birth weight for the cross-sectional sample (left) and unadjusted for longitudinal sample (right) of children with 4−9 or 9+ months of exposure in the T+SC, TO, and NoI groups.
Weight
Figure 15 presents the same results for the weight treatment effect, but here only the intervention effect was significant, with both the T+SC and TO greater (ps<.001) than NoI. Although there was no general Intervention × Exposure interaction, T+SC showed a dose–response effect (p<.045) in the cross-sectional and T+SC and TO did so in the longitudinal sample.
Chest Circumference
Figure 15 also shows a pattern for chest circumference that is similar to that for weight. Both T+SC (p<.001) and TO (p<.006) were larger than NoI in the cross-sectional sample. Again, T+SC shows consistent effects over NoI for both levels of exposure (p<.06, p<.002). The longitudinal sample has a different pattern at 4−9 month of exposure, but the results are the same at 9+ months.
Head Circumference
There were no main effects or interactions for intervention with respect to head circumference.
Children With Disabilities
Because of the substantially smaller Ns (approximately 70 vs. 400), statistically significant effects for children with disabilities occurred less frequently but the effect sizes were larger than for typically developing children. The T+SC group more clearly demonstrated a greater treatment effect after 9+ months than after 4−9 month of exposure than did typical children.
Multivariate Analysis
The results of the multivariate analysis of covariance on all four physical-growth measures using the mean initial deviation value across measures, birth weight, and mean FAI as covariates revealed an intervention effect (see Table 4 for statistics and Figure 16 for graphs). The physical-growth results for children with disabilities is generally similar to those for typically developing children in that the T+SC group tends to show larger treatment effects and is more consistent across both 4−9 and 9+ months of exposure. In contrast, the NoI comparison group does somewhat better than expected but only at 4−9 months in the cross-sectional sample.
Figure 16.

Estimated treatment effects for children with disabilities adjusted for initial assessment for the cross-sectional (left) and unadjusted for the longitudinal sample (right) of children with 4−9 or 9+Mos. Exposure in the T+SC, TO, and NoI groups.
Height
Table 4 shows univariate effects for children with disabilities that roughly follow the same pattern as for typically developing children in that there are significant or near significant intervention effects for height, weight, and chest circumference but only marginally significant interactions for height and chest circumference.
Specifically for height, Figure 16 shows the T+SC group to be significantly higher than both TO (p<.01) and NoI (p<.007) after 9+ months of exposure and marginally significantly greater than TO at 4−9 months (p<.059) in the cross-sectional sample; T+SC was higher than the other groups, again especially after 9+ months of exposure, in the longitudinal sample.
Weight
Figure 16 shows a similar graph for weight but the levels of statistical significance are lower. T+SC shows a larger effect than the other groups, especially after 9+ months of exposure.
Chest Circumference
Again, Figure 16 shows the same graphic pattern of results in which there is an intervention effect (p<.007) in both samples and a significant interaction (p<.006) in the cross-sectional sample associated mostly with NoI. Again, T+SC is consistently greater after 9+ months of exposure than TO and NoI.
Head Circumference
There were no significant treatment effects for this variable.
FUNCTIONAL ABILITIES
Would the interventions improve the functional abilities of both typically developing children and those with disabilities?
Samples and Assessments
Samples
The same general samples of children used to assess physical growth were analyzed for functional abilities.
Assessments
The modified FAI (Chapter IV) produced a total score (higher values representing more extreme limitations) composed of nine subscale scores. Analyses consisted of univariate analyses of covariance on the total score and multivariate followed by univariate analyses of covariance on the nine subscales.
The results for typically developing children were consistent across analyses in showing that T+SC and TO had lower levels of FAI (e.g., better functioning after adjusting for initial levels) and declined (i.e., improved) with increasing exposure to the interventions, whereas NoI had higher levels and did not decline with increased exposure.
Cross-Sectional Samples
An Intervention (T+SC, TO, NoI) × Exposure (4−9, 9+ months) ANOCOVA with birth weight, age at initial assessment, and the child's FAI total score at initial assessment as covariates was calculated using total FAI score at 4−9 and 9+ months as the dependent variable. Covarying initial FAI score statistically equates the intervention conditions on initial score. The analysis produced a significant intervention main effect, F(2, 394) = 48.31, p<.001, η2 = .20, and all three pairs of intervention conditions were significantly different from one another with TO<T+SC<NoI. A signifi-cant Intervention × Exposure interaction, F(2, 394) = 5.48, p<.004, η2 = .03, indicated that the difference between intervention conditions was more pronounced after 9+ months of exposure at which point both TO and T+SC were lower than NoI.
The multivariate analyses of covariance on the nine FAI scores (using initial FAI total score as a covariate) produced the same multivariate results—intervention: F(16, 774) = 14.41, p<.001, η2 = .23; Intervention × Exposure: F(216, 774) = 2.92, p<.001, η2 = .06. Significant univariate main effects for intervention were found for the subscales of intellectual functioning, hands–arms–legs, communication, tonicity, physical health, and vision, and significant interactions occurred for intellectual functioning, hands–arms–legs, tonicity, and vision. Although the pattern of univariate effects differed slightly from one to the next subscale, generally they reflected the overall results that NoI had higher values and tended to increase, not decrease (or decrease less) with increasing exposure than T+SC and TO.
Longitudinal Sample
Similar analyses were conducted on the smaller longitudinal sample with approximately the same results. That is, the intervention main effect was significant for FAI total score, F(2, 91) = 24.10, p<.001, η2 = .35, and all pairs of intervention conditions were significantly different. The Intervention × Exposure interaction approached significance, F(2, 94) = 2.78, p<.07, η2 = .06, with the same pattern of results that T+SC and TO have lower levels and decline with exposure while NoI has higher levels and does not decline. Because the results for the two samples were so similar, only the longitudinal results are portrayed in Figure 17.
Figure 17.
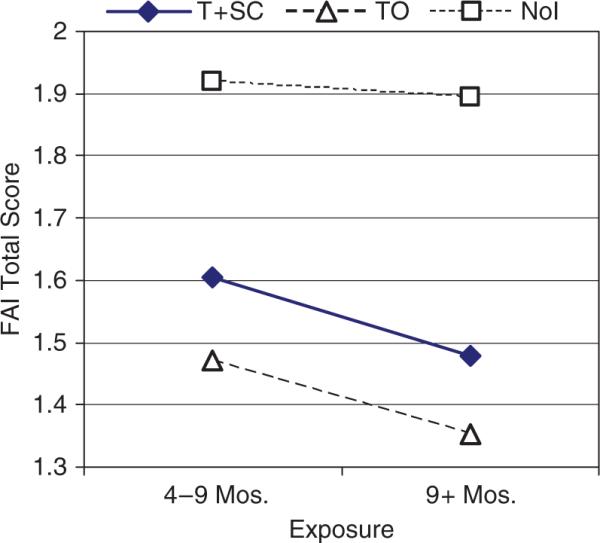
Functional Abilities Index total score for typically developing children in T+SC, TO, and NoI as a function of length of exposure to the intervention for the longitudinal sample.
The multivariate analysis of covariance on the nine FAI scores using initial total FAI as a covariate with age at initial assessment (birth weight was not significantly related to the dependent variables) produced the same significant multivariate effects—intervention main effect: F(16, 184) = 7.72, p<.001, η2 = .40; Intervention × Exposure: F(16, 188) = 2.30, p<.004, η2 = .16. Significant univariate effects were obtained for intellectual functioning, hands–arms–legs, communication, tonicity, physical health, and vision and significant univariate interactions for intellectual functioning, physical health, and structural status, which again indicated that T+SC and TO tended to decline with increasing exposure but NoI did not.
Children With Disabilities
Comparable analyses were conducted on the much smaller samples of children with disabilities (cross-sectional intervention group Ns = 117−140, longitudinal intervention groups Ns = 8−16). No multivariate or univariate main effects, interactions, or simple effects tests were significant, and most Fs<1.00. Generally, FAI scores increased (i.e., worsened) in all three BHs with increasing exposure (which is confounded with age). This result is not surprising given the substantial differences in functional abilities between children with a variety of severe diagnoses, some of which would be associated with more limiting conditions as the children grew older.
DISCUSSION
Physical Growth
Generally, the results of this large quasi-experimental study provide perhaps the most persuasive and comprehensive support for the psychosocial-short stature or psychosocial dwarfism hypothesis, in that the two social–emotional-relationship intervention conditions produced greater growth in height, weight, and chest circumference than occurred in the NoI control condition. For typically developing children, both T+SC and TO produced growth benefits, but a dose–response effect tended to occur only for T+SC, which showed greater benefits of the intervention after 9 months than the other groups, especially for height. No effects were observed for head circumference. It is not clear why TO did relatively better, especially on weight and chest circumference, than might be expected on the basis of the extent to which TO implemented the intervention (e.g., only modest increases in HOME scores). TO was known to have a summer nutrition program in which food supplements were provided, and this unique provision may have contributed in some way to weight gains.11
The results were similar for children with disabilities in which T+SC children tended to do better than TO and NoI, especially at 9 months of exposure. Again, no effects were observed for head circumference.
The failure to find improvement in head circumference is not unique. Institutionalized children who were transferred to foster care showed increases in height and weight after an average of approximately 25 months in foster care, but no general increases in head circumference (Nelson, 2006), although children who started with very small head circumferences did increase with foster care (D. E. Johnson, personal communication, January 19, 2007). Further, in one of the most comprehensive longitudinal studies (Rutter et al., 2007) as well as in a meta-analysis of catch-up growth after international adoption (van Ijzendoorn et al., 2007) almost complete catch-up occurred with respect to height and weight, but catch-up of head circumference was slower and remained incomplete. In contrast, Kim et al.'s (2003) sensory intervention was much less intense and lasted only 4 weeks yet produced height, weight, and head circumference gains in young infants. These inconsistencies may be explained by the fact that head circumference is influenced more readily before 12 months of age and takes longer to change afterward relative to height and weight (D. E. Johnson, personal communication, October 18, 2007).
Functional Abilities
The FAI results indicate that for typically developing children, the T+SC and TO groups displayed fewer signs of physical and behavioral functional limitations than NoI after initial values were statistically controlled, and 9+ months of exposure was associated with even lower (better) T+SC and TO scores whereas NoI remained higher. This result occurred in both cross-sectional and longitudinal samples, indicating that it was not artificially produced by selective attrition, and the effects occurred among typically developing children who had a restricted range of mild functional limitations. No significant effects were observed for children with more severe disabilities, likely because of the much smaller Ns and greater variability in their limitations. Casual observations, however, indicated that at least some children with disabilities in T+SC improved substantially in many behavioral dimensions in ways they would not otherwise have accomplished.
Why children in TO did somewhat better than those in T+SC—an unusual result in this report—is not clear. However, TO tended to be assigned relatively fewer children with mild or severe disabilities of any kind. The Special Teachers, who were responsible for remediating children with disabilities, were more experienced in TO than in the other BHs and were widely regarded as being among the best in the area. If true, better Special Teachers attending to fewer children needing specialized care might explain the better outcomes for TO than T+SC. Alternatively, the FAI and physical growth were the only measures on children made by BH staff rather than independent research staff. The same self-perceptions of TO Special Teachers and physicians described above, who conducted the FAI ratings, may have contributed to better scores.
Practical Implication
Not only do these results provide support for the scientific hypothesis suggesting that early social–emotional-relationship experience should improve physical growth in terms of height, weight, and chest circumference as well as physical functioning in young children, but they provide important practical support for changing attitudes toward the potential of social–emotional-relationship promoting intervention programs to improve children's development. The BHs are administered by the Ministry of Health and directed by pediatricians who tend to have traditional attitudes that do not embrace the contemporary pediatric understanding that the behavioral environment can influence physical growth and physical abilities. The fact that a social–emotional-relationship intervention improved children's physical development and reduced minor physical limitations will likely constitute surprising evidence to the traditional medical community and perhaps contribute to persuading them to consider such changes in the BHs.
IX. THE EFFECTS OF THE INTERVENTION ON CHILDREN'S GENERAL BEHAVIORAL DEVELOPMENT (BATTELLE DEVELOPMENTAL INVENTORY)
General behavioral development was assessed with the Battelle Developmental Inventory (BDI), which produces a Total Score and the six subscales of Personal–Social, Fine Motor, Gross Motor, Adaptative, Communication, and Cognition.
The primary focus of the intervention was to create a better social–emotional-relationship environment for the children, so the intervention was expected to produce the most profound gains in Personal–Social development. But inherent in adult–child relationship building is an increase in talking, which might promote communication development, and some talking communicates thoughts, which may promote cognitive development. Further, improved relationships may motivate children to perform other kinds of behaviors, including gross and fine motor and adaptative (i.e., feeding, dressing self-sufficiency) skills. So improved development in all domains was possible.
Further, there should be a tendency for a “dose–response effect,” in which children exposed longer to the intervention should improve developmentally more than children exposed shorter periods of time. Again, this effect might be strongest for the Personal–Social subscale because this was the focus of the intervention, relationships take time to build, personal–social-relationships tend to be specific to a particular caregiver whereas many different caregivers could promote language and cognition in a shorter period of time, and social–emotional behaviors are more clearly seen in the second year of life when more children with 9+ months of exposure would have experienced the interventions.
Finally, we expected children with disabilities generally to display the same intervention effects as typically developing children. Although there were far fewer children with disabilities, which limited statistical power, they might show similar or even greater effect sizes if not significance levels, because before the interventions children with disabilities were ignored to an even greater extent than typically developing children. The assumption by directors and caregivers was that they were incapable of much developmental progress.
METHOD
Samples
Four samples of children similar to those defined for the analyses of physical growth measures were identified. Children were classified as typically developing or with disabilities (Chapter IV), and within these groups there was a cross-sectional and a longitudinal sample (Chapter VIII).
STATISTICAL ANALYSES
Variables
Dependent Variables
Developmental Quotients (DQ) were computed for Total Score and each subscale, which consisted of dividing the child's Battelle age equivalent (i.e., “mental age”) by his or her age in months at the time of the assessment. These DQs reflect a cumulative rate of growth and had the advantage of being “age invariant,” but comparisons with contemporary noninstitutionalized samples with mean DQ = 100 are limited by the outdated norms.
Covariates
Appropriate covariates were determined by the same process described in Chapter VIII. Two covariates were relevant for all four samples: The child's age on the date of the child's initial BDI assessment and the child's Functional Abilities Index (FAI) Total Score determined on the assessment closest in time to the initial BDI test. The child's initial Battelle score was also used as a covariate in certain analyses. Using the same covariates for each BDI subscale meant that homogeneity of slope was achieved and each covariate was significant for most, but not every, analysis.
Cross-Sectional Analyses
The cross-sectional samples of both typically developing and children with disabilities were analyzed separately with Intervention (T+SC, TO, NoI) Exposure (4−9, 9+ Months) × Gender analyses of covariance. Multivariate analyses of covariance (MANCOVA) were initially conducted on the Battelle's six subscales as dependent variables with age at initial assessment, FAI total score at initial assessment, and the average of the child's six initial assessment subscale scores as covariates. Univariate analyses of covariance (ANCOVA) were then conducted on the Battelle Total Score and each of the subscale scores using the child's age, FAI score, and the value of the dependent variable at the initial assessment as covariates.
These analyses followed the strategy of assessing change (i.e., between initial and final outcome score) by using the initial score as a covariate and the outcome score as the dependent variable (Cronbach & Furby, 1970). Thus, these analyses adjusted statistically for any differences in the initial ages, FAI, or baseline Battelle scores between the three intervention conditions. Gender was included as an independent variable only to determine if the effects of the interventions differed between the genders.
Longitudinal Analyses
Analyses of the longitudinal samples consisted first of analyses of the Intervention (T+SC, TO, NoI) × Exposure (Initial, 4−9, 9+ Months.) interaction. MANCOVAs on the six Battelle subscales using age and FAI total score at initial assessment as covariates were followed by similar univariate ANCOVAs. Gender was not included because it would have made cell sizes too small. Gender effects for the cross-sectional samples were infrequent. The primary intent of these analyses was to demonstrate the possible presence of an Intervention × Exposure interaction when the exposure factor included three levels—the initial score as well as scores after 4−9 and 9+ months of the intervention (i.e., development should increase across time more for T+SC than TO than NoI). These analyses also revealed more clearly the amount of change from the initial value associated with the interventions, but they did not adjust for possible BH differences on initial status.
The main longitudinal analyses added as a covariate the average initial subscale score for the MANCOVA and the initial score of the dependent measure for each of the ANCOVAs, following the Cronbach and Furby (1970) strategy of assessing change. This had the effect of statistically equating the Intervention conditions on initial Battelle scores before assessing between-subjects Intervention outcomes. Note that this covariance procedure may adjust general level but does not adjust the within-subjects pattern over exposure.12
Interpretive Strategy
A detailed set of a priori simple effects and specific comparisons were conducted within most of the above analyses. Because it was hypothesized that T+SC would do better than both the TO and the NoI and that the TO intervention should do better than the NoI, these specific comparisons were assessed within the overall analysis as well as separately within the 4−9 months and the 9+ months levels of exposure using the least significant difference test. Exposure effects were assessed for intervention differences in general and also separately within each intervention condition (e.g., 4−9 vs. 9+ months separately within T+SC), because exposure effects were expected only for the two intervention BHs (i.e., T+SC and TO). The Intervention × Exposure interaction was also determined between each pair of intervention conditions, because greater exposure effects were expected for T+SC versus TO versus NoI.
All statistical results regardless of statistical significance are presented for each of the analyses on each of the four samples, including significance level (p<.10 included) and all η2 percent variance estimates of effect sizes (simple η2 for multivariate and partial η2 for univariate tests). These procedures were followed because Ns varied between samples and reporting only significant results would be influenced to a large extent by differences in power between the samples. Providing all of the statistical results, especially the specific comparisons and the effect sizes, permits the reader to more easily perceive trends across samples despite their differences in power and significance levels.
RESULTS
Typically Developing Children
Table 5 presents the Fs, significance levels, and percent variance effect sizes (η2) for the Battelle DQ scores as a function of intervention and length of exposure for the cross-sectional sample of typically developing children using initial score, age at initial assessment, and FAI at initial assessment as covariates. The first column presents the results of a MANCOVA, while the remaining columns report results for separate ANCOVAs. The top block of rows gives the results for the intervention main effect, which consists first of the test of differences among all three intervention conditions followed by specific comparisons between each pair of intervention conditions across exposure conditions. It should be noted that these three paired comparisons are not mutually independent, but each was nevertheless of a priori interest. These results communicate whether the intervention conditions differed from one another across length of exposure after covariance adjustments for age, FAI, and initial performance.
TABLE 5.
Fs, Significance Levels, Effect Sizes (η2) for Battelle Developmental Inventory DQs as a Function of Intervention Condition (T+SC, TO, NoI) and Length of Exposure (4−9, 9+ Months) for the Cross-Sectional Sample of Typically Developing Childrena
| mancova | Total | Personal-Social | Fine Motor | Gross Motor | Adaptative | Communication | Cognition | |
|---|---|---|---|---|---|---|---|---|
| Intervention main effectb | ||||||||
| 3 BHs | 2.46** (.03)f | 43.21*** (.17) | 30.69*** (.13) | 34.44*** (.14) | 21.84*** (.09) | 8.23*** (.04) | 25.44*** (.11) | 19.34*** (.08) |
| T+SC > NoI | 75.91*** (.15) | 54.18*** (.11) | 57.04*** (.12) | 34.75*** (.08) | 8.08** (.02) | 40.05*** (.09) | 37.31*** (.08) | |
| T+SC > TO | 49.42*** (.10) | 34.49*** (.08) | 46.01*** (.10) | 30.57*** (.07) | 15.25*** (.04) | 36.10*** (.08) | 16.09*** (.04) | |
| TO > NoI | 4.75* (.01) | 3.83* (.01) | 1.42 (.00) | 0.63 (.00) | 0.72 (.00) | 0.45 (.00) | 5.76*(.01) | |
| Intervention at 4−9 monthsc | ||||||||
| 3 BHs | 1.36 (.02) | 11.41*** (.05) | 4.68** (.02) | 8.14*** (.04) | 6.66*** (.03) | 1.97 (.01) | 5.44** (.03) | 4.14* (.02) |
| T+SC > NoI | 21.63*** (.05) | 7.74** (.02) | 11.65*** (.03) | 12.17*** (.03) | 2.22 (.01) | 10.76*** (.03) | 8.11** (.02) | |
| T+SC > TO | 11.77*** (.03) | 6.66** (.02) | 13.45*** (.03) | 7.89** (.02) | 3.62† (.01) | 4.32* (.01) | 1.39 (.00) | |
| TO > NoI | 4.15* (.01) | 0.54 (.00) | 0.17 (.00) | 1.74 (.00) | 0.01 (.00) | 3.08† (.01) | 4.41* (.01) | |
| Intervention at 9+ monthsd | ||||||||
| 3 BHs | 3.42***(.04) | 37.77*** (.15) | 36.10*** (.15) | 32.71*** (.13) | 16.97*** (.07) | 6.79*** (.03) | 24.56*** (.10) | 20.49*** (.09) |
| T+SC > NoI | 69.65*** (.14) | 69.82*** (.14) | 61.61*** (.13) | 27.68*** (.06) | 7.50** (.02) | 37.30*** (.08) | 39.63*** (.09) | |
| t+sc > to | 39.52*** (.09) | 29.96*** (.07) | 33.22*** (.07) | 23.40*** (.05) | 12.36*** (.03) | 36.86*** (.08) | 17.90*** (.04) | |
| TO > NoI | 1.55* (.00) | 4.55* (.01) | 1.73 (.00) | 0.01 (.00) | 1.28 (.00) | − 0.46 (.00) | 2.18 (.01) | |
| Exposuree | ||||||||
| 3 BHs × Exposure | 1.96* (.02) | 3.94* (.02) | 7.01*** (.03) | 4.08* (.02) | 1.87 (.01) | 1.15 (.01) | 5.67** (.03) | 3.56* (.02) |
| T+SC | 8.75*** (.09) | 22.60*** (.05) | 22.41*** (.05) | 31.80*** (.07) | 37.86*** (.08) | − 1.19 (.00) | 8.02** (.02) | 3.36† (.01) |
| TO | 11.07*** (.12) | 1.59 (.00) | 1.84 (.00) | 9.57** (.02) | 15.28*** (.04) | −11.76*** (.03) | −3.15† (.01) | −2.96† (.01) |
| NoI | 10.71*** (.11) | 3.94* (.05) | .06 (.00) | 4.43* (.01) | 28.79*** (.06) | −5.37* (.01) | .52 (.00) | − 1.35 (.00) |
| T+SC > NoI | 4.83* (.01) | 9.77** (.02) | 7.69** (.02) | .94 (.00) | 0.56 (.00) | 2.88† (.01) | 4.59* (.01) | |
| t+sc > to | 7.11** (.02) | 4.21* (.01) | 4.41* (.01) | 3.72* (.01) | 2.22 (.01) | 11.30*** (.03) | 6.29** (.02) | |
| TO > NoI | 0.26 (.00) | 1.22 (.00) | 0.49 (.00) | 1.04 (.00) | 0.62 (.00) | −3.13† (.01) | − 0.16 (.00) |
Note.
T+SC N(4−9 months) = 63, N (9 + months) = 57; TO N (4−9 months) = 109, N (9+ months) = 54; NoI N (4−9 months) = 60, N (9+ months) = 100.
Based upon the intervention main effect in an Intervention (T+SC, TO, NoI) × Gender × Exposure (4−9, 9+mos.) analysis of covariance with initial score, age, and Total Functional Ability Index score at initial assessment as covariates. "3 BHs" is the main effect for all three intervention groups; other lines are the hypothesized directional main effects for each pair of hypothesized intervention groups (the three pairs are not independent comparisons).
Intervention group differences tested only at the 4−9 months exposure using the analysis described in b above.
Intervention group differences tested only at the 9+ months exposure using the analysis described in b above.
Based upon the exposure factor in the analysis of covariance described in note b above. "3 BHs × Exposure" is the Intervention (T+SC, TO, NoI) × Exposure (4−9, 9+ months) interaction; the T+SC, TO, and NoI lines reflect the exposure main effect within each intervention condition; the pairwise comparisons are the hypothesized directional Intervention × Exposure interactions for specific pairs of intervention conditions (the three pairwise comparisons are not independent). Because the covariates each consist of a single score per child, they do not influence the statistical results for the repeated factor of exposure or the Intervention × Exposure interaction.
Effect sizes for MANOVAs are nonpartial η2.
p ≤.10
p ≤ .05
p ≤ .01
p ≤ .001
minus signs preceding Fs indicate the direction of the effect was opposite to the hypothesis listed in that line of the table. Effect sizes for multivariate tests are simple η2; effect sizes for univariate tests are partial η2.
The middle two blocks of rows report differences between intervention conditions, initially for the three BHs and then for each paired comparison within the 4−9 months and separately within the 9+ months exposure condition. The bottom block of rows gives results for the exposure effect (i.e., “dose response” of 4−9 vs. 9+ months). The first line (“3 BHs”) reflects the Intervention × Exposure interaction, with significant results indicating that the exposure condition (i.e., “dose response”) was different for the three intervention conditions. This line is followed by a priori tests of the exposure effect conducted separately for each of the three intervention conditions. The last three lines test the Intervention × Exposure interaction separately for each pair of intervention conditions. The multivariate analyses are intended only to provide information on general effects, so most of the specific comparisons were not conducted within these analyses. Negative signs in front of F values (which are always positive) indicate that the direction of the difference was opposite to that hypothesized in the left column of Table 5.
Table 6 presents the same results for the longitudinal sample of typically developing children, except in this case the top line of Table 6 includes the results for the Intervention × Exposure interaction when all three levels of exposure (initial, 4−9, 9+ months) are included. The remainder of the table gives the results of analyses when initial value is used as a covariate with age and FAI.
TABLE 6.
Fs, Significance Levels, Effect Sizes (η2) for Battelle Developmental Inventory DQs as a Function of Intervention Condition (T+SC, TO, NoI) and Length of Exposure (4−9, 9+ Months) for the Longitudinal Sample of Typically Developing Childrena
| MANCOVA | Total | Personal-Social | Fine Motor | Gross Motor | Adaptative | Communication | Cognition | |
|---|---|---|---|---|---|---|---|---|
| Intervention × Exposureb | 4.47*** (.29)g | 13.07*** (.15) | 17.35*** (.19) | 9.75*** (.12) | 7.01*** (.09) | 3.89** (.05) | 4.83** (.06) | 5.32** (.07) |
| Intervention main effectc | ||||||||
| 3 BHs | 8.00*** (.45) | 26.18*** (.27) | 38.61*** (.35) | 29.81*** (.29) | 7.19*** (.09) | 9.38*** (.12) | 23.51*** (.25) | 14.51*** (.17) |
| T+SC > NoI | 43.94*** (.23) | 64.49*** (.31) | 45.03*** (.24) | 11.37*** (.07) | 9.94** (.06) | 36.37*** (.20) | 23.45*** (.14) | |
| T+SC > TO | 31.14*** (.18) | 45.71*** (.24) | 43.78*** (.23) | 9.74** (.06) | 16.83*** (.10) | 32.73*** (.18) | 19.15*** (.12) | |
| TO > NoI | 0.39 (.00) | 0.70 (.01) | 0.10 (.00) | 0.01 (.00) | 1.32 (.01) | − 0.01 (.00) | − 0.02 (.00) | |
| Intervention at 4−9 monthsd | ||||||||
| 3 BHs | 3.82*** (.27) | 13.24*** (.15) | 20.05*** (.21) | 3.97* (.05) | 3.35* (.04) | 8.66*** (.11) | 16.56*** (.18) | 9.68*** (.12) |
| T+SC > NoI | 24.44*** (.14) | 35.04*** (.19) | 7.35** (.05) | 6.62** (.04) | 15.75*** (.10) | 32.37*** (.18) | 18.62*** (.11) | |
| T+SC > TO | 14.86*** (.09) | 26.00*** (.15) | 4.50* (.03) | 1.30 (.01) | 10.27** (.07) | 14.54*** (.09) | 9.37** (.06) | |
| TO > NoI | 0.51 (.00) | 0.13 (.00) | − 0.16 (.00) | − 1.76 (.01) | − 0.23 (.00) | 2.35 (.02) | − 0.96 (.01) | |
| Intervention at 9+ monthse | ||||||||
| 3 BHs | 6.21*** (.39) | 21.92*** (.23) | 23.93*** (.24) | 35.57*** (.33) | 9.90*** (.12) | 5.55** (.07) | 16.17*** (.18) | 16.42*** (.18) |
| T+SC > NoI | 41.57*** (.22) | 47.13*** (.24) | 67.89*** (.31) | 17.17*** (.10) | 9.27** (.06) | 28.31*** (.16) | 32.63*** (.18) | |
| T+SC > TO | 22.69*** (.13) | 19.77*** (.12) | 35.81*** (.21) | 13.02*** (.08) | 7.76** (.05) | 20.91*** (.12) | 11.88*** (.07) | |
| TO > NoI | 1.58 (.01) | 4.07* (.03) | 2.95† (.02) | − 0.04 (.00) | − 0.01 (.00) | − 0.12 (00) | 3.83* (.03) | |
| Exposuref | ||||||||
| 3 BHs × Exposure | 3.97*** (.26) | 1.96 (.03) | 1.55 (.02) | 12.87*** (.15) | 2.03 (.03) | 0.23 (.00) | 0.62 (.01) | 1.27 (.02) |
| T+SC | 16.03*** (.40) | 21.86*** (.13) | 9.57** (.06) | 70.94*** (.32) | 21.26*** (.13) | − 0.53 (.00) | 1.72 (.01) | 2.12 (.01) |
| TO | 4.70*** (.16) | 8.93** (.06) | 11.53*** (.07) | 12.12*** (.08) | 3.32† (.02) | − 0.20 (.00) | 0.17 (.00) | 0.68 (.01) |
| NoI | 4.27*** (.15) | 6.40** (.04) | 2.61 (.02) | 5.43* (.04) | 19.93*** (.12) | 0.02 (.00) | 5.01* (.03) | 0.41 (.00) |
| T+SC > NoI | 3.91* (.03) | 1.81 (.01) | 24.87*** (.14) | 0.48 (.00) | 0.43 (.00) | 0.18 (.00) | 2.33 (.02) | |
| T+SC > TO | 2.17 (.01) | 0.05 (.00) | 12.10*** (.08) | 2.09 (.01) | 0.04 (.00) | 0.40 (.00) | 0.20 (.00) | |
| TO > NoI | 0.47 (.00) | 2.51 (.02) | 1.43 (.01) | − 3.85* (.03) | − 0.20 (.00) | − 1.24 (.01) | 1.08 (.01) | |
Note.
T+SC N = 44, TO N = 46, NoI N = 64.
Based upon the Intervention (T+SC, TO, NoI) × Exposure (Initial, 4−9, 9+ months) interaction in an analysis of covariance using age and Total Functional Ability Index score at initial assessment as covariates.
c-g Same as in Table 5.
Figure 18 presents at the top the results for the Battelle Total DQ for the cross-sectional sample of typically developing children adjusted for initial score, age, and FAI at initial assessment corresponding to the analyses presented in Table 5. At the bottom of Figure 18 is the graph of the longitudinal sample corresponding to the analyses presented in the top line of Table 6. They include the initial assessment as one of three levels of the exposure factor to portray the total amount of longitudinal change. The remainder of the statistical results in Table 6 have used initial scores as a covariate and analyzed only the 4−9 versus 9+ months exposure levels. The covariates adjust only the general level of the between-subjects Intervention condition, not its pattern over exposure levels. Figures 19 and 20 present the similar graphs for cross-sectional results (left) and longitudinal results (right) for each of the Battelle subscales.
Figure 18.

Top—Battelle Total DQ adjusted for initial score, age, and FAI at initial assessment for the cross-sectional sample of typical children in T+SC, TO, and NoI as a function of length of exposure. Bottom—Battelle Total DQ for the longitudinal sample of typical children in T+SC, TO, and NoI as a function of length of exposure.
Figure 19.

Left—Personal–Social, Fine Motor, and Gross Motor Subscale DQs adjusted for initial score, age, and FAI at initial assessment for the cross-sectional sample of typical children in T+SC, TO, and NoI as a function of length of exposure. Right—Personal–Social, Fine Motor, and Gross Motor DQs for the longitudinal sample of typical children in T+SC, TO, and NoI as a function of length of exposure.
The statistical and graphical results tend to support the hypotheses and are remarkably consistent across different subscales. The consistency between cross-sectional and longitudinal results suggests that the interventions produced intraindividual change and that the cross-sectional results were not simply due to selective attrition.
Intervention Main Effect
Cross-sectional sample
The hypotheses that the three intervention groups should differ in development with T+SC improving more than NoI and more than TO were generally supported in both cross-sectional and longitudinal samples. For the cross-sectional sample (Table 5), the multivariate analysis and the univariate analyses of Total Score and all six subscales of the Battelle revealed a significant intervention main effect (i.e., “3 BHs”), and T+SC was greater than NoI and also greater than TO for Total Score and each subscale. TO was higher than NoI on the Total Score but only on the Personal–Social and Cognition subscales. The superior adjusted performance at each exposure level of the T+SC over both TO and NoI can be seen clearly at the top of Figure 18 and at the left of Figures 19 and 20.
Figure 20.

Left—Adaptive, Communication, and Cognition subscale DQs adjusted for initial score, age, and FAI at initial assessment for the cross-sectional sample of typical children in T+SC, TO, and NoI as a function of length of exposure. Right—Adaptive, Communication, and Cognition Subscale DQs for the longitudinal sample of typical children in T+SC, TO, and NoI as a function of length of exposure.
Longitudinal sample
The results for the longitudinal sample (Table 6) were broadly similar with one exception. Whereas TO revealed significantly better developmental performance on the Total Score, Personal–Social, and Cognition subscales for the cross-sectional sample, TO was not better than NoI in the longitudinal tests of any subscale.
These effects can be seen at the bottom of Figure 18 and at the right of Figures 19 and 20, except these graphs picture the initial assessment for each group and thus do not adjust groups for this value as do the statistical analyses in Table 6. As a result, the cross-sectional and longitudinal results are actually more similar statistically than portrayed in these figures. The benefit of plotting all three points in the longitudinal graphs is that they reveal the amount of change from initial to 9+ months of exposure. Specifically, for typically developing children, the T+SC group improved in Total DQ from approximately 57 to 92 = 45 DQ points; TO from 45 to 72 = 27 DQ points; and NoI from 65 to 74 = 9 DQ points.
Effect sizes
In contrast to the rather substantial improvement in average DQ for T+SC, the percent variance effect sizes for the Intervention main effects were modest for the cross-sectional sample but more substantial for the longitudinal sample. This is because BH samples are highly variable and the intervention influences children to varying, even if substantial, extents. The largest effect size for the cross-sectional comparisons was .17 for the 3 BH comparison on Total Score, whereas for the longitudinal sample the η2 for the multivariate test of intervention main effects was .45 with univariate effects of .27 for Total Score and .35 for the Personal–Social Subscale. As might be expected from a primarily social–emotional-relationship building intervention, effect sizes tended be relatively larger for the Personal–Social subscale, and this was most clearly displayed for the longitudinal sample for which the effect for the Personal–Social subscale was even larger than for the Total Score for all three of the major comparisons.
Exposure
It was hypothesized that longer exposure to the intervention (i.e., 9+ vs. 4−9 months) would produce disproportionately higher developmental scores for the T+SC than the TO than the NoI groups. While a few comparisons were not significant, the overall pattern of results was consistent with this hypothesis.
Cross-sectional sample
For the cross-sectional sample (Table 5 bottom), the Intervention (“3 BHs”) × Exposure (4−9 vs. 9+ months) interaction with initial scores, age, and FAI status at initial assessment covaried was significant for the multivariate, Total Score, and the Personal–Social, Fine Motor, Communication, and Cognition Subscales. T+SC displayed a significant exposure (i.e., “dose response”) effect on the multivariate, Total Score, Personal–Social, Fine Motor, Gross Motor, Communication, and marginally on Cognition, but the other two Intervention groups also had multivariate and scattered univariate exposure effects, although some were in the wrong direction (i.e., indicated by a –F). More specific to the hypothesis, however, T+SC showed a greater dose–response exposure effect than NoI for Total Score, Personal–Social, Fine Motor, Cognition, and marginally for Communication, and T+SC had a greater dose–response effect than TO on all univariate comparisons except Adaptative. In contrast, TO did not show a positive exposure effect relative to NoI for any comparison (the marginally significant difference for Communication was in the wrong direction).
Examining this Intervention × Exposure interaction more specifically within each level of exposure, the pattern of results for the cross-sectional sample generally conformed to the hypothesis that the three intervention groups would differ from one another to a greater extent for children having 9+ rather than 4−9 months of exposure to the intervention. For example, at 9+ months, the three intervention group differences are significant for the multivariate and all univariate comparisons, and T+SC had higher scores than NoI and than TO; TO is higher than NoI for Total and Personal–Social but not the other subscales. While significance levels are similar but less consistent across subscales at 9+ months exposure, the percent variance accounted for at 9+ months is substantially greater than at 4−9 months, indicating that longer exposures to the interventions produced greater developmental increases in proportion to the extent of the intervention. These results can be seen at the left of Figures 19 and 20. Specifically, the T+SC line rises more from 4−9 to 9+ months than for the other two groups except for Gross Motor and Adaptative.
It should be noted that there were interactions with gender only for Fine Motor, Gross Motor, and Cognition. These effects tended to reflect the fact that the exposure effect was somewhat stronger for one gender than for the other, but these effects did not qualify to any substantial extent the overall results reported above except that T+SC males did not have an exposure effect for Cognition.
Longitudinal sample
For the longitudinal sample (Table 6), the general Intervention × Exposure pattern was similar but some of the details were different than for the cross-sectional sample. The Intervention × Exposure interaction was significant for the multivariate test but only for the Fine Motor univariate test, and all three intervention conditions showed exposure effects on the multivariate test and for Total Score but not consistently among the subscales. Further, the difference in exposure effects between pairs of intervention conditions were generally not significant except that T+SC showed a greater exposure effect than NoI for Total Score and Fine Motor.
Again, intervention effects were greater and had larger effect sizes at 9+ than at 4−9 months of exposure. At 9+ months, T+SC versus NoI, and T+SC versus TO are significant for all multivariate and univariate tests; this was also true at 4−9 months with only one exception (Gross Motor) but typically with smaller effect sizes. TO was not different from NoI except for Cognition at 9+ months.
Effect sizes
Effect sizes again were larger for the longitudinal sample, especially the multivariate tests. Univariate effect sizes tended to be largest for Personal–Social at 4−9 months of exposure and for Fine Motor followed by Personal–Social, Total, Communication, and Cognition, which were relatively similar at 9+ months.
Interactions with gender were significant for Total Score and Communication only, but in each case the T+SC and TO results were the same for both genders while the NoI trend was irregular and not obviously interpretable.
Children With Disabilities
Results of the same types of statistical analyses (except that gender was omitted as a factor) are presented in Table 7 for the cross-sectional sample and Table 8 for the longitudinal sample of children with disabilities; comparable graphs of results are presented in Figures 21-23. Sample sizes for children with disabilities are much smaller (i.e., less than a third) than for typically developing children (see footnote a in each table for Ns), and within-group variability was substantially higher than for typically developing children because children with disabilities had a variety of different syndromes and limitations. This within-group variability increased as a function of the intervention conditions and length of exposure, presumably because some children with certain disabilities were more limited in their ability to improve developmentally. Despite these circumstances, which had their effects primarily on significance levels, the graphical results are generally similar to those for typically developing children, and the effect sizes, especially for the multivariate analyses of the longitudinal sample, are substantially larger for children with disabilities.
TABLE 7.
Fs, Significance Levels, Effect Sizes (η2) for Battelle Developmental Inventory DQs as a Function of Intervention Condition (T+SC, TO, NoI) and Length of Exposure (4−9, 9+ Months) for the Cross-Sectional Sample of Children With Disabilitiesa
| MANCOVA | Total | Personal-Social | Fine Motor | Gross Motor | Adaptative | Communication | Cognition | |
|---|---|---|---|---|---|---|---|---|
| Intervention main effectb | ||||||||
| 3 BHs | 1.05 (.08) | 3.15* (.09)f | 5.10** (.13) | 6.05** (.16) | 3.03* (.08) | 5.14** (.14) | 3.32* (.09) | 2.60† (.07) |
| T+SC > NoI | 2.27 (.03) | 2.99† (.04) | 9.90** (.13) | 2.17 (.03) | 3.41† (.05) | 3.06† (.04) | 1.98 (.03) | |
| T+SC > TO | 5.07* (.08) | 9.48** (.13) | 5.45* (.08) | 5.48* (.08) | 9.24 (.12) | 5.39† (.08) | 4.60* (.07) | |
| TO > NoI | − 0.44 (.01) | − 1.04 (.02) | 0.59 (.01) | − 0.47 (.01) | − 0.69 (.01) | − 0.16 (.00) | − 0.29 (.00) | |
| Intervention at 4−9 monthsc | ||||||||
| 3 BHs | 1.17 (.09) | 0.77 (.02) | 2.32 (.07) | 1.55 (.05) | 0.60 (.02) | 1.43 (.04) | 0.99 (.03) | 0.85 (.03) |
| T+SC > NoI | − 0.07 (.00) | − 0.03 (.00) | 2.23 (.03) | 0.12 (.00) | 0.23 (.00) | − 0.05 (.00) | 0.02 (.00) | |
| T+SC > TO | 1.14 (.02) | 4.04* (.06) | 1.69 (.03) | 1.21 (.02) | 2.85† (.04) | 1.61 (.02) | 1.63 (.02) | |
| TO > NoI | − 1.20 (.02) | − 2.99† (.04) | 0.07 (.00) | − 0.35 (.01) | − 0.79 (.01) | − 1.43 (.02) | − 0.78 (.01) | |
| Intervention at 9+ monthsd | ||||||||
| 3 BHs | 1.24 (.09) | 7.73*** (.19) | 8.30*** (.20) | 7.54*** (.19) | 4.64** (.12) | 6.23** (.16) | 8.43*** (.20) | 4.09* (.11) |
| T+SC > NoI | 12.55*** (.16) | 14.55*** (.18) | 13.60*** (.17) | 5.30* (.07) | 8.32** (.11) | 15.55*** (.19) | 6.72** (.09) | |
| T+SC > TO | 7.60** (.10) | 6.67** (.09) | 5.48* (.08) | 6.97** (.10) | 8.43** (.11) | 5.51* (.08) | 3.92* (.06) | |
| TO > NoI | 0.33 (.01) | − 0.91 (.01) | 1.22 (.02) | − 0.11 (.00) | − 0.01 (.00) | 1.61 (.02) | 0.20 (.00) | |
| Exposuree | ||||||||
| 3 BHs × Exposure | 1.30 (.10) | 1.85 (.05) | 2.37† (.07) | 0.12 (.00) | 0.33 (.01) | 0.51 (.02) | 2.29 (.07) | 0.68 (.02) |
| T+SC | 0.83 (.06) | − 0.02 (.00) | − 0.84 (.01) | 0.02 (.00) | − 0.18 (.00) | − 2.75 (.04) | − 0.31 (.01) | − 1.85 (.03) |
| TO | 0.84 (.06) | − 0.68 (.01) | − 0.11 (.00) | − 0.01 (.00) | − 0.79 (.01) | − 1.98 (.03) | − 0.44 (.01) | − 1.04 (.02) |
| NoI | 2.43* (.16) | − 5.94* (.08) | − 8.94** (.12) | − 0.23 (.00) | − 1.64 (.02) | − 5.25* (.07) | − 8.26** (.11) | − 5.15* (.07) |
| T+SC > NoI | 3.71† (.05) | 3.98* (.06) | 0.24 (.00) | 0.62 (.01) | 1.00 (.02) | 4.42* (.06) | 1.25 (.02) | |
| T+SC > TO | 0.35 (.01) | 0.07 (.00) | 0.03 (.00) | 0.20 (.00) | 0.03 (.00) | 0.04 (.00) | 0.00 (.00) | |
| TO > NoI | 1.49 (.02) | 3.82* (.06) | 0.09 (.00) | 0.12 (.00) | 0.51 (.01) | 2.71† (.04) | 0.95 (.01) |
Note.
T+SC Ns = 11,28; TO Ns = 6, 12; NoI Ns = 4,14.
b–f Same as in Table 5 except gender is omitted as a factor in the analyses of variance because of small Ns.
TABLE 8.
Fs, Significance Levels, Effect Sizes (η2) for Battelle Developmental Inventory DQs as a Function of Intervention Condition (T+SC, TO, NoI) and Length of Exposure (4−9, 9+ Months) for the Longitudinal Sample of Children With Disabiltiesa
| MANCOVA | Total | Personal-Social | Fine Motor | Gross Motor | Adaptative | Communication | Cognition | |
|---|---|---|---|---|---|---|---|---|
| Intervention × Exposureb | 2.58*** (.20)g | 5.20** (.21) | 4.75** (.20) | 3.20* (.14) | 4.91** (.20) | 11.32*** (.37) | 2.81* (.13) | 1.65 (.08) |
| Intervention Main Effectc | ||||||||
| 3 BHs | 4.73*** (.73) | 6.26** (.26) | 3.48* (.16) | 8.01*** (.31) | 3.86* (.18) | 9.79*** (.35) | 9.77*** (.35) | 3.11† (.15) |
| T+SC > NoI | 11.25** (.24) | 6.76** (.16) | 14.55*** (.29) | 4.62* (.11) | 15.81*** (.31) | 19.20*** (.35) | 4.43* (.11) | |
| T+SC > TO | 4.93* (.12) | 1.71 (.05) | 6.04* (.14) | 5.66* (.14) | 10.69** (.23) | 4.31* (.11) | 3.97* (.10) | |
| TO > NoI | 0.76 (.02) | 1.06 (.03) | 1.06 (.03) | − 0.03 (.00) | − 0.45 (.01) | 3.46† (.09) | 0.00 (.00) | |
| Intervention at 4−9 monthsd | ||||||||
| 3 BHs | 1.88* (.44) | 2.13 (.10) | 0.24 (.01) | 3.01† (.13) | 2.42† (.11) | 4.71* (.19) | 3.23* (.14) | 1.49 (.07) |
| T+SC > NoI | 2.47 (.06) | 0.22 (.01) | 4.67* (.11) | .76 (.02) | 4.56* (.11) | 5.48* (.12) | 1.45 (.04) | |
| T+SC > TO | 3.12† (.07) | 0.41 (.01) | 3.16† (.08) | 4.79* (.11) | 7.62** (.16) | 2.79† (.07) | 2.41 (.06) | |
| TO > NoI | 0.03 (.00) | 0.02 (.00) | 0.11 (.00) | − 1.26 (.03) | − 0.29 (.01) | 0.33 (.01) | − 0.09 (.00) | |
| Intervention at 9+ monthse | ||||||||
| 3 BHs | 1.92* (.44) | 3.13* (.14) | 4.26* (.18) | 2.56† (.12) | 2.25 (.10) | 4.17* (.18) | 3.91* (.17) | 2.17 (.10) |
| T+SC > NoI | 4.74* (.11) | 7.02** (.15) | 4.20* (.10) | 1.55 (.04) | 5.03* (.11) | 6.96** (.15) | 3.25† (.08) | |
| T+SC > TO | 3.43† (.08) | 3.96* (.09) | 2.41 (.06) | 4.08* (.10) | 5.90* (.11) | 2.89† (.07) | 2.43 (.06) | |
| TO > NoI | 0.08 (.00) | 0.32 (.01) | 0.18 (.01) | − 0.44 (.01) | − 0.03 (.00) | 0.64 (.02) | 0.04 (.00) | |
| Exposuref | ||||||||
| 3 BHs × Exposure | 1.22 (.32) | 1.99 (.09) | 5.87** (.23) | 0.72 (.04) | 0.83 (.04) | 0.28 (.01) | 0.33 (.02) | 0.61 (.03) |
| T+SC | 5.64*** (.50) | 0.87 (.02) | 6.72* (.15) | 5.25* (.12) | 2.67 (.06) | − 10.84** (.22) | 0.01 (.00) | − 0.58 (.02) |
| TO | 0.86 (.13) | − 0.41 (.01) | − 0.66 (.02) | 0.44 (.01) | 0.03 (.00) | − 1.92 (.05) | − 0.27 (.01) | − 0.36 (.01) |
| NoI | 1.71 (.23) | −2.93† (.07) | − 4.54* (.10) | 0.03 (.00) | − 0.14 (.00) | −5.16* (.12) | − 1.09 (.03) | 3.25† (.08) |
| T+SC > NoI | 3.76† (.09) | 10.35** (.21) | 1.27 (.03) | 1.51 (.04) | 0.00 (.00) | 0.65 (.02) | 1.14 (.03) | |
| T+SC > TO | 1.11 (.03) | 4.51* (.10) | 0.54 (.01) | 0.59 (.02) | 0.48 (.01) | 0.14 (.00) | 0.01 (.00) | |
| TO > NoI | 0.57 (.01) | 0.87 (.02) | 0.11 (.00) | 0.16 (.00) | 0.39 (.01) | 0.14 (.00) | 0.72 (.02) | |
Note.
T+SC N = 22, TO N = 10, NoI N = 10.
b-g Same as in Table 6 except gender is omitted as a factor in the analyses of variance because of small N.
Figure 21.

Top—Battelle Total DQ adjusted for initial score, age, and FAI at initial assessment for the cross-sectional sample of children with disabilities in T+SC, TO, and NoI as a function of length of exposure. Bottom—Battelle Total DQ for the longitudinal sample of children with disabilities in T+SC, TO, and NoI as a function of length of exposure.
Figure 23.

Left—Adaptive, Communication, and Cognition subscale DQs adjusted for initial score and age and FAI at initial assessment for the cross-sectional sample of children with disabilities in T+SC, TO, and NoI as a function of length of exposure. Right—Adaptive, Communication, and Cognition Subscale DQs for the longitudinal sample of children with disabilities in T+SC, TO, and NoI as a function of length of exposure.
Intervention Main Effects
Cross-sectional sample
For the cross-sectional sample of children with disabilities (Table 7), the multivariate analysis of covariance on the differences between intervention conditions across exposure levels was not significant, but the univariate tests of this effect were significant for Total Score and each of the six subscales (Cognition was marginally significant). This odd combination of results suggests that differences occurred similarly in all Subscales making the multivariate test over-determined for the number of dependent variables and small N. As can be seen at the left of Figures 21-23, there was a tendency for children in T+SC to have higher developmental scores than children in NoI or TO, but this was more likely the case at 9+ months of exposure. In no case was TO greater than NoI.
Longitudinal sample
For the longitudinal sample of children with disabilities, differences between the intervention conditions were more consistently statistically significant. Specifically, the interaction between intervention and exposure when initial, 4−9, and 9+ months levels were included was significant for the multivariate and all univariate tests except Cognition. When initial scores were used as a covariate to equate intervention conditions on initial levels, the three intervention conditions were significantly different for the multivariate and all univariate tests (cognition was marginally significant). T+SC children scored better than NoI and better than TO on all comparisons (except T+SC was not significantly greater than TO on Personal–Social). T+SC scores are higher than the other two conditions in Figures 21-23, again especially at 9+ months exposure for some variables.
Effect sizes
Effect sizes tended to be larger for children with disabilities than for typically developing children. For example, the longitudinal multivariate comparison between the three intervention conditions over exposure levels produced an effect size of .73 (compared with .45 for typically developing children). Effect sizes for the Total Score were roughly similar for the two groups, whereas effect sizes were somewhat larger for children with disabilities for Gross Motor, Adaptation, and Communication but smaller for Personal–Social.
Intervention × Exposure
Cross-sectional sample
For the cross-sectional sample (Table 7), there was scant evidence for a dose–response effect for any comparison. The Intervention (3 BHs) × Exposure tests were not significant (the marginal significance for the Personal–Social interaction more likely reflects the substantial decline in the NoI condition), and neither the T+SC nor TO groups showed significant differences between the 9+ versus the 4−9 months of exposure.
However, while the exposure effect for typically developing children was likely to reflect higher developmental status as a function of longer exposures to the intervention, longer exposure minimized the decline of T+SC children with disabilities whereas NoI children especially declined with longer stays in the BH. More specifically, the NoI condition showed significant declines in the multivariate test as well as the univariate tests for Total Score, Personal–Social, Adaptation, Communication, and Cognition, whereas neither the T+SC nor the TO group showed such declines. This can be seen at the top of Figure 21 and at the left of Figures 22 and 23. Moreover, the pairwise interaction comparing the exposure trend for T+SC vs. NoI was marginally significant for Total Score and significant for Personal–Social and Communication, and TO declined less with 9+ months exposure than NoI for Personal–Social and marginally for Communication. Thus, while the evidence is not totally consistent, the pattern of results supports the proposition that for children with disabilities the longer exposures to the interventions prevented decline in DQs.
Figure 22.

Left—Personal–Social, Fine Motor, and Gross Motor Subscale DQs adjusted for initial score and age and FAI at initial assessment for the cross-sectional sample of children with disabilities in T+SC, TO, and NoI as a function of length of exposure. Right—Personal–Social, Fine Motor, and Gross Motor subscale DQs adjusted for age and FAI at initial assessment for the longitudinal sample of children with disabilities in T+SC, TO, and NoI as a function of length of exposure.
This interpretation is supported by the specific comparisons between intervention groups performed separately at 4−9 months and at 9+ months of exposure. At 4−9 months, there was only 1 significant and 2 marginally significant comparisons (1 opposite to predictions) out of 29 statistical tests (Table 7). In contrast, at 9+ months, while the multivariate test of the difference between the three intervention conditions was not significant, every univariate test was significant and T+SC was greater than NoI and greater than TO for every univariate test in clear conformity with the intervention predictions.
Longitudinal sample
Results for the longitudinal sample of children with disabilities (Table 8) are generally similar to the cross-sectional results except T+SC is more likely to show a positive dose–response effect rather than simply maintain their level over exposure. Results for the three BH Intervention × Exposure tests were similar to those of the cross-sectional sample except T+SC now shows significant increases between 4−9 and 9+ months exposure on the multivariate, Personal–Social, and Fine Motor Subscales (see the right-hand graphs in Figures 21-23). Again, NoI tends to show significant declines with exposure to the orphanage for Personal–Social and Adaptation and marginally significant for Total Score and Cognition. The combination of these trends is reflected in significant differences between T+SC and NoI in the pattern of exposure for Personal–Social and marginally for Total Score.
The differences between intervention conditions within the two exposure conditions were similar, but less consistent statistically, to the cross-sectional sample. There was a significant difference between the three intervention conditions at both exposure levels for the multivariate test. Specifically, at 4−9 months exposure, T+SC was developmentally more advanced than NoI for Fine Motor, Adaptation, and Communication and marginally or significantly different than TO for Fine Motor, Gross Motor, Adaptation, and Communication. At 9+ months exposure, T+SC was better than NoI on all univariate tests except Gross Motor and significantly or marginally better than TO on all univariate tests except Fine Motor and Cognition. Again, as can be seen in the graphs and in the NoI line under exposure in Table 8, the longitudinal children with disabilities in the NoI condition tended to decline marginally or significantly with increased exposure to the orphanage for Total Score, Personal–Social, Adaptation, and Cognition. Thus, similar to the cross-sectional results, the interventions tended to prevent the decline that NoI children with disabilities displayed to increased exposure to the orphanage.
Children With Specific Disabilities
As noted above, variability was greater among children with disabilities than among typically developing children as might be expected by the variety of limitations imposed by different disabling conditions. However, it was also the case that variability increased substantially at 9+ months versus 4−9 months of exposure to the interventions. It was reasonable to hypothesize that children with certain more limiting disabilities might show less improvement than other children with milder disabilities the longer they were in the intervention. To lend support to this hypothesis, a few a posteriori comparisons of children with disabilities were conducted in the three intervention conditions.
Because the orphanages are operated by the Ministry of Health and because it is assumed that all children sent to the orphanages have some medical diagnoses (although such diagnoses can include nonspecific categories similar to “failure to thrive” or “minimum brain dysfunction”), the BH records contained a variety of perinatal circumstances and medical diagnoses (see St. Petersburg–USA Orphanage Research Team, 2005). The longitudinal children with disabilities in each of the 3 BHs were listed according to the amount of change in Total DQ from initial to their last 9+ months assessment and then whether the child had any of four perinatal conditions (low birth weight, use of artificial ventilation, low APGAR score at birth, low APGAR score at 10 min), the number of acute diagnoses, the number of chronic diagnoses, and 30 specific acute and chronic diagnostic syndromes.
The results of this admittedly post hoc analysis are presented in Table 9. First, children with disabilities in T+SC improved an average of 17.66 DQ points on the Battelle Total Score, whereas children in TO improved 1.16 and those in NoI declined 5.43 points. As presented in analyses above, not all children improved in DQ during their residence in the orphanages, and this varied with the intervention condition. While 82% of the T+SC children with disabilities improved, only 60% of TO and 30% of NoI children improved at all from their initial to their last assessment (9+ months). Two additional cut-offs were selected a posteriori to describe the difference between the three intervention groups. First, while 68% of the T+SC children improved more than 12 DQ points, only 10% of children in the other two groups did so; and while 32% of T+SC children improved more than 20 DQ points, no child in TO or NoI improved this much. Indeed, three T+SC children gained 30−40 points and three additional children gained 49−64 points.
TABLE 9.
Percentages of Longitudinal Children With Disabilities in the Three Intervention Conditions Who Improved in DQ
| Intervention Condition |
|||
|---|---|---|---|
| T+SC (N = 22) | TO (N = 10) | NoI (N = 10) | |
| Mean improvement (DQ points) | 17.66 | 1.16 | − 5.43 |
| Percent improved > 0 | 82% | 60% | 30% |
| Percent improved > 12 DQ | 68% | 10% | 10% |
| Percent improved > 20 DQ | 32% | 0% | 0% |
| Percent who had cerebral palsy, microcephaly, hydrocephaly | |||
| Who improved < 12 DQa | 71% | 67% | 56% |
| Who improved > 12 DQ | 7% | 0% | 0% |
Note.
Improved = Score at 9+ months exposure minus score at initial assessment.
Children who declined are not included.
Only three perinatal or diagnostic syndromes seemed to be related to relative improvement within intervention conditions. The most prominent was the diagnosis of cerebral palsy, which was often accompanied by microcephaly or hydrocephaly (all children with hydrocephaly and all but one child with microcephaly were also diagnosed with cerebral palsy). At the bottom of Table 9, one can see the percentage of children in each intervention condition who had any of these three diagnoses who improved less than or equal to 12 DQ points versus those who improved > 12 DQ points. Over all three BHs, between 56% and 71% of those children who improved <12 DQ points had one of these diagnoses, and only one child with these diagnoses (in T+SC) improved > 12 DQ points.
Therefore, the increased variability at 9+ months of exposure appears largely associated with children with both cerebral palsy and hydrocephaly or microcephaly who tended not to improve in any of the three Intervention conditions. Otherwise, the T+SC and to a lesser extent the TO intervention produced improvements—sometimes to dramatic extents—in most children with disabilities.
DISCUSSION
Typically Developing Children
With only minor variations in significance levels and even fewer exceptions for effect sizes, the results for typically developing children were consistent across cross-sectional and longitudinal samples in revealing that the double intervention (T+SC) produced rather substantial increases in developmental scores relative to both the training only (TO) and the no intervention (NoI) control groups for Battelle Total Score and all of the six subscales. The intervention effects in favor of T+SC were more substantial after 9+ months than after only 4−9 months of exposure, especially in terms of effect size, and this tendency was true for Total Score and most subscales, although more consistently in the cross-sectional than longitudinal sample. This dose–response effect suggests that the T+SC intervention provided continuing and likely changing developmentally appropriate support to children as they increased in age and skills.
It should be noted that for Total Score and some subscales, NoI children increased developmentally with longer exposure to the orphanage. The fact that most improvement occurred between the initial and the 4−9 months assessment on some subscales suggests the possibility that the orphanage environment was better from a developmental standpoint than the environment in which these children lived before entering the orphanage. The few instances in which TO and NoI children declined with additional exposure to the orphanage in the cross-sectional but not the longitudinal sample (for Adaptative and Cognition) presumably reflect selective attrition in which better developing children were adopted or returned to their parents before having 9+ months of exposure to the orphanage.
Children With Disabilities
Children with disabilities showed improvements as a function of the interventions similar to those of typically developing children. Because of much smaller Ns and increased variability, statistical significance was not as consistently obtained; but the graphic results, the pattern of statistically significant results, and effect sizes, especially for the multivariate tests which were larger for children with disabilities than for typically developing children, all converged on the same conclusions. It was also noted post hoc that children who did not improve very much in any of the three intervention conditions were likely to have diagnoses of cerebral palsy, hydrocephaly, and/or microcephaly, which presumably limited their ability to improve developmentally to a greater extent than other syndromes.
General Interpretations
As one might expect of a social–emotional-relationship intervention, the effects were clearest and tended to have larger effect sizes on the Personal–Social Subscale of the Battelle. However, also as anticipated, increased adult–child relationships mean more talking and potentially more cognitive stimulation, and improvements were also observed on the Communication and Cognition subscales. Improved relationships and more caregiver attention to fewer children may also be accompanied by increased motivation of children to interact with toys and gross and fine motor equipment as well as to comply with caregiver instructions. This suspicion is at least consistent with the observed improvements on the Fine Motor, Gross Motor, and Adaptation subscales.
Thus, a primarily social–emotional-relationship intervention produced improvements in all major spheres of behavioral development, although especially Personal–Social, and in T+SC more than TO more than NoI. Also, typically developing children improved more the longer they were exposed to the interventions, while longer exposures to the interventions seemed to prevent children with disabilities from declining in total DQ and on some subscales, which declines were evident for the NoI children.
Effect Sizes
Effect sizes varied with the statistical circumstance. Percent variance estimates were modest in the cross-sectional analyses for both typically developing children and those with disabilities. Presumably this is a consequence of the between-intervention nature of the statistical comparison and the substantial variability between children and between exposure conditions that was not embodied in the covariates. Effect sizes were larger in the longitudinal samples, with multivariate effect sizes for the main effect of Intervention across exposure levels to be .45 for typically developing children and .73 for children with disabilities, effect sizes usually considered to be substantial.
The size of the intervention effect can also be viewed in terms of the number of DQ points T+SC children improved. On average, typically developing children in the T+SC longitudinal sample improved from an average of 57 to an average of 91, or an average improvement of 46 DQ points versus 9 DQ points for NoI. Thus, on average, the T+SC intervention improved children without severe disabilities who developmentally were in the bottom 10% of noninstitutionalized U.S. children (at least in the 1980s) well into the range of typically developing children. For longitudinal children with disabilities, T+SC increased from an average of 23 to 41, or an average increase of 18 DQ points versus −5 for NoI, and 3 of 22 T+SC children gained 30−40 DQ points and an additional 3 improved 49−64 DQ points.
The double intervention (T+SC) produced substantially more developmental improvement in children in essentially every domain than the single intervention (TO). This would seem to reflect the context provided by the structural changes that promoted social–emotional relationships between caregivers and children. The establishment of Primary Caregivers, fewer caregivers working more days per week, smaller group sizes, and “family hour” are all associated with better child outcomes in the nonresidential early childhood care and education literature (see Chapter III). The literature on integrated groups of typical children and children with disabilities tends to show increased social–interaction and more advanced social skills especially for children with disabilities, and at least some studies show improvements for younger children or both younger and older children as a result of age integration (see Chapter III). Therefore, it is reasonable to assume that all the major aspects of structural changes could have contributed to creating a context in which it was easier for caregivers to implement their training in social–emotional-relationship skills which in turn led to children's developmental advancements in all major domains.
It should be noted that all intervention effects were observed after initial differences in scores for individuals as well as age of child and FAI were covaried. Thus, results were not associated with preexisting differences in BHs, which is a common concern in quasiexperimental studies. Further, the results occurred over and above individual differences in the age at which children began the intervention and their relative functional ability within the two broad groups of typically developing and children with disabilities.
X. EFFECTS OF THE INTERVENTIONS ON CAREGIVER–CHILD INTERACTIONS DURING FREE PLAY (PCERA)
A major goal of the interventions was to improve the quality of social–emotional-relationship interactions between caregivers and children. As a complement to the HOME Inventory, which assessed naturalistic caregiver behavior on the wards, the free play–separation–reunion procedure was a structured assessment to evaluate the social, emotional, and relationship behaviors of caregiver–child dyads. It was expected that children exposed to the interventions would become more social, display more positive affect and self-regulation, and behave in ways consistent with having a relationship with the caregiver; caregivers exposed to the interventions would display more positive social–emotional engagement, responsiveness, positive affect, and child-directed interactions; and the dyad would show more mutual engagement characteristic of more mature caregiver–child social interactions and relationships.
The procedure began with a 5-min caregiver–child free play episode, which was coded with the Parent–Child Emotional Relationship Assessment (PCERA; Clark, 1999). PCERA results are presented in this chapter; results from the entire free play–separation–reunion procedure coded with the Infant Affect Manual and attachment variables follow in Chapter XI.
VARIABLE REDUCTION
The 65 PCERA ratings were reduced to a more manageable number of variables. Although Clark (Clark, 1999; Clark, Hyde, Essex, & Klein, 1997) factor analyzed the PCERA separately within child, parent, and dyadic categories of ratings on a sample of U.S. parents and their home-reared 12-month children, it was not certain that those factor analyses would apply to (1) orphanage children covering the broader age range of approximately birth to 4 years, (2) orphanage caregivers rather than parents, or (3) assessments made under the unusual circumstance (for orphanage children and caregivers) of a single child being with a single caregiver. So factor analyses (i.e., principal components analyses with Varimax rotations) were conducted separately on the 28 child ratings, the 29 caregiver ratings, and the 8 dyadic ratings using a variety of samples from this project for the purpose of reducing the number of ratings to substantially fewer composite variables (i.e., the factors) and to determine that these composites displayed some generality and stability before and after the interventions were implemented.
Factor Analyses of Child Ratings
Samples
The 28 child ratings were examined on all typically developing children across all three BHs who had an initial assessment, whether it was during the baseline period or the child's initial assessment conducted within 2 weeks of arriving at the BHs once any interventions had been implemented. This was considered the primary sample for determining the factor structure and composite variables, which shall be called subscales. However, the factor analyses were also repeated on the initial scores of males versus females, children assessed after 4−9 versus 9+ months of exposure to the interventions or residence in the control Baby Home, and the initial assessment on children with disabilities to determine if the factor structure, and thus the subscales, remained relatively similar across these groups, which was necessary to establish that the same conceptual variable was represented by a factor under all these conditions. The obtained factor structure on the main sample was also compared with the factor structure of Clark's (1999) 12-month-old, U.S. parent-reared sample.
Missing Data
The first step using the main sample of initial assessments on 602 typically developing children was to determine whether any of the ratings needed to be eliminated from the factor analysis because of missing data. Six ratings were eliminated because 7−13% of the children were missing these ratings; ratings were not eliminated because of extreme distributions. Clark also omitted certain ratings, but they were not always the same ratings that were eliminated here.
Factor Results for Main Sample
Table 10 presents the factor loadings for the items on the first three factors. Perfect simple structure (i.e., each rating loads maximally on one factor and minimally on all the others) was not achieved. Items that loaded above .40 on more than one of the first three factors have the second loading given in parentheses under the other factor. Nevertheless, an item was considered to load on one and only one factor as determined by its highest loading.
TABLE 10.
Factor Loadings and Factor Structure for Child PCERA Ratings
| Factor Loadings |
Gender |
Exposure |
Initial Age |
||||||||||
|---|---|---|---|---|---|---|---|---|---|---|---|---|---|
| Rating Items | 1 | 2 | 3 | Initial, typical | Male | Female | 4−9 months | 9+ months | < 6 months | >6 months | Initial, disability | Clark | |
| Factor 1. Quality of Play, Alertness, Self-Regulation | |||||||||||||
| BAA45 | Quality of exploratory play | .80 | — | — | 1 | 1 | 1 | 2 | 2 | 1 | 1 | 2 | 2 |
| BAA46 | Attentional abilities | .78 | — | — | 1 | 1 | 1 | 2 | 2 | 1 | 1 | 2 | 2 |
| BAA47 | Robustness | .78 | — | — | 1 | 1 | 1 | 2 | 2 | 1 | 1 | 2 | 2 |
| BAA44 | Motoric competency/quality | .73 | — | — | 1 | 1 | 1 | 2 | 3 | 1 | 4 | 2 | 2 |
| BAA50 | Self-regulatory/organize capacities | .72 | — | — | 1 | 1 | 1 | 4 | 2 | 1 | 1 | 1 | 2 |
| BAA38 | Alertness, interest | .68 | (.52) | — | 1 | 1 | 1 | 4 | 2 | 1 | 1 | 2 | 2 |
| MA33 | Not apathetic, withdrawn, depressed | .62 | (.53) | — | 1 | 1 | 1 | 1 | 2 | 1 | 1 | 1 | 2 |
| AL53 | Not passive, lethargic | .58 | — | — | 1 | 1 | 1 | 2 | 2 | 1 | 1 | 4 | 0 |
| BAA40 | Social-behavioral child respond. | .55 | (.53) | — | 1 | 2 | 1 | 1 | 1 | 1 | 1 | 1 | 0 |
| MA34 | Not anxious, tense, fearful | .55 | — | — | 1 | 1 | 4 | 4 | 4 | 1 | 1 | 5 | 0 |
| Factor 2. Positive Affect, Social Initiative, Communication | |||||||||||||
| MA32 | Happy, pleasant, cheerful | — | .82 | — | 2 | 2 | 2 | 1 | 1 | 2 | 2 | 1 | 1 |
| MA30 | Expressed positive affect | — | .82 | — | 2 | 2 | 2 | 1 | 1 | 2 | 2 | 1 | 1 |
| BAA39 | Child initiates social-behavior | — | .73 | — | 2 | 2 | 2 | 1 | 1 | 2 | 2 | 1 | 1 |
| COMM55 | Visual contact | — | .72 | — | 2 | 2 | 2 | 1 | 1 | 2 | 2 | 1 | 1 |
| COMM56 | Communicative competence | (.44) | .65 | — | 2 | 2 | 2 | 1 | 1 | 2 | 1 | 1 | 1 |
| MA36 | Not sober, serious | (.45) | .60 | — | 2 | 2 | 2 | 1 | 1 | 1 | 2 | 1 | 1 |
| BAA41 | Does not avoid, resist | (.50) | .56 | — | 2 | 2 | 2 | 1 | 3 | 1 | 1 | 1 | 0 |
| Factor 3. Emotional Stability, Not Affectively Negative | |||||||||||||
| MA35 | Not irritable, angry | — | — | .82 | 3 | 3 | 3 | 3 | 3 | 3 | 3 | 3 | 3 |
| MA37 | Emotional stability | — | — | .76 | 3 | 3 | 3 | 3 | 3 | 3 | 3 | 3 | 3 |
| MA31 | Limited negative affect | — | — | .76 | 3 | 3 | 3 | 3 | 3 | 3 | 3 | 3 | 3 |
Three factors that were defined by at least three ratings were retained, which accounted for 40.5%, 9.9%, and 6.7% of the total variance, respectively. The first factor consisted of 10 ratings that collectively reflected the Quality of Play, Alertness, and Self-Regulation of the child. The second factor consisted of seven ratings that represented Positive Affect, Social Initiative, and Communication, and the third factor consisted of three ratings that were labeled Emotional Stability, Not Affectively Negative. Note that some items on the PCERA are phrased in positive terms (e.g., “happy, pleasant, cheerful”) while others are phrased in negative terms (e.g., “apathetic, withdrawn, depressed”), but coders scored both these kinds of items on a scale of 1−5 in which 1 was considered an area of extreme concern while a 5 was an area of substantial strength. Consequently, items phrased negatively on the original PCERA will be labeled here as the absence of the negative behavior (e.g., “not apathetic, withdrawn, depressed”) to make interpretation of the factors more consistent.
Factor Results Across Samples
The general factor structure for the child ratings was remarkably consistent across a variety of samples and conditions and consistent with Clark's (1999) factor analysis of U.S. parents and their home-reared, 12-month children. The right side of Table 10 simply indicates for different samples whether each rating loaded maximally on the first, second, third, fourth, or fifth factor extracted in that analysis. Because it was not important whether one factor accounted for more variance than another, the particular numbers representing different factors in Table 10 are not important; what is of interest is that the items within the main factor analysis (at the left of the table) load on the same factor, whatever number it is, in the analyses of other samples presented at the right of the table. For example, items loading on the first factor in the primary analysis loaded on the same factor (except for 1 item each) in the factor analyses for males and for females, they all loaded on the same factor for children whose age at initial assessment was <6 months, all but one loaded on the same factor for children more than 6 months of age, and 7 of the 10 ratings constituted Clark's second factor of parent-reared 12-month children. As might be expected, children who had experienced 4−9 months or 9+ months of the intervention (including control children) showed somewhat less cohesiveness on this factor, although 5 of the 10 items at 4−9 months and 7 of the items at 9+months loaded on the same factor.
With respect to the second factor extracted in the main analysis, all ratings loaded on the same factor for males, females, 4−9 month exposed children, children with disabilities, and Clark's analysis; deviations for the other groups were modest. The third factor from the primary sample was replicated consistently in all samples.
These results show that the factor structure of child PCERA ratings is replicable (e.g., males vs. females), does not change much with the age of the child, and is quite similar to the factors extracted by Clark for U.S. parents and their home-reared 12-month children. Moreover, the factor structure does not change substantially even in samples that contain children who have experienced the interventions, indicating that the interventions themselves did not alter the cohesiveness of items on the factors, permitting them some conceptual integrity across conditions in this project.
Factor Analyses of Caregiver Ratings
Samples
The main sample for determining the factor structure for caregivers consisted of all caregiver assessments conducted during the baseline period of the study before any interventions were implemented. Additional samples included caregivers accompanying children who had experienced 4−9 or 9+ months of the intervention, although these samples are not totally independent, as well as Clark's analysis of U.S. parents of 12-month children. No items were eliminated because of missing data.
Factor Results
The results are presented in Table 11, which gives the factor loadings for three factors at the left (loadings in parentheses indicate when a rating also loaded ≥ .40 on one of the other factors) and the general factor structure for the main sample as well as the samples of caregivers with 4−9 and 9+ months of exposure and Clark's factors at the right.
TABLE 11.
Factor Loadings and Factor Structure for Caregiver PCERA Ratings
| Factor Loadings |
Child Exposure |
|||||||
|---|---|---|---|---|---|---|---|---|
| Ratings | 1 | 2 | 3 | Baseline, typical | 4−9 months | 9+ months | Clark | |
| Factor 1. Positive Social-Emotional Engagement | ||||||||
| TV2 | Not unemotional, flat | .82 | — | — | 1 | 2 | 3 | 1 |
| PCM7 | Not depressed, withdrawn, apathetic | .80 | — | — | 1 | 2 | 3 | 1 |
| PCM9 | Enthusiastic, animated | .76 | — | — | 1 | 2 | 1 | 0 |
| PA4 | Positive affect | .69 | — | — | 1 | 2 | 1 | 1 |
| PEATC12 | Enjoyment, pleasure | .66 | — | (.47) | 1 | 2 | 1 | 1 |
| PABI16 | Amount of verbalization | .64 | — | — | 1 | 2 | 1 | 1 |
| PS26 | Creativity, resourcefulness | .55 | — | — | 1 | 2 | 1 | 1 |
| TV3 | Warm, kind | .55 | — | (.41) | 1 | 2 | 1 | 0 |
| Factor 2. Responsiveness, Child-Directed | ||||||||
| PABI22 | Reads, responds to child's cues | — | .82 | — | 2 | 1 | 4 | 3 |
| PABI19 | Responds contingent to child's positive behavior | — | .76 | — | 2 | 1 | 1 | 0 |
| PABI21 | Structures/mediates environment | — | .72 | — | 2 | 1 | 4 | 1 |
| PABI23 | Connectedness | — | .62 | — | 2 | 1 | 3 | 0 |
| PABI15 | Amount of visual contact | — | .58 | — | 2 | 1 | 4 | 1 |
| PABI27 | Not intrusive | — | .55 | (.46) | 2 | 1 | 5 | 3 |
| PABI17 | Quality of verbalization | (.47) | .52 | — | 2 | 1 | 1 | 1 |
| PS25 | Flexibility | — | .48 | (.40) | 2 | 1 | 1 | 3 |
| Factor 3. No Negative Affect, Hostility | ||||||||
| PEATC11 | No displeasure disapproval | — | — | .78 | 3 | 3 | 2 | 2 |
| PA5 | No negative affect | — | — | .76 | 3 | 3 | 2 | 2 |
| TV1 | No apathy, hostility | — | — | .76 | 3 | 3 | 2 | 2 |
| PCM6 | No anger, hostility | .74 | 3 | 3 | 2 | 2 | ||
| PABI20 | No response contingent to negative behavior | — | — | .60 | 3 | 3 | 2 | 2 |
| PABI14 | No negative physical contact | — | — | .54 | 3 | 3 | 5 | 3 |
| PS28 | Consistency, predictability | — | (.40) | .48 | 3 | 3 | 2 | 3 |
The first factor was labeled Positive Social–Emotional Engagement (33% of the variance). All ratings loaded on the same factor for caregivers accompanying children after 4−9 months of orphanage residency, six of eight items loaded on the same factor for caregivers accompanying children with 9+ months of exposure, and six of the items were also on Clark's first factor. The second factor was called Responsiveness, Child-Directed (13% of the variance), and all eight items were also replicated on the 4−9 months sample but less consistently for the 9+ months sample and in Clark's analyses. The third factor reflected No Negative Affect, Hostility (6% of the variance), which meant that the absence of such behaviors received high scores. This factor was very similarly composed across all the samples.
Factor Analyses of Dyadic Ratings
Results of the factor analysis on the eight ratings of the adult–child dyad are presented in Table 12. In this case, only one factor (52% of the variance) was retained (other factors were defined by one item or by two to four items that loaded higher on the first factor). This factor was labeled Mutual, Positive, Reciprocal Engagement. Analyses of other samples within the current project produced the same one-factor result. Clark's analysis retained two factors for these eight items (see Table 12), with one item loaded on both factors.
TABLE 12.
Factor Loadings for Dyad PCERA Ratings
| Ratings | Factor loading | Initial, typical | Clark | |
|---|---|---|---|---|
| Factor 1. Mutual, Positive, Reciprocal Engagement | ||||
| MUT63 | Reciprocity | .86 | 1 | 1 |
| MUT64 | Organization, regulation of interactions | .81 | 1 | 2 |
| AQI59 | Not flat, empty, constricted | .78 | 1 | 1 |
| AQI61 | Enthusiasm, arousal, joy | .74 | 1 | 1 |
| MUT62 | Joint attention, activity | .74 | 1 | 2 |
| AQI60 | No tension, anxiety | .65 | 1 | 2 |
| MUT65 | State similarity | .64 | 1 | 1,2 |
| AQI 58 | No anger, hostility | .44 | 1 | 2 |
RELIABILITY OF SUBSCALES
The reliability procedures comparing one expert and four coders described in Chapter IV were applied to the unweighted subscale scores produced by the factor analyses described above. The median of the four correlations between the expert and each coder were .72, .70, and .71 for the three children's subscales; .73, .86, and .73 for the three caregiver subscales; and .76 for the dyadic subscale. The median for the six pair-wise comparisons between the four coders were .69, .57, and .55 for the children's subscales; .82, .85, and .69 for the caregiver subscales; and .78 for the dyadic subscale. The lower reliabilities for the children's subscales were produced primarily by one coder whose relations with the other three in these nonindependent pair-wise comparisons tended to be lower than the others; this coder subsequently received extra training.
The second round of reliabilities conducted two years into the project produced median reliabilities for expert–coder pairs of .85, .77, and .67 for the three children's subscales; and .62, .79, and .82 for the three caregiver subscales. These correlations among pairs of coders were .83, .78, and .59 for children's and .67, .76, and .78 for caregiver subscales.
Conclusion
The results of these factor analyses support the use of these factors, specifically the unweighted sum of scores on the items defining each factor, as composite variables or subscales, three of which represent the children's, three the caregivers’, and one the dyads’ social, emotional, and interaction behaviors in the unstructured caregiver–child free play session. Unweighted scores were used because of the general relative instability of loadings and because the loadings did not vary all that much within factors. These subscales were relatively consistent across different samples within the current project and were relatively consistent with Clark's factors on U.S. parents and their home-reared, 12-month children. Reliabilities for the subscales were acceptable, although modest.
All subsequent analyses will use these subscales, including analyses on children with disabilities. Children with disabilities are frequently compared with a standard established by typically developing children, and a factor analysis on the initial scores of children with disabilities produced remarkably similar factor structures.
INTERVENTION EFFECTS ON CHILDREN'S SUBSCALES
The three subscales of unweighted PCERA ratings on children were analyzed separately for the same four samples of children analyzed for the Battelle (Chapter IX)–cross-sectional and longitudinal samples of typically developing children and children with disabilities.
Statistical Analyses
The analyses were also the same as those for the Battelle Developmental Inventory, which adopted the strategy of conducting a variety of specific comparisons a priori (even if general analyses did not indicate significant effects) to test for several specific hypotheses (see Chapter IX).
Table 13 presents results for the intervention main effect when all three intervention conditions (T+SC, TO, NoI) are represented as well as the three pair-wise comparisons between intervention conditions, each of which were of a priori interest but not independent of each other. At the bottom of the table under exposure, the Intervention (3BHs) × Exposure interaction results (when initial score is added to the covariates) is presented when all three intervention conditions are analyzed, followed by the exposure effect tested separately within each intervention condition and then pair-wise comparisons for the Intervention × Exposure interaction. In the middle of the table, intervention comparisons are given separately within the 4−9 and then the 9+ months exposure assessments, which was done because the interventions may have an effect only after 9+ months of exposure.
TABLE 13.
FS, PS, η2s FOR PCERA CHILD SUBSCALES FOR CROSS-SECTIONAL AND LONGITUDINAL SAMPLES OF TYPICAL CHILDRENa
| Cross-sectional sample |
Longitudinal sample |
|||||||
|---|---|---|---|---|---|---|---|---|
| MANCOVA | Quality of Play, Alertness, Self-Regulation | Positive Affect, Social Initiative, Communication | Emotional Stability, Not Negative | MANCOVA | Quality of Play, Alertness, Self-Regulation | Positive Affect, Social Initiative, Communication | Emotional Stability, Not Negative | |
| Intervention × Exposureb | 1.28 (.05) | 0.30 (.00) | 0.76 (.01) | 0.91 (.01) | ||||
| Intervention main effectc | ||||||||
| 3 BHs | 9.45*** (.01) | 8.12*** (.04) | 24.99*** (.11) | 1.04 (.01) | 7.11** (.02) | 3.19* (.04) | 17.33*** (.20) | 0.59 (.01) |
| T+SC > NoI | 16.23*** (.04) | 45.01*** (.10) | 0.89 (.01) | 5.76* (.04) | 33.83*** (.20) | − 1.08 (.01) | ||
| T+SC > TO | 3.90* (.01) | 28.26*** (.07) | 2.02 (.01) | 0.32 (.00) | 14.87*** (.10) | − 0.62 (.00) | ||
| TO > NoI | 5.42* (.01) | 3.61† (.01) | 0.14 (.00) | 3.41† (.02) | 2.89† (.02) | − 0.04 (.00) | ||
| Intervention at 4−9 monthsd | ||||||||
| 3 BHs | 3.94*** (.03) | 4.36** (.02) | 10.48*** (.05) | 0.52 (.00) | 3.00** (.06) | 2.51† (.03 | 7.50*** (.10) | 0.59 (.01) |
| T+SC > NoI | 7.27** (.02) | 20.43** (.05) | − 0.91 (.00) | 4.51* (.03) | 14.99*** (.10) | − 1.03 (.01) | ||
| T+SC > TO | 6.18** (.01) | 9.52** (.02) | − 0.05 (.00) | 0.30 (.00) | 4.09* (.03) | − 0.05 (.00) | ||
| TO > NoI | 0.53 (.00) | 4.96 (.01) | − 0.77 (.00) | 2.23 (.02) | 2.58 (.02) | − 0.57 (.00) | ||
| Intervention at 9 + monthse | ||||||||
| 3 BHs | 7.37*** (.05) | 5.99** (.03) | 15.87*** (.07) | 1.50 (.01) | 4.88*** (.10) | 4.80*** (.06) | 10.87*** (.13) | 0.59 (.01) |
| T+SC > NoI | 10.23*** (.02) | 28.43*** (.07) | − 0.16 (.00) | 8.58** (.06) | 19.52*** (.12) | 0.01 (.00) | ||
| T+SC > TO | 0.25 (.00) | 18.68*** (.04) | − 2.75† (.01) | 0.53 (.00) | 13.21*** (.09) | − 0.76 (.01) | ||
| TO > NoI | 6.90** (.02) | 0.42 (.00) | 1.79 (.00) | 4.37* (.03) | 0.15 (.00) | 1.05 (.01) | ||
| Exposuref | ||||||||
| 3 BHs × Exposure | 2.06† (.02) | 1.31 (.01) | 1.09 (.01) | 1.45 (.01) | 0.71 (.02) | 0.30 (.00) | 0.76 (.01) | 91 (.01) |
| T+SC | 2.76* (.02) | 0.32 (.00) | 6.58** (.02) | 0.02 (.00) | 2.98* (.06) | 6.94** (.05) | 5.96* (.04) | 2.79† (.02) |
| TO | 2.60* (.02) | 5.80* (.01) | 0.55 (.00) | 3.35† (.01) | 2.79* (.06) | 5.90* (.04) | 0.43 (.00) | 4.77* (.03) |
| NoI | 1.89 (.01) | 0.05 (.00) | 4.97* (.01) | − 0.26 (.00) | 1.73 (.04) | 4.19* (.03) | 4.23* (.03) | 0.44 (.00) |
| T+SC > NoI | 0.07 (.00) | 0.14 (.00) | 0.20 (.00) | 0.54 (.00) | 0.33 (.00) | 0.75 (.01) | ||
| T+SC > TO | 1.42 (.00) | 1.93 (.00) | 1.29 (.00) | 0.03 (.00) | 1.51 (.01) | − 0.16 (00) | ||
| TO > NoI | 2.31 (.01) | 1.16 (.00) | 2.74† (.01) | 0.29 (.00) | − 0.60 (.00) | 1.66 (.01) | ||
Note.
Cross-sectional Ns: T+SC = 65,56; TO = 108,54; NoI = 61,81. Longitudinal Ns: T+SC = 43; TO = 42; NoI = 63.
b-fSame as in Table 8.
Results for Child Subscales
Typical Children
The statistical results for the child subscales for both the cross-sectional and longitudinal samples of typically developing children are presented in Table 13. Graphs of the results for typically developing children for two of the subscales are presented in Figure 24, with the results for the cross-sectional sample at the left and the longitudinal sample at the right. Note that the cross-sectional graphs are adjusted for covariates including initial score but longitudinal graphs are not because between-subjects covariates do not adjust within-subject means, although the statistical results in Table 13 are adjusted for between-subjects effects.
Figure 24.

Cross-sectional (left) and longitudinal (right) results for PCERA Children's Subscales 1 (top) and 2 (bottom) for typically developing children.
The statistical and graphical results are remarkably consistent across the cross-sectional and longitudinal samples in showing that the subscales for children differed as a function of intervention condition; these differences were confined to Subscale 1 (Quality of Play, Alertness, Self-Regulation) and Subscale 2 (Positive Affect, Social Initiative, Communication). There were no intervention effects for Subscale 3 (Emotional Stability, Not Affectively Negative). In addition, T+SC was significantly different from both the NoI and the TO intervention, whereas TO was only marginally and inconsistently better than NoI. As can be seen in the graphs, T+SC and TO showed substantially better Quality of Play, Alertness, and Self Regulation than the NoI condition, especially after 9+ months of exposure, although interactions with exposure were generally not significant. For Subscale 2 Positive Affect, Social Initiative, Communication, the intervention effect was largely confined to T+SC.
Although the graphs and the multivariate analyses showed some effect of exposure in which T+SC and TO had better scores after 9+ than after 4−9 months of exposure, these effects were not consistently significant within an intervention group nor was the exposure pattern different statistically for the three BHs or for pairs of BHs. Thus, evidence for a dose–response effect is only scattered and inconsistently observed, although intervention effects are clearer after 9+ months exposure.
Effect sizes were small to moderate for the cross-sectional sample, the largest percent variance estimates being .11 for the intervention main effect for Subscale 2. Effect sizes were larger for the longitudinal sample, for example .20 for the intervention main effect, again for Subscale 2.
Children With Disabilities
Comparable statistical analyses for children with disabilities are presented in Table 14 and graphic results are given in Figure 25.
TABLE 14.
FS, PS, η2S FOR PCERA CHILD SUBSCALES FOR CROSS-SECTIONAL AND LONGITUDINAL SAMPLES OF CHILDREN WITH DISABILILTIESa
| Cross-sectional Sample |
Longitudinal Sample |
|||||||
|---|---|---|---|---|---|---|---|---|
| MANCOVA | Quality of Play, Alertness, Self- Regulation | Positive Affect, Social Initiative, Communication | Emotional Stability, Not Negative | MANCOVA | Quality of Play, Alertness, Self- Regulation | Positive Affect, Social Initiative, Communication | Emotional Stability, Not Negative | |
| Intervention × Exposureb | 1.78† (.36) | 1.72 (.13) | 3.35* (.22) | 1.54 (.11) | ||||
| Intervention main effectc | ||||||||
| 3 BHs | 1.43 (.07) | .32 (.01) | 1.43 (.04) | 1.43 (.05) | 1.16 (.04 ) | 0.06 (.01) | 2.10 (.17) | 0.12 (.01) |
| T+SC > NoI | .00 (.00) | 1.94 (.03) | −0.07 (.00) | 0.12 (.00) | 0.47 (.01) | − 0.24 (.00) | ||
| T+SC > TO | .55 (.01) | −0.16 (.00) | −2.82† (.04) | 0.03 (.00) | 1.10 (.02) | − 0.08 (.00) | ||
| TO > NoI | .46 (.01) | 2.54 (.04) | 1.73 (.03) | 0.02 (.00) | 4.15† (.06) | − 0.02 (.00) | ||
| Intervention at 4−9 monthsd | ||||||||
| 3 BHs | 0.72 (.03) | .37 (.01) | 0.11 (.00) | 0.38 (.01) | .51 (.07) | 0.02 (.00) | 0.49 (.04) | 0.87 (.07) |
| T+SC > NoI | .36 (.01) | 0.04 (.00) | 0.31 (.00) | 0.01 (.00) | −0.69 (.01) | 0.53 (.01) | ||
| T+SC > TO | .15 (.00) | −0.12 (.00) | −0.24 (.00) | 0.04 (.00) | 0.04 (.00) | 1.66 (.02) | ||
| TO > NoI | .72 (.01) | 0.22 (.00) | 0.73 (.01) | − 0.02 (.00) | 0.76 (.01) | − 0.37 (.01) | ||
| Intervention at 9 + monthse | ||||||||
| 3 BHs | 2.97** (.13) | .51 (.02) | 3.32* (.09) | 3.84* (.11) | 2.90* (.28) | 0.49 (.04) | 4.37* (.27) | 2.42 (.17) |
| T+SC > NoI | .75 (.01) | 5.32* (.07) | − 1.94 (.03) | 0.24 (.00) | 8.36* (.11) | − 1.84 (.03) | ||
| T+SC > TO | .59 (.01) | − 0.04 (.00) | −7.40** (.10) | 0.96 (.01) | 0.28 (.00) | − 4.49* (.06) | ||
| TO > NoI | .00 (.00) | 4.80* (.07) | 1.41 (.02) | − 0.27 (.00) | 3.68† (.05) | 0.77 (.01) | ||
| Exposuref | ||||||||
| 3 BHs × Exposure | 1.31 (.06) | .49 (.02) | 0.60 (.02) | 0.83 (.03) | 1.17 (.14) | 0.41 (.03) | 1.22 (.09) | 1.97 (.14) |
| T+SC | 1.26 (.06) | .13 (.00) | 1.31 (.02) | − 1.65 (.03) | 1.70 (.19) | 2.15 (.08) | 2.68 (.10) | − 1.70 (.07) |
| TO | 1.23 (.06) | .02 (.00) | 0.38 (.01) | 0.03 (.00) | 0.87 (.11) | 0.00 (.00) | 0.18 (.01) | 2.06 (.08) |
| NoI | 0.71 (.03) | − .82 (.01) | − 0.23 (.00) | 0.29 (.01) | 0.41 (.05) | 0.43 (.02) | 0.42 (.02) | 0.18 (.01) |
| T+SC > NoI | − .93 (.01) | − 1.16 (.02) | 1.44 (.02) | 0.22 (.01) | 2.43 (.09) | −3.71† (.13) | ||
| T+SC > TO | − .01 (.00) | − 0.03 (.00) | 0.63 (.01) | 0.80 (.03) | 0.36 (.01) | − 1.37 (.05) | ||
| TO > NoI | −.56 (.01) | −0.63 (.01) | 0.04 (.00) | − 0.10 (.01) | 0.55 (.02) | 0.72 (.03) | ||
Note.
Cross-sectional Ns: T+SC = 11, 27; TO = 6,12; NoI = 5, 13. Longitudinal Ns: T+SC = 12; TO = 6; NoI = 9.
b-fSame as in Table 8.
Figure 25.

Cross-sectional (left) and longitudinal (right) results for PCERA Children's Subscales 1 (top) and 2 (bottom) for children with disabilities.
The statistical results for children with disabilities are substantially weaker. Nevertheless, a certain pattern does emerge, although it is sometimes different than for typically developing children. Consistent with the finding for typically developing children that effects are more likely to be seen after 9+ than after only 4−9 months of exposure, statistically significant effects for children with disabilities are only observed after 9+ months. Similar to typically developing children, T+SC children with disabilities have higher means on Subscale 2 (Positive Affect, Social Initiative, and Communication) after 9+ months of exposure than the NoI children, but in the case of children with disabilities so does the TO group. Although the graphs show T+SC scoring higher on Subscale 1 (Quality of Play, Alertness, Self-Regulation), especially after 9+ months, these differences were not statistically significant. In contrast to typically developing children who showed no effects on Subscale 3 (Emotional Stability, Not Affectively Negative), there was a tendency for TO children with disabilities to score higher than the other groups (i.e., less negatively), especially than T+SC at 9+ months of exposure.
Although statistically significant effects were infrequent because of the small Ns, effect sizes were as big or bigger for children with disabilities than for typically developing children in the longitudinal sample. For example, the multivariate test of the 3 BH Intervention × Exposure interaction had an η2 of .36 and of .28 specifically at 9+ months of exposure.
Changes in Caregiver Behavior Over Time
To assess how the interventions may have changed caregiver behavior, we sampled caregiver assessments as a function of when they were made relative to the implementation of the interventions.
Samples
A quasi-cross-sectional sample was created consisting of all caregiver assessments available at each of four time points: Baseline (i.e., before the initiation of any interventions); Postintervention First Year (PI-1), which included all assessments made within a year after the completed implementation of an intervention; Postintervention Second Year (PI-2), which included all assessments made between 1 and 2 years following intervention completion; and Postintervention Third Year (PI-3), which included all assessments made between 2 and 3 years after the interventions were completely implemented. Caregivers could have assessments in more than one time interval, but only one assessment within a time interval (if more than one was available, the last one was selected). Caregivers could accompany both typically developing children and children with disabilities, and it was important to see whether they behaved differently over time with these two groups of children. Thus, typical/disability was added as an independent factor to the analyses of variance to determine whether there were interactions with the children's developmental status.
These results reflected a snapshot of the caregivers in an intervention condition at any one of four time intervals before and after the interventions were implemented. There was no meaningful longitudinal sample. The time periods were regarded statistically as independent samples, even though this assumption was violated. Consequently, these probabilities are only suggestive and only the major results will be interpreted.
Results
The results for the three caregiver subscales for the quasi-cross-sectional sample of caregivers accompanying children who were both typically developing and had disabilities are presented in Figure 26. The multivariate Intervention × Time interaction was significant, F(18, 6967) = 6.39, p<.001; and this interaction was significant in univariate tests for each of the three caregiver subscales—Subscale 1: F(6, 2465) = 6.76, p<.001; Subscale 2: F(6, 2465) = 7.85, p<.001; Subscale 3: F(6, 2465) = 9.65, p<.001.
Figure 26.

Caregiver subscales for quasi-cross-sectional sample of caregivers in T+SC, TO, and NoI BHs as a function of pre- and postintervention time.
Separate analyses tested if these trends differed as a function of whether the child the caregiver accompanied was typically developing or had disabilities. The three-way interaction was significant in the multivariate case but not in univariate tests of each subscale. An examination of the graphs indicated that T+SC caregivers accompanying typically developing children and those with disabilities behaved very similarly (although scores were slightly higher at each time point for caregiver accompanying typically developing children). But while TO and NoI caregivers behaved differently across time as a function of whether the child was typically developing or had disabilities, these differences were not systematic and did not qualify the results presented in Figure 26.
Specifically (see Figure 26), for Subscale 1 (Positive Social–Emotional Engagement), caregivers in T+SC increased in the year after the intervention had been implemented and remained high, while caregivers in the other two conditions declined steadily over time. By 2+ years after the intervention was implemented (PI-3), T+SC was significantly greater than NoI and TO (ps<.001) but TO was not different from NoI.
With respect to Subscale 2 (Responsiveness, Child-Directed), caregivers in T+SC showed a consistently increasing trend across time, whereas TO and NoI did not change. T+SC was significantly different from both NoI and TO at PI-3.
For Subscale 3 (No Negative Affect, Hostility), both T+SC and TO improved over time whereas NoI declined; by PI-3, both T+SC (p<.001) and TO (p<.001) were higher than NoI (i.e., less negativism) but were not significantly different from each other.
INTERVENTION EFFECTS ON THE DYADIC SUBSCALE
Results
The statistical results are given in Table 15 and graphs are presented in Figure 27. The figure presents the results for cross-sectional (left) and longitudinal (right) samples of typically developing children (top) and children with disabilities (bottom).
TABLE 15.
Fs, ps, η2s for PCERA Dyad Subscale (Mutual, Positive, Reciprocal Engagement) for Quasi-Cross-Sectional and Quasi-Longitudinal Samples of Typical Children and Children With Disabilitiesa
| Typical Children |
Children With Disabilities |
|||
|---|---|---|---|---|
| Cross-sectional | Longitudinal | Cross-sectional | Longitudinal | |
| Intervention × Exposureb | 2.11† | 3.34* (.22) | ||
| Intervention main effectc | ||||
| 3 BHs | 19.42*** (.09) | 7.16*** (.09) | 0.95 (.03) | 1.10 (.09) |
| T+SC > NoI | 36.04*** (.08) | 14.24*** (.18) | 1.49 (.02) | 0.25 (.00) |
| T+SC > TO | 20.45*** (.05) | 5.80* (.08) | −0.03 (.00) | 0.65 (.01) |
| TO > NoI | 3.74† (.01) | 1.67 (.02) | 1.49 (.02) | 2.19 (.03) |
| Intervention at 4−9 monthsd | ||||
| 3 BHs | 10.10*** (.05) | 2.27 (.03) | 0.00 (.00) | 0.16 (.01) |
| T+SC > NoI | 17.78*** (.04) | 4.47* (.06) | 0.00 (.00) | 0.00 (.00) |
| T+SC > TO | 13.09*** (.03) | 1.85 (.03) | − 0.00 (.00) | 0.30 (.00) |
| TO > NoI | 1.92 (.00) | 0.36 (.01) | 0.00 (.00) | −0.22 (.00) |
| Intervention at 9+ monthse | ||||
| 3 BHs | 10.63*** (.05) | 9.94*** (.12) | 3.13* (.09) | 4.98* (.29) |
| T+SC > NoI | 20.97*** (.05) | 19.82*** (.23) | 5.00* (.07) | 6.83* (.09) |
| T+SC > TO | 8.37** (.02) | 6.76** (.09) | −0.04 (.00) | −0.42 (.01) |
| TO > NoI | 2.15 (.01) | 2.40 (.04) | 4.67* (.07) | 7.85** (.11) |
| Exposuref | ||||
| 3 BHs × Exposure | 0.01 (.00) | 1.40 (.02) | 0.88 (.03) | 2.44 (.17) |
| T+SC | 0.63 (.00) | 6.77** (.05) | 1.19 (.02) | 1.76 (.07) |
| TO | 0.83 (.00) | 1.70 (.01) | 0.75 (.01) | 3.75† (.14) |
| NoI | 0.46 (.00) | 0.28 (.00) | 0.51 (.01) | −0.92 (.04) |
| T+SC > NoI | 0.01 (.00 | 2.79† (.02) | −1.48 (.02) | 2.54 (.10) |
| T+SC > TO | 0.00 (.00) | 0.77 (.01) | 0.01 (.00) | −0.66 (.03) |
| TO > NoI | 0.02 (.00) | 0.47 (.00) | 1.29 (.02) | 4.44* (.16) |
Figure 27.

PCERA caregiver–child dyadic subscale scores for cross-sectional (left) and longitudinal (right) samples of typically developing children (top) and children with disabilities (bottom).
Typical Children
The statistical and graphical results for typically developing children are notably consistent across cross-sectional and longitudinal samples. The test of the main effect of the interventions was significant across exposure levels in both samples and significant specifically at 9+ months for both samples. The intervention main effect was also significant at 4−9 months in the cross-sectional sample but not in the longitudinal sample, although the graphs are very similar. In each case, T+SC has higher scores than NoI and higher scores than TO (except in the longitudinal sample at 4−9 months), and TO is better than NoI in the overall analysis for the cross-sectional but not for the longitudinal sample and not separately within each exposure level. While T+SC increases with exposure in the longitudinal sample, this was not replicated in the cross-sectional results. Thus the T+SC produced a greater amount of mutual, positive, reciprocal engagement between caregivers and children in the free-play session than either the TO or NoI groups.
Children With Disabilities
Both the T+SC and the TO groups had higher scores than NoI, but only at 9+ months of exposure. Both groups were separately better than NoI and did not differ from one another. Although graphically both T+SC and TO groups increased from 4−9 to 9+ months exposure, the Intervention × Exposure interactions were not significant (although no intervention effects were significant at 4−9 months but several were at 9+ months).
DISCUSSION
As expected, the T+SC intervention produced more positive social behavior in children, caregivers, and the caregiver–child dyad as observed in a caregiver–child free play session. The benefits of T+SC were visible at both 4−9 and 9+ months of exposure, but effects for T+SC children with disabilities occurred only after 9 months of exposure. T+SC children and caregivers tended to show more positive social behavior than TO, although TO caregivers and children occasionally displayed levels similar to T+SC on some measures.
Children
More specifically, typically developing children in T+SC and TO showed better quality of play, alertness, and self-regulation and T+SC children also displayed more positive affect, social initiative, and communication than TO and NoI children, but there were no differences in emotional stability and affectively negative behavior. These effects occurred after 4−9 as well as 9+ months of exposure. Children with disabilities showed statistically significant differences only after 9+ months of exposure and for positive affect, social initiative, and communication. Despite the fact that differences were sometimes larger after 9+ months, there was no statistically consistent dose–response effect.
Caregivers
T+SC caregivers displayed higher levels and an increasing pattern of positive social–emotional engagement and more responsiveness and child-directed behavior whereas TO and NoI caregivers declined or did not change over time. Caregivers in both T+SC and TO intervention groups displayed progressively less negative affect and hostility than NoI caregivers, significantly so by 2+ years following the completion of the intervention. TO caregivers limited their negative affect throughout the course of the study.
Dyads
The T+SC intervention produced more mutual, positive, reciprocal engagement in caregiver–child dyads than either the TO or NoI groups for typically developing children; both T+SC and TO were better than NoI after 9+ months of exposure for children with disabilities.
Caregivers and children in TO performed more similarly to those of T+SC on some of these social–emotional subscales than on the Battelle, especially TO children with disabilities. Speculatively, it is possible that caregivers in both training interventions knew the behavior expected of them and that increased stimulation, even by many and changing caregivers (i.e., TO), could improve children's quality of play, alertness, and self-regulation, either generally or within a single, semistructured dyadic observation. In contrast, an improved relationship with a specific caregiver (T+SC) may be needed to produce more positive affect, emotional stability, and communication in children, again generally or even in a single observation. TO Special Teachers were more experienced and had fewer children with disabilities than T+SC, so they may have been able to improve these children as well as T+SC caregivers, at least in these PCERA ratings.
XI. INTERVENTION EFFECTS ON CAREGIVER–CHILD INTERACTIONS (INFANT AFFECT MANUAL, ATTACHMENT VARIABLES)
Because the interventions emphasized promoting caregiver–child relationships, it was important to assess signs of such relationships more directly. The free play–separation–reunion procedure provided an opportunity to assess caregiver–child social–emotional interaction as well as attachment variables. The behavior displayed during this procedure was coded with the Infant Affect Manual (IAM) and separately with attachment categorizations, behavior ratings, and attachment dimensions.
IAM RATINGS
IAM (Osofsky et al., 1988, 1998) ratings were made on children and caregivers during all episodes of the free play–separation–reunion procedure.
Variables
Ratings were made every 30 s during the 3-min episodes (only the first 3 min of the free-play episode was coded to be consistent with the other episodes), and the highest rating for the six 30-s segments constituted the score for each rating.
Child Composites
As described in Chapter IV, the 13 child ratings were combined into five a priori defined composites: Positive Emotional Tone (the sum of the highest ratings observed for joy/enjoy, interest, excitement, and surprise), Negative Emotional Tone (the sum of the highest ratings for distress, sadness, anger, and fear), the Number of Different Emotions (the number of nonzeros for the eight ratings comprising positive and negative emotional tone), Passivity–Activity (the sum of the highest ratings for manipulative passivity–activity and gross motor passivity–activity), and Disruptive Activity (the sum of the highest ratings for stereotypic movements, aggression to object, and aggression to people). Scores on these five child measures were obtained separately for three episodes—free play, the average of the two separations, and the average of the two reunions.
Caregiver Composites
Similarly, three composite caregiver variables were created: Positive Emotional Tone, Negative Emotional Tone, and the Number of Different Emotions, each composed of the sum of the highest ratings for the same emotions as described above for the child ratings. Because the caregiver was present only during free play and the two reunions, these constituted the two episodes for caregivers.
Analyses of Children's Ratings
Samples
The samples of the children for the IAM ratings were essentially the same as those for the Parent–Child Early Relational Assessment (PCERA) ratings (Chapter X), namely two cross-sectional and two longitudinal samples, one each for typically developing children and one each for children with disabilities.
Statistical Analyses on Children's Ratings
The statistical analyses were similar to those conducted on the PCERA except that the IAM ratings were made for each of three episodes (free play, separations, reunions), which was added as a repeated factor in the analyses.
General analyses
The general analyses for the cross-sectional samples consisted of an Intervention (T+SC, TO, NoI) × Exposure (4−9, 9+ months) × Episode (Free Play, Separations, Reunions) × Initial Age (≤6, >6 months) × Gender ANCOVA with fixed covariates of age and the Functional Abilities Index both assessed at initial assessment and with varying covariates of the dependent variable assessed at the initial assessment for each episode, respectively. The latter covariate essentially equates the intervention groups on the children's behavior on their initial assessment within each episode. Separate analyses were conducted on each of the five composite ratings.
The general analyses for the longitudinal samples were similar, except that gender was not included because of the smaller Ns.
Specific analyses
Several more specific a priori analyses were conducted for each sample regardless of the results of the overall analyses, guided by several hypotheses specific to caregiver–child relationships.
First, it was possible that at least 9 months of exposure would be more likely necessary to produce differential social–emotional behavior in children in the free play–separation–reunion procedure than it would to produce effects for general development. Presumably, the fact that all the T+SC caregivers talked and socially stimulated children could have an effect on children's general development rather quickly, because such stimulation does not necessarily require a relationship between the child and a specific caregiver. In contrast, a relationship with a specific caregiver would seem to be required for differential behavior in the free play–separation–reunion procedure, and developing such a relationship might take >4–9 months. Also, T+SC children still had an average of six caregivers per month and Baby Home (BH) children are accustomed to caregivers coming and going, so separations are not unusual events for them, which might minimize group differences especially on separations.
Second, in parent-reared children, relationships between children and parents develop in the first year and the child displays corresponding behavior in the traditional Strange Situation Procedure between approximately 11 and 18 months of age. Therefore, effects might be weaker in children who experienced the intervention and were assessed predominately in their first year of life and be stronger in children who experienced the intervention at somewhat older ages (i.e., 11−18 months).
Third, intervention effects might only occur in the T+SC group, which experienced an environment supportive of caregiver–child relationships, which again may be displayed more strongly in these caregiver–child interaction behaviors than in indices of general development.
Given these hypotheses, it was possible that the effects of the interventions might be confined to very few of the 36 cells of the general analyses (e.g., only T+SC children who began the intervention after 6 months, experienced 9+ months of the intervention, and only during free play and reunion episodes [i.e., when the caregiver was present]). Therefore, to test these more specific hypotheses, analyses were conducted a priori separately on each episode, intervention effects were tested separately for children with 4−9 months versus those with 9+ months of exposure, and pair-wise comparisons between intervention groups were also tested separately within each level of exposure.
Results for Typically Developing Children
General Analyses
The general analyses failed to produce any interactions with intervention group for the independent variables of initial age and gender. These results suggest that the interventions influenced males and females equally within sampling error, and that they had essentially the same effect on children who were exposed to the interventions and assessed predominantly during the first year of life as on those who were exposed at somewhat older ages. In addition, there were no effects for the dependent variable of disruptiveness on either the overall or more specific analyses, so it will not be discussed further.
The results of the general analyses, calculated separately on the cross-sectional and longitudinal samples of typical children, are presented in Table 16 for the intervention and its interactions with exposure and episode. Although the significance levels varied between samples and across the four dependent variables, a consistent pattern of results emerged. First, intervention groups differed significantly on these four sets of ratings for both samples even after children's scores on these ratings during their initial preintervention assessment were covaried. Further, intervention interacted with the length of exposure and/or the particular episode (free play, separations, reunions) of the assessment procedure. This pattern of results suggests that some of the initial specific hypotheses are plausible and may receive support from the specific analyses conducted separately within each exposure level and episode.
TABLE 16.
Overall ANCOVA Results (F) for Infant Affect Manual Composite Variables for Cross-Sectional and Longitudinal Samples of Typical Children
| Composite variable |
||||
|---|---|---|---|---|
| Effect | Positive Emotion | Negative Emotion | Number of Emotions | Passivity-Activity |
| Intervention | ||||
| Cross-sectionala | 1344*** | 4.50*** | 6.61** | 5.14** |
| Longitudinalb | 16.34*** | 3.41* | 18.89*** | 3.78* |
| Intervention × Exposure | ||||
| Cross-sectional | 2.33† | 3.70* | 4.54** | 2.87† |
| Longitudinal | 1.31 | 0.75 | 0.41 | 4.30** |
| Intervention × Episode | ||||
| Cross-sectional | 8.75*** | 1.74 | 3.16** | 1.87 |
| Longitudinal | 5.67*** | 0.75 | 1.37 | 0.81 |
| Intervention × Exposure × Episode | ||||
| Cross-sectional | 2.89* | 1.18 | 1.00 | 0.48 |
| Longitudinal | 1.33 | 1.35 | 0.57 | 0.93 |
Note.
Ns: T+SC = 119, TO = 162, NoI = 142.
Ns: T+SC = 39, TO = 42, NoI = 62.
p ≤ .10
p ≤ .05
p ≤ .01
p ≤ .001; cross-sectional analysis: Intervention (T+SC, TO, NoI) × Exposure (4−9, 9+ months) × Episode (Free Play, Separations, Reunions) × Initial Age (≤ 6, >6 months) × Gender with fixed covariates of age and Functional Abilities Index at initial assessment and with varying covariates of the dependent variable at the initial assessment at each episode, respectively. Longitudinal analysis: Intervention (T+SC, TO, NoI) × Exposure (Initial, 4−9, 9+ months) × Episode (Free Play, Separations, Reunions) × Initial Age (≤ 6, > 6 months) × Gender with fixed covariates of age and Functional Abilities Index at initial assessment.
Specific Analyses
The statistical results of analyses of covariance for the cross-sectional and longitudinal samples of typical children conducted separately on each of the three episodes are presented in Tables 17-20 for Positive Emotional Tone, Negative Emotional Tone, Number of Different Emotions, and Passivity–Activity, respectively. Statistical details are provided only for intervention, exposure, and intervention within 4−9 and 9+ months exposure; significance levels only are given for pairwise BH comparisons within exposure levels to simplify the presentation.
TABLE 17.
ANCOVA Results (F, η2) for Infant Affect Manual Rating of Positive Emotional Tone on Cross-Sectional and Longitudinal Samples of Typical Children Conducted Separately on Each Episode
| Free Play |
Separations |
Reunions |
||||
|---|---|---|---|---|---|---|
| Effect | Cross-sectionala | Longitudinalb | Cross-sectionala | Longitudinalb | Cross-sectionala | Longitudinalb |
| Intervention Main | 15.10*** (0.07) | 9.23*** (0.12) | .34 (.00) | 0.51 (0.01) | 9.00*** (0.04) | 4.68** (0.07) |
| Intervention × Exposure | 5.24** (0.03) | 0.43 (0.01) | .63 (.00) | 1.07 (0.02) | 0.16 (0.00) | 1.73 (0.03) |
| Intervention within 4−9 months | 4.67** (0.02) | 3.01* (0.04) | .21 (.00) | 0.58 (0.01) | 5.03** (0.03) | 5.35** (0.07) |
| T+SC vs. TO | — | † | — | — | ** | — |
| T+SC vs. NoI | ** | * | — | — | * | ** |
| TO vs. NoI | ** | — | — | — | — | * |
| Intervention within 9+ months | 15.53*** (0.07) | 8.45*** (0.11) | .66 (.00) | 1.09 (0.02) | 4.78** (0.02) | 3.42* (0.05) |
| T+SC vs. TO | *** | *** | — | — | * | * |
| T+SC vs. NoI | *** | *** | — | — | ** | * |
| TO vs. NoI | — | — | — | — | — | — |
Note.
Ns: T+SC = 119, TO = 162, NoI = 142.
Ns: T+SC = 43, TO = 42, NoI = 64.
p ≤ .10
p ≤ .05
p ≤ .01
p ≤ .001
Intervention (T+SC, TO, NoI) × Exposure (4−9, 9+ months) × Age at Initial Assessment (≤ 6, >6 months) with covariates of age, Functional Abilities Index, and value of dependent variable at initial assessment conducted separately for each episode.
TABLE 20.
ANCOVA Results (F, η2) for Infant Affect Manual Rating of Passive-Activity on Cross-Sectional and Longitudinal Samples of Typical Children Conducted Separately on Each Episode
| Effect | Free Play |
Separations |
Reunions |
|||
|---|---|---|---|---|---|---|
| Cross-sectionala | Longitudinalb | Cross-sectionala | Longitudinalb | Cross-sectionala | Longitudinalb | |
| Intervention main | 5.30** (0.03) | 1.32 (0.02) | 0.62 (0.00) | 0.97 (0.01) | 4.88** (0.02) | 0.90 (0.01) |
| Intervention × Exposure | 1.84 (0.01) | 4.98** (0.07) | 2.90 (0.01) | 2.52† (0.04) | 2.76† (0.01) | 7.10*** (0.10) |
| Intervention within 4−9 months | 2.55† (0.01) | 4.15* (0.06) | 1.59 (0.01) | 1.30 (0.02) | 3.94* (0.02) | 6.06** (0.08) |
| T+SC vs. TO | * | — | † | — | ** | — |
| T+SC vs. NoI | — | ** | — | — | * | *** |
| TO vs. NoI | — | — | — | — | — | * |
| Intervention within 9+ months | 4.30** | 2.13 (0.03) | 2.40† | 1.41 (0.02) | 3.34* (0.02) | 1.97 (0.03) |
| T+SC vs. TO | * | — | — | — | † | — |
| T+SC vs. NoI | — | — | * | † | — | — |
Note.
Ns: T+SC = 119, TO = 162, NoI = 142.
Ns: T+SC = 43, TO = 42, NoI = 64.
p<.10
p<.05
p<.01
p<.001; Intervention (T+SC, TO, NoI) × Exposure (4−9, 9+months) × Age at Initial Assessment (<6, >6 months) with covariates of age, Functional Abilities Index, and value of dependent variable at initial assessment conducted separately for each episode
These results revealed three general conclusions, albeit with occasional exceptions. First, the T+SC intervention produced a more differentiated pattern of emotions across the three episodes, especially after 9 months of exposure. That is, T+SC children displayed higher Positive Emotional Tone, Number of Emotions, and Passivity-Activity during free play and reunions relative to separations and more Negative Emotional Tone during both separations and reunions than TO and NoI. This differential responding presumably reflects some degree of child–caregiver relationship in T+SC.
Second, intervention effects were stronger or only occurred after 9+ months of exposure (these children are also older). This tendency is consistent with the hypothesis that longer exposure to the intervention is required for effects to be displayed in social–emotional–relationship behaviors than in indices of general development, perhaps because general development may be stimulated by anyone but relationships must develop with specific caregivers.
Third, the results for both the general analyses and the differences between intervention groups within the 4−9 and 9+ months exposure levels were quite similar for the cross-sectional and longitudinal samples in terms of statistical significance, although effect sizes were larger for the longitudinal sample. This observation suggests that these intervention effects were not substantially influenced by selective attrition.
The major results for specific emotions are presented graphically in Figures 28-31, each of which represents the cross-sectional data at the top and the longitudinal data at the bottom after 4−9 months exposure at the left and 9+ months exposure at the right. Note that each point has been adjusted for covariates including the value of the dependent variable on children's initial assessment from separate analyses conducted within each episode, so graphed values depict change over initial assessment within each episode.
Figure 28.

Adjusted Positive Emotional Tone for typical children in the cross-sectional (top) and longitudinal (bottom) samples after 4−9 months (left) and 9+ months (right) exposure during the free play, separation, and reunion episodes.
Figure 31.

Adjusted Passivity-Activity for typical children in the cross-sectional (top) and longitudinal (bottom) samples after 4−9 months (left) and 9+ months (right) exposure during the free play, separation, and reunion episodes.
Positive Emotional Tone
For Positive Emotional Tone (Figure 28), T+SC tended to be higher than the other intervention groups at free play and reunions for both samples and at both levels of exposure, but the differences were larger after 9+ months of exposure. This pattern reflects a more differentiated and positive emotional response by T+SC children during free play and reunions versus separations than for TO and NoI children.
Negative Emotional Tone
No significant differences occurred for Negative Emotional Tone (Figure 29) after only 4−9 months of exposure. However, after 9+ months, T+SC was not consistently significantly different from the other intervention groups across cross-sectional and longitudinal samples for free play but did show substantially more negative emotion for both separations and subsequent reunions. Presumably, after 9+ months of exposure and a longer opportunity to develop a relationship with a specific caregiver, T+SC children became more upset when the caregiver left and they continued to display more negative emotions when the caregiver returned, which may reflect stronger attachment, even as they also showed more positive emotion at other times during reunions.
Figure 29.

Adjusted Negative Emotional Tone for typical children in the cross-sectional (top) and longitudinal (bottom) samples after 4−9 months (left) and 9+ months (right) exposure during the free play, separation, and reunion episodes.
Number of Emotions
The results for the Number of Different Emotions (Figure 30) followed the combined pattern of elevated levels of positive and negative emotions for T+SC children. After 9+ months of exposure, T+SC children in both samples showed more different emotions when the caregiver was present (i.e., free play and reunions) but not significantly more during separations.
Figure 30.

Adjusted Number of Different Emotions for typical children in the cross-sectional (top) and longitudinal (bottom) samples after 4−9 months (left) and 9+ months (right) exposure during the free play, separation, and reunion episodes.
Passivity–Activity
T+SC and TO displayed significantly higher levels of Passivity–Activity (Figure 31) during free play and reunions versus separations in the longitudinal sample after 4−9 months, but the higher levels for T+SC were not significant in the cross-sectional sample; however, T+SC displayed a much more clearly differentiated pattern after 9+ months of exposure, with relatively higher levels of Passivity–Activity while the caregiver is present in free play and reunions versus separations than the other groups.
Results for Children With Disabilities
The same general and specific analyses (but without the Gender factor) were calculated on the cross-sectional and longitudinal samples of children with disabilities.
General Analyses
Table 21 presents the statistical results for the general analyses of covariance for the cross-sectional and longitudinal samples of children with disabilities calculated separately for the four IAM composite variables. As expected, fewer statistically significant results were observed because of the very small N (8−37 in each intervention group). However, if results at p<.10 are considered in view of the small N, there was some intervention effect for each dependent variable, although the specific effect is different for each composite variable and different for the two samples. This pattern again prompts a look at the more specific effects for intervention within exposures and episodes.
TABLE 21.
Overall ANCOVA Results (F) for Infant Affect Manual Composite Variables for Cross-Sectional and Longitudinal Samples of Children With Disabilities
| Composite Variable |
||||
|---|---|---|---|---|
| Effect | Positive Emotion | Negative Emotion | Number of Emotions | Passivity-Activity |
| Intervention | ||||
| Cross-sectionala | 0.15 | 6.56** | 1.61 | 3.03† |
| Longitudinalb | 2.47 | 2.55† | 3.13† | 3.62* |
| Intervention × Exposure | ||||
| Cross-Sectional | 2.81† | 1.65 | 2.60† | 1.22 |
| Longitudinal | 2.15† | 2.57* | 1.73 | 1.26 |
| Intervention × Episode | ||||
| Cross-Sectional | 0.64 | 0.82 | 2.25† | 0.13 |
| Longitudinal | 0.71 | 0.96 | 0.75 | 0.70 |
| Intervention × Exposure × Episode | ||||
| Cross-sectional | 0.11 | 0.21 | 0.93 | 1.66 |
| Longitudinal | 1.62 | 0.67 | 0.60 | 1.43 |
Note.
p ≥ .10
p ≥ .05
p ≥ .01
***p ≥ .001
Cross-sectional analysis: Intervention (T+SC, TO, NoI) × Exposure (4−9, 9+ months) × Episode (Free Play, Separations, Reunions) × Initial Age (≥ 6, >6 months) × Gender with fixed covariates of age, Functional Abilities Index at initial assessment and with varying covariates of the dependent variable at the initial assessment at each episode respectively. Longitudinal analysis: Intervention (T+SC, TO, NoI) × Exposure (Initial, 4−9, 9+ months) × Episode (Free Play, Separations, Reunions) with fixed covariates of age and Functional Abilities Index at initial assessment.
N T+SC = 37, N TO = 18, N NoI = 17.
N T+SC = 20, N TO = 8, N NoI = 10.
Specific Analyses
The statistical results for the cross-sectional and longitudinal samples of children with disabilities conducted separately on each episode covarying the children's age, Functional Abilities, and score at their initial assessment are given in Tables 22−25. The pattern of results across composite emotions was both similar to and different than the results for typically developing children.
TABLE 22.
ANCOVA Results (F, η2) for Infant Affect Manual Rating of Positive Emotional Tone on Cross-Sectional and Longitudinal Samples of Children With Disabilities Conducted Separately on Each Episode
| Free Play |
Separations |
Reunions |
||||
|---|---|---|---|---|---|---|
| Effect | Cross-sectionala | Longitudinalb | Cross-sectionala | Longitudinalb | Cross-sectionala | Longitudinalb |
| Intervention Main | 0.63 (0.02) | 3.14† (0.16) | 0.93 (0.00) | 2.95† (0.16) | 0.63 (0.02) | 4.18** (0.20) |
| Intervention × Exposure | 1.96 (0.06) | 1.66 (0.08) | 1.93 (0.06) | 1.24 (0.07) | 1.54 (0.05) | 0.67 (0.04) |
| Intervention within 4−9 months | 0.41 (0.01) | 0.63 (0.03) | 0.50 (0.02) | 0.57 (0.03) | 0.23 (0.01) | 1.59 (0.08) |
| T+SC vs. TO | — | — | — | — | — | — |
| T+SC vs. NoI | — | — | — | — | — | — |
| TO vs. NoI | — | — | — | — | — | † |
| Intervention within 9+ months | 3.46** (0.09) | 3.85** (0.18) | 2.41 (0.10) | 2.72† (0.13) | 3.43** (0.10) | 2.87† (0.14) |
| T+SC vs. TO | — | — | — | — | — | — |
| T+SC vs. NoI | ** | ** | ** | ** | ** | * |
| TO vs. NoI | * | * | — | — | — | — |
Note.
Ns: T+SC = 39, TO = 18, NoI = 18.
Ns: T+SC = 20, TO = 8, NoI = 10.
p ≤ .10
p ≤ .05
p ≤ .01
***p ≤ .001
Intervention (T+SC, TO, NoI) × Exposure (4−9, 9+ months) × Age at Initial Assessment (≤ 6, >6 months) with covariates of age, Functional Abilities Index, and value of dependent variable at initial assessment conducted separately for each episode.
First, while typically developing children were similar across intervention groups on separation episodes (except for negative emotion in T+SC after 9+ months exposure), significant and near significant results for children with disabilities were scattered across all three episodes. Second, while typically developing children tended to show stronger effects after 9+ months of exposure, this was not uniformly true for children with disabilities. It was the case for Positive and Negative Emotional Tone, but not the Number of Different Emotions or Passivity–Activity. Third, as with typically developing children, the results were relatively similar across the cross-sectional and longitudinal samples after 9 months exposure (except for Passivity–Activity), and the effect sizes were higher for children with disabilities than for typically developing children and higher for longitudinal than for cross-sectional samples.
Positive Emotional Tone
For Positive Emotional Tone (Figure 32), there were no significant intervention differences after 4−9 months, but after 9+ months exposure the intervention groups differed at free play and reunions but not at separations (especially in the cross-sectional sample), which also was generally true for typically developing children. However, T+SC and TO showed higher levels of positive emotional tone than the NoI group, but not necessarily a more differentiated free play/reunions versus separations pattern (although TO shows hints of it). T+SC was consistently significantly higher after 9+ months than NoI, but it was not different than TO, and TO was only significantly higher than NoI at free play.
Figure 32.

Adjusted Positive Emotional Tone for children with disabilities in the cross-sectional (top) and longitudinal (bottom) samples after 4−9 months (left) and 9+ months (right) exposure during the free play, separation, and reunion episodes.
Negative Emotional Tone
For Negative Emotional Tone (Figure 33), the results after 4−9 months exposure were quite different for the cross-sectional and longitudinal samples, and therefore, a firm interpretation is not possible. Conversely, after 9+ months of exposure, the results for the two samples were rather similar, but while T+SC was significantly higher than TO, it was not different than NoI. Thus, it was the TO group that shows substantially lower levels of Negative Emotional Tone than the other two groups, which is consistent with the low levels displayed by their caregivers.
Figure 33.

Adjusted Negative Emotional Tone for children with disabilities in the cross-sectional (top) and longitudinal (bottom) samples after 4−9 months (left) and 9+ months (right) exposure during the free play, separation, and reunion episodes.
Number of Emotions
The results after 4−9 months for the Number of Different Emotions (Figure 34) were also inconsistent between samples, but after 9+ months T+SC showed a greater Number of Different Emotions than the other two groups at each of the episodes, although it was not always statistically significant in each pairwise comparison. This result is somewhat similar to that for typically developing children.
Figure 34.

Adjusted Number of Different Emotions for children with disabilities in the cross-sectional (top) and longitudinal (bottom) samples after 4−9 months (left) and 9+ months (right) exposure during the free play, separation, and reunion episodes.
Passivity–Activity
There were only scattered and relatively inconsistent significant results for passivity-activity (Figure 35) across samples and exposure levels.
Figure 35.

Adjusted Passivity-Activity for children with disabilities in the cross-sectional (top) and longitudinal (bottom) samples after 4−9 months (left) and 9+ months (right) exposure during the free play, separation, and reunion episodes.
Caregiver Behavior Before and After the Interventions
To examine the effects of the interventions on caregiver emotions, analyses were conducted on all of the caregiver assessments available at various time points before and after the interventions were implemented in the same way the PCERA caregiver subscales were analyzed (Chapter X).
Preliminary Analyses
The complete analysis consisted of Intervention (T+SC, TO, NoI) × Time Point (Preintervention, Postintervention—First Year, Postintervention—Second Year, Postintervention—Third Year) × Episode (Free Play, Reunion 1, Reunion 2) × Disability) (Typical, Disability) ANOVAs. Caregivers again behaved similarly regardless of whether they accompanied typical children or those with disabilities and regardless of episode, so the results reported below are for all caregiver assessments across the children's disability status and episodes. These analyses had very substantial Ns (160−251 for most cells), but fewer cases for TO and NoI in Postintervention—Third Year because the project ended before the completion of that entire year for these two groups. Again, caregivers may have contributed more than one assessment across time points (their last assessment was selected within a time point), so probabilities should be cautiously interpreted as descriptive. Nevertheless, these analyses do convey a comprehensive snapshot of the behavior of all caregivers, both veterans and new caregivers, in the three intervention groups at these time points.
Results
The statistical results for the caregiver composites of Positive Emotional Tone, Negative Emotional Tone, and Number of Different Emotions as a function of intervention and time point are given in Table 26. The results were similar across the three emotional composites. There were significant differences in total level for intervention groups, but these main effects were qualified by an Intervention × Time interaction for each emotional composite. Specifically, the caregivers in the intervention groups did not differ prior to the beginning of the interventions for any of these emotions (i.e., at Preintervention). After the intervention was completely implemented, the intervention groups diverged substantially for Negative Emotional Tone and the Number of Different Emotions at Postintervention—First Year and for all three emotional composites thereafter. Each intervention group displayed some significant change across the years of the project. Although the Fs and significance levels are high because of the large N, effect sizes are relatively low.
TABLE 26.
Statistical Results (F, Significance, η2) for Infant Affect Manual Caregiver Variables Corresponding to Longitudinal Children's Initial 4−9, 9+ months Exposure Assessments
| Effect | Positive Emotion | Negative Emotion | Number of Emotions |
|---|---|---|---|
| Intervention | 4.94** (.05) | 2.23 (.02) | 6.44** (.07) |
| Intervention × Exposure | 1.26 (.01) | 3.55** (.04) | 3.45** (.04) |
| Intervention within exposure | |||
| Initial | 3.88* (.04) | 0.72 (.01) | 3.07* (.03) |
| 4−9 months | 0.38 (.00) | 2.63† (.03) | 2.96* (.03) |
| 9+months | 5.64** (.06) | 5.75** (.06) | 7.55*** (.08) |
Note.
p ≤ .10
p ≤ .05
p ≤ .01
p ≤ .001
Based on Intervention (T+SC, TO, NoI) × Exposure (Initial, 4−9 months, 9+ months) × Episode (Free Play, Reunion 1, Reunion 2) × Typical/Disability with children's age and Functional Abilities Index at initial assessment as covariates. In the longitudinal sample, children are the units; data from caregivers accompanying child on each of child's assessments are dependent variables; a caregiver may accompany more than one child at different exposures; since the child is the unit of analysis, exposure is treated as a repeated factor. ns (Typical/Disability: T+SC = 44, 21; TO = 42, 8; NoI = 64,10.
Figure 36 shows changes in caregiver Positive Emotional Tone, Negative Emotional Tone, and Number of Different Emotions, respectively, for each of the three intervention groups across Time Points of the project. T+SC caregivers increased in Positive Emotional Tone somewhat after the intervention was implemented, whereas the other two groups actually declined. For Negative Emotional Tone and the Number of Different Emotions, T+SC again showed a steady increase after the intervention while TO declined sharply; but the NoI condition displayed a sharp increase in both measures, especially in Postintervention—Third Year.
Figure 36.

IAM behavioral composites for caregivers accompanying the combined longitudinal sample of typical and children with disabilities in T+SC, TO, and NoI plotted over time.
These results conform somewhat to expectations for the T+SC group—namely, T+SC caregivers increased in Positive Emotional Tone, Negative Emotional Tone, and the Number of Different Emotions after the intervention, roughly in parallel with the emotional behavior of the children. The TO and NoI caregivers declined in Positive Emotional Tone over Time, but NoI increased while TO decreased in Negative Tone and Number of Emotions the last 2 years of the project.
We speculate that all caregivers started these observations on their best behavior, and the T+SC intervention produced increases in emotional expressiveness in both children and caregivers. After the initial assessments, caregivers in TO changed in parallel with T+SC caregivers at Postintervention First Year—both sets were trained and knew what was expected. At Postintervention Second Year, there was a tendency for TO and NoI to revert to their typical low-affect style. This tendency may have been accentuated in TO because of the departure of the director, which was accompanied by internal conflict and depression among staff, which may have led to decreased emotional expressiveness. In contrast, the death of the NoI director was sudden and tragic and apparently produced greater displays of negative emotions at Postintervention Third Year. Of course, other differences between the groups could have played a role.
CONCLUSION
Generally, T+SC children displayed a more differentiated pattern of emotions across the free play, separation, and reunion episodes, consistent with having a better relationship with the caregiver than children in the other groups. Similar to the results in Chapter X for the PCERA social– emotional ratings in free play, caregivers in TO and TO children with disabilities often behaved similarly to their T+SC counterparts on some measures, and there was some evidence the training was associated with similar behaviors for T+SC and TO caregivers within a year or two of the completed intervention but not thereafter, consistent with TO caregivers behaving according to expectations for the assessment.
ATTACHMENT VARIABLES
Without structural changes, children experienced approximately 9−12 caregivers a week and 60−100 different caregivers plus specialists in the first 19+ months of residency, and caregivers provided minimum social–emotional interactions with children. The T+SC interventions reduced the number of caregivers and promoted social–emotional interactions and relationships, so one might expect T+SC children to form more adaptive attachments than those from TO and NoI.
Procedure
Sample
Children were selected who had at least 4 months exposure to the interventions (or residing in NoI) and who had a free play–separation– reunion assessment conducted between 11.5 and 18 months of age, because this age range is most appropriate for assessing attachment with this type of procedure. If two assessments were available in this age period, the one at the oldest age was used. The mean age at assessment was 15.9 months. Only typically developing children were analyzed because some disabilities would limit children from displaying certain behaviors relevant to the classifications and ratings.
Two no-treatment subsamples were selected consisting of 64 children from the NoI condition and 13 children from T+SC who were assessed at baseline prior to the introduction of the interventions. This comparison constituted a check that children in T+SC before the intervention were comparable to NoI children. The postintervention analyses were conducted on all children meeting the above criteria: 52 T+SC, 54 TO, and 64 NoI children.
Assessment Procedure
The assessment procedure was the same 5 min of free play and two 3-min-separation and 3-min-reunion sequences used in the IAM analyses described above. Children were accompanied by one caregiver who was the “caregiver most acquainted with the child or who had the best relationship with the child” at the time, which typically, but not always, was a Primary Caregiver in T+SC.
Measures
As described in Chapter IV, three kinds of measures were determined.
Attachment categories
Videotapes of all five episodes (free play, two separate-reunion sequences) were viewed, and attachment categories A (Insecure-Avoidant), B (Securely-Attached), C (Insecure-Resistant; Ainsworth et al., 1978), and D (Disorganized/Disoriented; Main & Solomon, 1990) were determined on the basis of the entire set of five episodes.
Behavior ratings
Seven-point ratings were made of Proximity Seeking, Contact Maintaining, Avoidant Behavior, and Resistance as defined by Ainsworth et al. (1978) after both reunion episodes. These ratings were similar but not identical across the two reunions, so reunion episode was retained as a factor in analyses.
Attachment dimensions
Fraley and Spieker (2003) have suggested that (Proximity+Contact–Avoidance) and (Resistance) define two dimensions that largely account for traditional attachment categorization, so these two dimensions were also calculated and analyzed for each reunion episode.
Results
No-Treatment Groups
Children from NoI were compared with T+SC children who were assessed during baseline prior to any interventions to determine that children were not significantly different in the T+SC BH than in the NoI BH.
Attachment categories
All 13 children (100%) in T+SC and 55 of 64 (86%) children in NoI were categorized as D. The Fisher's exact test was not significant (p = .34).
Behavior ratings
A BH (Baseline T+SC vs. NoI) × Episode (Reunion 1, 2) multivariate analysis of variance was conducted on the four behavior ratings. There was no significant multivariate BH effect, F(4, 72) = 1.90, p = .12, or BH × Episode Interaction, F(4, 72) = 179, p = .14, and there were no significant BH univariate main effects.
Attachment dimensions
Similarly, a BH × Episode multivariate analysis of variance on the two attachment dimensions also failed to produce significant differences for BH (F<1) or the interaction with episode, F(2, 74) = 1.19, p = .31, and no significant univariate BH effects emerged (Fs<1).
Therefore, there was no evidence that children in T+SC were different prior to the intervention from children in the NoI for any of the attachment variables.
Postintervention Effects on Attachment Variables
Attachment categories
Table 27 presents the percentage of postintervention children in T+SC, TO, and NoI who were given A, B, C, and D attachment categories plus those given A+B+C categories. The three intervention conditions differed significantly in the distribution of cases across the four categories, with T+SC children having more B and C and fewer D categories. Because many cells had fewer than five expected frequencies, categories A, B, and C were combined and tested against D, and the three intervention conditions differed significantly on this comparison. In addition, TO did not differ from NoI (χ2 = 0.013) but T+SC differed from TO plus NoI combined (χ2 = 11.54, p<.001); so, essentially, all of the difference between the three intervention conditions was associated with the difference between T+SC and the other two groups.
TABLE 27.
Categories of Attachment (Number, Percent) for T+SC, TO, NoI Children
| Attachment Category |
|||||
|---|---|---|---|---|---|
| BH | A | B | C | D | A+B+C |
| T+SC | 2 (3.8%) | 3 (5.8%) | 15 (28.8%) | 32 (61.5%) | 20 (38.5%) |
| TO | 1 (1.9%) | 1 (1.9%) | 6 (11.1%) | 46 (85.2%) | 8 (14.8%) |
| NoI | 1 (1.6%) | 0 (0.0%) | 8 (12.5%) | 55 (85.9%) | 9 (14.1%) |
| χ2 = 13.67, df = 6, p = .034 | χ2 = 12.28, df = 2, p = .002 | ||||
In short, T+SC children were approximately 2.7 times more likely to have an A, B, or C attachment classification than children in the other two intervention groups, and more than twice as many C children were in T+SC. TO had essentially no influence on attachment categorizations.
Four behavior ratings
BH (T+SC, TO, NoI) × Reunion Episode (1, 2) multivariate and univariate analyses of variance were conducted on the Proximity, Contact, Avoidance, and Resistance behavior ratings, statistical results are presented at the left in Table 28, and the pattern of means for the three BHs is given in Figure 37. The results were quite consistent.
TABLE 28.
Fs and (η2) for BH × Episode Analyses on Four Behavior Ratings (P, C, A, R) and Two Attachment Dimensions (P+C-A, R)
| Four Ratings |
Two Dimensions |
||||||
|---|---|---|---|---|---|---|---|
| Effect | Multiv. | Proximity | Contact | Avoidance | Resistance | P+C-A | Multiv. |
| BHa | 4.34*** (.10) | 8.15*** (.09) | 13.76*** (.14) | 4.46** (.05) | 0.33 (.00) | 13.07*** (.14) | 6.47*** (.07) |
| T+SC vs. NoIb | 6.11*** (.18) | 12.52*** (.16) | 23.48*** (.26) | 8.79** (.12) | 0.41 (.01) | 22.99*** (.12) | 10.35*** (.16) |
| T+SC vs. TOb | 4.50** (.15) | 12.43*** (.07) | 18.26*** (.22) | 3.50† (.05) | 0.01 (.00) | 16.39** (.09) | 8.17*** (.14) |
| TO vs. NoIb | 0.62 (.02) | 0.02 (.00) | 0.16 (.00) | 1.05 (.02) | 0.54 (.01) | 0.34 (.00) | 0.41 (.01) |
| BH × Episodea | 3.68*** (.08) | 3.01* (.04) | 10.48*** (.11) | 0.33 (.00) | 3.07* (.04) | 2.60† (.03) | 2.52* (.03) |
| T+SCc | 9.03*** (.18) | 9.27** (.05) | 29.58*** (.15) | 0.12 (.00) | 7.02** (.04) | 11.67*** (.07) | 7.27*** (.08) |
| TOc | 0.51 (.01) | 0.36 (.00) | 0.24 (.00) | 0.45 (.00) | 0.30 (.00) | 0.37 (.00) | 0.47 (.01) |
| NoIc | 1.68 (.04) | 0.03 (.00) | 0.20 (.00) | 2.39 (.01) | 5.71* (.03) | .71 (.00) | 2.85† (.03) |
Note.
4 Rating multivariate df = 8/330, univariate df = 2/167; 2 Dimension multivariate df = 4/332, univariate df = 2/167.
4 Rating multivariate df = 4/101−113, univariate df = 1/167; 2 Dimension multivariate df = 2/103−115, univariate df = 1/167.
4 Rating multivariate df = 4/164, univariate df = 1/167; 2 Dimension multivariate df = 2/166, univariate df = 2/167.
p ≤ .10
p ≤ .05
p ≤ .01
p ≤ .001.
Figure 37.
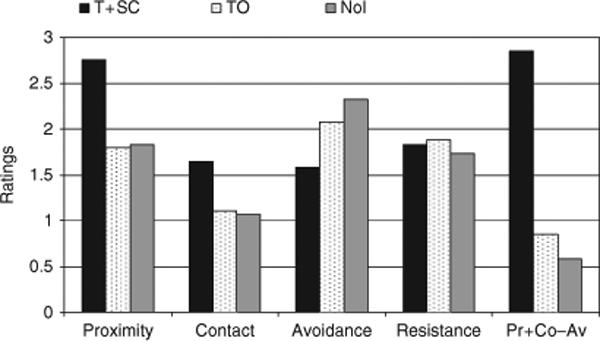
Mean behavior ratings for T+SC, TO, and NoI children across reunion episodes.
The intervention conditions differed significantly on the multivariate test (top left of Table 28), which difference is reflected in Proximity, Contact, and Avoidance but not Resistance (top row). Further, T+SC (second row) has significantly more Proximity and Contact seeking and less Avoidance than both NoI and TO, and in no case does TO differ from NoI (row four).
In the bottom four rows of Table 28, the statistical results showed a significant BH × Episode multivariate interaction with significant univariate interactions for Proximity, Contact, and Resistance but not Avoidance. These interactions do not qualify the main effects for the BH intervention reported above; instead they indicated that T+SC showed more Proximity and Contact seeking on the second than the first episode and that T+SC and NoI showed less Resistance on the first than the second reunion.
These results are consistent with those for the attachment categories reported above in that only T+SC, not TO, produced higher scores on these attachment variables than the NoI condition. In addition, the effects for T+SC tended to be greater on the second than the first reunion for Proximity and Contact.
Two attachment dimensions
Not surprisingly, the results for Fraley and Spieker's (2003) two attachment dimensions are similar, with statistical results presented at the right of Table 28 and graphic results at the right of Figure 37. Again, only T+SC differs significantly from the other two groups, showing three to four times as much Proximity+Contact–Avoidance (more on the second than the first reunion episode) as the other two groups which do not differ from one another. The Resistance dimension is the same as described above.
Correspondence Between Attachment Categories, Behavior Ratings, and Attachment Dimensions
Because the behavior of orphanage children in attachment assessment situations may be different from parent-reared children, we investigated the correspondence between the attachment categories on the one hand and the behavioral ratings and attachment dimensions on the other. Attachment Categories (A, B, C, D) × Episode multivariate and univariate analyses of variance were calculated separately on the four behavioral ratings and then on the two attachment dimensions. The intent was to demonstrate that the ratings and dimensions differed as a function of Attachment Categories in ways typically defined by those categories.
Behavior Ratings
The pattern of results for the four behavior ratings is presented in Figure 38, which gives the mean ratings as a function of attachment categories across episodes and intervention conditions.
Figure 38.
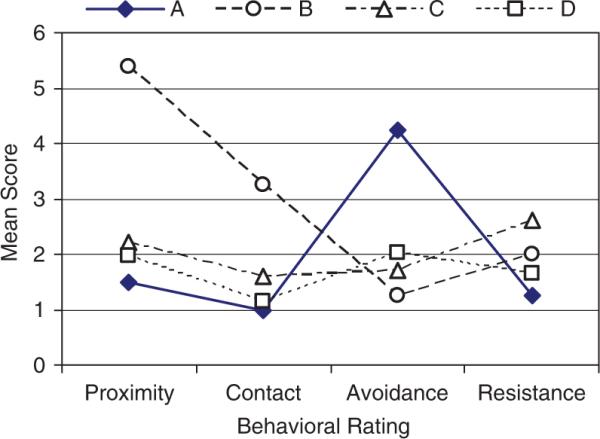
Mean behavior ratings for each attachment category across T+SC, TO, and NoI.
The multivariate effect for Attachment category was significant, F(12, 431.5) = 7.87, p<.001, η2 = .16, with no significant interaction with episodes. There were significant Attachment Category differences on univariate tests of all four behavioral ratings: Proximity (F = 8.03, p<.001, η2 = .13), Contact (F = 19.02, p<.001, η2 = .26), Avoidance (F = 4.31, p<.006, η2 = .07), and Resistance (F = 10.39, p<.001, η2 = .16). Children given Category A displayed significantly more Avoidance than children in all other categories and less Resistance than children in Category C. Those children in Category B displayed significantly more Proximity and Contact maintaining than children in each of the other Attachment categories. Children in Category C displayed more Contact and Resistance than those in Category D and more Resistance than those in Category A, and children categorized as D exhibited less Proximity than B, less Contact than B and C, less Avoidance than A, and less Resistance than C.
Attachment Dimensions
Attachment Categories (A, B, C, D) × Episode multivariate and univariate ANOVAs were calculated on the (Proximity+Contact–Avoidance) and (Resistance) attachment dimensions. Again, there was a significant multivariate effect for Attachment category, F(6, 330) = 9.89, p<.001, η2 = .15 and no significant interaction with episode, and there were significant univariate effects for Attachment Category for (Proximity+Contact–Avoidance), (F = 10.76, p<.001, η2 = .16) and Resistance (F = 10.39, p<.001, η2 = .16).
Since these are conceived to be dimensions of attachment behavior, Figure 39 plots the location of each Attachment Category in the space defined by (Proximity+Contact–Avoidance) and (Resistance) as orthogonal axes. Statistical comparisons bear out the graphic picture, in that Categories A, B, and (C and D) are significantly different from one another on (Proximity+Contact–Avoidance) (C and D are different from one another at p = .06), whereas C is distinguished from both A and B on Resistance (C and B are not significantly different and B is not significantly different from A and D).
Figure 39.
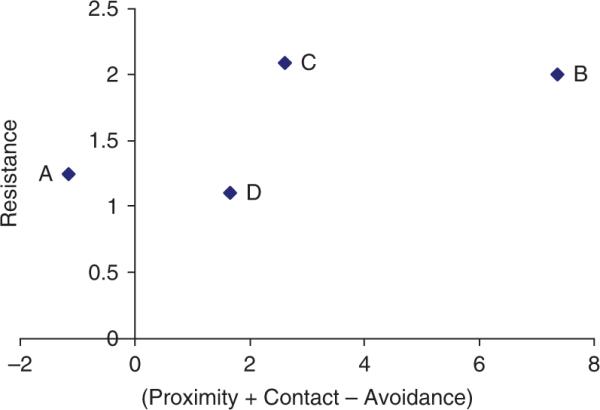
The four attachment categories across BHs placed on the attachment dimensions of (Proximity+Contact–Avoidance) and Resistance.
This pattern of results generally conforms to the behavioral characteristics that typically define attachment categories. For example, as expected, children categorized as A display the most Avoidance of the caregiver upon reunion, children categorized as B are highest in Proximity seeking and Contact maintaining, those in C display the most Resistance, and those in D do not show a clear differentiated pattern reflecting their Disorganization. This pattern is further reflected on the attachment dimensions in which C is distinguished from A and D in terms of Resistance, B is extremely positive on (Proximity+Contact–Avoidance) because of its high scores on Proximity and Contact, and A is extremely negative because of its high scores on Avoidance. Again, C is high on Resistance, and the undifferentiated and disorganized D category is in the middle on both dimensions.
Parameters of Attachment Variables
Conceptually, it was of interest to determine if children exposed longer to the T+SC intervention and those accompanied by their Primary (rather than a Secondary) Caregiver were more likely to have attachment classifications of A, B, or C versus D and corresponding differences in the attachment ratings and dimensions, but in practice the statistical comparisons were not sufficiently sensitive to detect such possibilities.
The variability in length of exposure was much more limited for the attachment variables than for other outcomes. The attachment variables were assessed only on children 11.5−18 months of age, so children with the minimum of 4 months exposure would have it between 7.5 and 18 months of age; those with 9−11 months exposure would have it between 7.5 and 18 months; and thus all children would have at least 4 months exposure between 7.5 and 18 months of age, which is within the period thought to be most sensitive for caregiver–child relationships to develop. A variety of analyses failed to reveal any significant length of exposure effects or interactions on the attachment variables, suggesting that the variability in exposure was too restricted; 4+ months exposure, when given between 7.5 and 18 months of age, can be sufficient for attachment relationships (A, B, C) to develop in some children; and/or that attachment patterns are fairly persistent once established during orphanage residency (or before).
Children were to be accompanied to the attachment assessment by the caregiver who knew the child best or who had the best relationship with the child, which was a Primary Caregiver for 75% of the T+SC children. With a base rate this high, it was difficult to demonstrate that children who received A, B, or C versus D classifications were more likely to be accompanied by a Primary Caregiver or that the attachment variables were different for such a small group of children accompanied by Secondary Caregivers. For example, four out of five children with B classifications (80%) were accompanied by Primaries, but the base rate was 75%. A variety of analyses similarly failed to show any Primary–Secondary differences or interactions. Thus, either the variability in accompanying caregiver was too restricted and/or the staff was accurate in selecting the caregiver who had the best relationship with the child and a few Secondary Caregivers, who were assigned to a specific subgroup but only worked 1 day in four, nevertheless established relationships with children analogous to some grandmothers who develop good relationships with their grandchildren even though they do not see them every day.
DISCUSSION
Children in T+SC displayed a broader range of social–emotional behaviors in a free play–separation–reunion procedure that likely reflects better relationships with their caregivers than children in TO and NoI.
IAM
The preponderance of evidence suggests that for typically developing children, those exposed to the double intervention (T+SC) evidenced (1) more Positive Emotional Tone than the other groups when the caregiver was present during free play and reunions rather than during separations, (2) more Negative Emotional Tone during separations and reunions, (3) a greater Number of Different Emotions when the caregiver was present in both free play and reunions, (4) more Passivity-Activity in free play and reunion relative to separation episodes, and (5) all these effects were more clearly displayed after 9+ months than after 4−9 months of exposure to the interventions.
This pattern of results is consistent with the proposition that T+SC children indeed formed somewhat better social–emotional relationships with specific caregivers than children in the other intervention groups, and these relationships tended to take 9+ months of exposure to be clearly displayed in their behavior in this assessment (a longer exposure than was necessary for increases in general development in other domains). T+SC children were less emotionally inhibited and more willing to display emotions than children in the other groups.
T+SC children with disabilities tended to have relatively higher levels of Positive Emotional Tone, Negative Emotional Tone, and Number of Emotions after 9+ months of exposure, but they were not always significantly different from each of the other two intervention groups. The TO group, for example, had equally high Positive Emotional Tone but very low Negative Emotional Tone, but both TO and NoI had fewer Numbers of Emotions. Thus, these results were similar to those of typical children in revealing more emotional expression for T+SC children after 9 months exposure, but the patterns of significance and specific comparisons were not always consistent, partly because of small N. Again, TO children with disabilities were sometimes similar to T+SC children with disabilities, but this was less likely the case for typically developing children.
Attachment Variables
T+SC children displayed more attachment behaviors than either TO or NoI children. T+SC children were approximately 2.7 times as likely to be classified A, B, or C than children in the other BHs, and T+SC children were more than twice as likely to receive a C classification as children from the other conditions. Correspondingly, T+SC children on average had higher Proximity seeking and Contact maintaining scores and less Avoidance behaviors than children in the other conditions, and consequently very substantially higher (Proximity+Contact – Avoidance) scores; there were no significant intervention differences in Resistance. Thus, T+SC influenced directly only one of the two attachment dimensions of Fraley and Spieker (2003), although it can play a role in combination with the other dimension (see Figure 29). The increase in C as opposed to B categorizations might be expected in an orphanage environment that still had at least six caregivers per group of 5−7 children, only two of whom worked at least 5 days per week, plus a great deal of coming and going by specialized therapists and visitors. While training emphasized warm, caring, sensitive interactions between caregivers and infants, the TO did not produce differences in these attachment variables relative to the NoI condition, suggesting that a more stable, consistent, and predictable environment that supports caregiver–child interactions and relationships is necessary for caregivers and children to successfully develop relationships.
Disorganized Attachment
More than 85% of children in the TO and NoI BHs were classified as D (disorganized/disoriented), which is only slightly higher than rates in two other studies. Zeanah, Smyke, Koga, and Carlson, the Bucharest Early Intervention Project Care Group (2005) found 65.3% of children in a contemporary Bucharest orphanage were categorized as Disorganized plus 12.6% were unclassifiable using the full Strange Situation Procedure. Vorria et al. (2003) categorized 66% of Greek institutionalized children 11−17 months of age to be Disorganized and 8% were unclassifiable. These three studies are consistent in showing high rates of disorganized (D) attachment in children residing in orphanages that typically have large group size (10−12+), many caregivers (9−12+over a week), caregiver:child ratios of approximately 4−6:1 at any one time during the day, and caregivers who are or are not encouraged to develop a relationship with specific children.
Factors that relate to disorganized attachment in parent-reared children may also pertain to orphanage children. While only an average of 15% of parent-reared children have disorganized attachments, the average over studies of maltreated (including extremely neglected) children is approximately 48% (van IJzendoorn, Schuengel, & Bakermans-Kranenburg, 1999) and as high as 80% in single studies (Barnett, Ganiban, & Cicchetti, 1999; Beeghley & Cicchetti, 1994; Carlson, Cicchetti, Barnett, & Braunwald, 1989; Cicchetti & Barnett, 1991). Other factors that contribute to disorganized attachment in parent-reared children include prolonged or repeated separation from caregivers (Jacobsen & Miller, 1999; Solomon & George, 1999), hostile and intrusive caregiving (Carlson, 1998; Lyons-Ruth, Repacholi, McLeod, & Silva, 1991), maternal alcoholism and depression which may contribute to maltreatment and neglect (DeMulder & Radke-Yarrow, 1991; Lyons-Ruth, Connell, Grunebaum, & Botein, 1990; Teti, Gelfand, Messinger, & Isabella, 1995), and prenatal exposure to alcohol (O'Connor, Sigman, & Brill, 1987) and drugs (Rodning, Beckwith, & Howard, 1991). All of these factors are prevalent in the backgrounds and rearing environments of orphanage children (see Chapter II; St. Petersburg–USA Orphanage Research Team, 2005).
Conversely, secure attachment (B), which is rare in the three orphanage studies, is promoted in parent-reared children by parent–child interactions conducted with sensitivity, mutuality, synchrony, stimulation, positive attitude, and emotional support from the parent (DeWolff & van IJzendoorn, 1997) and consistent, sensitive, and responsive care (Ainsworth et al., 1978), very little of which characterizes orphanage caregivers. But when the number of caregivers is reduced, caregiver-reported reactive attachment disorders in orphanage children decrease (Smyke et al., 2002).
Theoretically, there are two major related hypotheses regarding the development of disorganized attachment in parent-reared children. First, it is thought that the infant experiences the parent as frightening (Main & Hesse, 1990; van IJzendoorn et al., 1999), so the infant does not approach the parent for resolution of anxiety (e.g., such as engendered in the Strange Situation Procedure) because the parent is a source of uncertainty, stress, and even fear (Lyons-Ruth, Bronfman, & Parsons, 1999; Schuengel, Bakermans-Kranenberg, & van IJzendoorn, 1999). The second hypothesis (George & Solomon, 1999) suggests that the infant's history with the parent is one of nonresponsiveness to the infant's signals, so the infant's stress or anxiety cannot be alleviated. In the case of orphanage children, it is unclear whether they perceive their caregivers as frightening, although it is possible that the intrusive caregiving practiced by some caregivers does make some children upset and at least uncertain about whether the caregiver will provide comfort. Viewed in the context of the Strange Situation, while orphanage infants are quite accustomed to caregivers leaving and returning, they are not used to being left alone or with a single stranger (i.e., our camera operator), which can be expected to produce stress in some infants. Further, because of the large number of caregivers, their inconsistency over time, variability within and between caregivers in their responses to children, and the relative lack of warm, comforting behavior by caregivers at any time, most orphanage children cannot depend on a caregiver to resolve the stress and anxiety of being left alone. Therefore, the high rate of disorganized attachment in orphanage children is potentially consistent with both hypotheses.
Appropriateness of Attachment Measures for Orphanage Children
Controversy exists about the appropriateness of classifying orphanage children using traditional attachment categories, because orphanage children are accustomed to many different caregivers, caregivers coming and going constantly throughout the day, and children exhibiting indiscriminate friendliness (MacLean, 2003; Zeanah, Smyke, & Dumitrescu, 2002). Therefore, it was important to show that the classifications, ratings, and behavioral dimensions displayed an internal consistency that approximately corresponded to that observed for parent-reared children. The observed internal consistency among these variables suggests that the modified Strange Situation procedure used in this study for institutionalized children and measures derived from it are interpretable in the usual manner.
Parameters of Attachment
There were no profound or consistent effects within T+SC for length of exposure or whether children were accompanied by a Primary or other caregiver. Apparently, 4−9 months exposure was sufficient to produce these differences in attachment variables even though 9+ months of exposure produced greater differences in caregiver and child social–emotional behaviors as measured by the PCERA and IAM. It is possible that for this age period the double separation–reunion procedure and the specific attachment variables are more sensitive to caregiver–child relationships than free play (PCERA) and general positive and negative emotional tone (IAM). Further, 4+ months of exposure, when given between 7.5 and 18 months of age and assessed at 11.5−18 months of age, can be sufficient, and once established, an attachment pattern may be relatively permanent, at least within the developmental periods covered in this analysis, so that more exposure to the intervention does not change the pattern or even overcome patterns established before the child came to the BH.
XII. SCIENTIFIC AND PRACTICAL CONCLUSIONS AND IMPLICATIONS
The theoretical premise of this project was that early experience with positive social, emotional, and relationship experiences with relatively fewer, consistent adults who interact with children in a warm, caring, sensitive, and responsive manner is crucial to the early personal–social, emotional, communication, cognitive, motor, and physical development of young children. One of the most extreme circumstances in which such early experience tends to be lacking consists of young children living in substandard orphanages. Such children may have many and changing caregivers who behave in unemotional, cold, or harsh ways with the children; direct children rather than respond to child-directed initiations; and provide unresponsive and insensitive routine care. Children residing in orphanages during the first few years of life tend to be substantially delayed in physical and behavioral development, and while they improve rapidly in most respects upon being adopted into advantaged families, they display higher rates of persistent extreme behaviors and problems than parent-reared children in the adoptive country (Gunnar, 2001; Juffer & van IJzendoorn, 2005; MacLean, 2003). Most orphanages in the literature are deficient in nearly every respect—medical care, nutrition, sanitation, equipment, toys, abuse, and neglect. So what role does the lack of social–emotional-relationship experience play apart from the other deficient aspects of these orphanages in producing the delayed development of children while in residence and perhaps the higher rates of extreme behaviors that persist after adoption into advantaged families?
The current study took advantage of orphanages (called Baby Homes [BHs]) in St. Petersburg, Russian Federation, that were acceptable with respect to medical care, nutrition, sanitation, safety, toys, equipment, and the lack of abuse, but were deficient primarily with respect to the social–emotional-relationship experience provided to young children in ways similar to many other orphanages in the literature. In this context, two interventions were implemented, both of which were designed to promote positive social–emotional-relationships and warm, sensitive, responsive caregiver–child interactions. First, training and supervision were provided in basic child development, attachment, and mental health that emphasized responsive child-directed, warm, sensitive interactions with children during routine caregiving chores and at other times. Second, structural changes created an environment in which caregiver–child relationships were more likely to be developed, because group size was reduced; Primary Caregivers were designated, one of whom was present every day during most of the children's waking hours; groups were integrated by age and disability status of children; periodic graduations to new sets of caregivers and peers were discontinued; and family hour was implemented in the morning and afternoon in which visitors were excluded and caregivers were to play with the children. One BH, received both training and structural changes (T+SC), another received training only (TO), and a third had no intervention (NoI) and conducted business as usual. Assessments documented that the interventions were successfully implemented, caregivers changed their behavior with the children on the wards, and both typically developing and children with disabilities in T+SC more than in TO and NoI improved their interactions with their caregivers and their physical and behavioral development (i.e., personal–social, emotional, fine and gross motor, adaptive, communication, and cognition).
MAJOR RESULTS
Each chapter above reports results in detail and contains some discussion and interpretation. The more general findings are summarized below, accompanied by interpretations.
Implementation of the Interventions
The interventions were implemented successfully as planned. Specifically:
Training increased the amount of information caregivers knew about early childhood development and sensitive, responsive caregiving
Caregiver scores on two equivalent and counter-balanced forms of a 40-item multiple-choice test over training content increased from 20.65 to 26.70 from pre- to posttest, an increase of 29%. The pre–post effect size (partial η2) was .66. Replacement caregivers showed similar increases with fewer hours of training. The relatively poor initial scores (about 50% correct) and substantial increase in scores reflect the initial need for training in early childhood development, mental health, and caregiving techniques. In addition to providing new information, the training also may have contributed to improving caregiver–child relationships, but structural circumstances that promoted a “more family-like environment” were additionally needed to actually change the institutional behavioral culture.
Structural changes reduced the number of caregivers per child and increased the average number of consecutive days Primary Caregivers worked
In T+SC, Primary Caregivers increased the average number of consecutive days they worked from approximately 1.2 to 3.5; the average number of caregivers per child per month was reduced from approximately 9−12 to 6; the average number of children per caregiver per month dropped from approximately 10−11 to 6; and for children who remained in residence 19+ months, the cumulative number of different caregivers they experienced was reduced from approximately 60−100 to 30+. Group sizes were cut from 10−14 to 5−7, but child–staff ratios during waking hours were reduced only moderately from approximately 4+:1 to 3:1, and integration by age and disability status was successfully implemented. While extra funds were needed to implement structural changes, especially the new staff employment regimen, all structural change components could be maintained after the project ended on the original government budget for the BH without additional resources.
Caregiver Behavior on the Wards
Caregiver behavior on the wards improved as intended.
HOME Inventory scores for T+SC caregivers improved dramatically, both Total Score and most subscales, more than in TO, which in turn increased slightly more than NoI
Increases in Total Score and subscales for T+SC had percent variance (partial η2) effect sizes of .41 and .66, respectively, more than twice the effect for TO. Structural changes provided a “more family-like environment” that permitted and encouraged caregivers to develop better social–emotional-relationships with children and implement the behaviors emphasized in training.
Scores on a special Sociability Index composed of items from the HOME pertaining to caregiver–child social interactions similarly improved for T+SC more than TO more than NoI
This indicated that the social behavior of caregivers in particular increased, a primary focus of the interventions, and it is also possible that training on other topics increased caregivers’ self-confidence that in turn supported more typical adult–child social interactions.
HOME scores for T+SC remained high over approximately 4 years
The improvements in T+SC on caregiver behavior were sustained, perhaps because the improved development of the children rewarded and maintained the increased social behavior of the caregivers (e.g., Taneja et al., 2002) and supervisors encouraged it. Also, as administrators and staff grew comfortable with structural changes, caring for children of different ages and disabilities, and working more as a team, the new “culture” of T+SC was shared by all staff who supported each other in providing more positive caregiving, which then became the standard for care in that BH. The fact that new caregivers, who received much less training, scored the same on the HOME in their first year on the job as the original caregivers who received much more extensive training, is consistent with this interpretation.
Average Total HOME scores for T+SC exceeded average rates for U.S. home and group home providers
While U.S. home care is not an especially enviable standard of quality, this result conveys that the caregiving environment of T+SC became generally comparable to or better than typical nonresidential home care in the United States, which has approximately the same number of children per group (i.e., 6) as in the T+SC BH.
T+SC caregivers personally adjusted well to the structural changes
Although caregivers initially were concerned that structural changes would produce more work and stress, just the opposite was eventually the case. Two to three years after the intervention had been implemented, T+SC caregivers reported greater reductions in job stress, anxiety, mild depression, inflexibility, work overload, difficulties working with children with disabilities, and traditional attitudes toward raising children (i.e., caregiver-directed interactions with children) than caregivers in TO and NoI. These adjustments likely derived in part from most elements of structural changes. Smaller groups and fewer children combined with age integration eliminated rushed caregiving procedures for 10−14 children (feeding, changing, toileting, etc.) and created a more relaxed, comfortable, and socially rewarding environment in which caregivers had more time for each of fewer children and could develop relationships with them. Knowledge of and experience with children with disabilities reduced the stigma and uncertainty about caring for them, so that caregivers in T+SC, each of whom cared for one or two children with disabilities, felt more comfortable with them than caregivers in TO and NoI, most of whom did not care for any child with a disability.
Children's Development
General Themes
As a result of the interventions, children improved developmentally in nearly every measured domain with minor exceptions and inconsistencies noted in previous chapters. Several general themes characterized the results for children across domains.
T+SC children generally improved more substantially than TO children, who in turn improved more than NoI children
This result parallels the amount of change in caregiver HOME behavior produced by the interventions and highlights the need to provide structural changes that support the social–emotional-relationship aims of the training, especially smaller groups of children and fewer and more consistent caregivers who can then provide more individualized, sensitive, and responsive attention to children.
While we expected T+SC caregivers and children to improve substantially and more than TO, we also expected TO to do better with typically developing children than they actually did relative to NoI. While TO care-givers improved in HOME scores from an initial deficit, they did not end up much better than NoI, and TO children similarly showed some improvement but were often more similar to NoI than to T+SC children. There are several possible explanations for TO's relatively modest improvements. First, structural changes may be necessary to implementing the training; motivating staff to interact with children in warm, sensitive, and responsive ways; developing relationships with children whom Primary Caregivers would see 5 days a week rather than only 7−8 days a month; and creating a more family-like rather than institutional culture within the BH. Second, the literature in a variety of domains suggests that training alone is indeed relatively ineffective, especially if it is not accompanied by supervision and coaching (Fixsen, Naoom, Blasé, Friedman, & Wallace, 2005; Kelley, 1999). While TO caregivers were supervised, perhaps supervisors were not as motivated without structural changes and neither supervisors nor staff implemented much of the training. Third, and more idiosyncratic and less generalizable, the staff of TO had a very high opinion of their work, they thought they knew most of what they needed (although neither their pretest nor posttest scores on training content were higher than T+SC), and they lacked a commitment to improve. This derived from having a veteran and respected director who readily praised her staff to them and to others; the Special Teachers who would become supervisors were substantially more experienced and highly regarded as being the “best” in the city; and physically the BH was the newest, most spacious, and most well appointed facility in the region which political and administrative figures regarded as a sign of “quality.” As a result, staff, especially the Special Teachers and other professionals, believed their caregiving was already high quality and they did not feel the need to change.
T+SC children tended to improve more on many measures the longer they were in the intervention
Presumably, the caregivers in T+SC behaved in developmentally appropriate ways, changing their interactions with children to match their increasing skills. When caregivers saw how these children could improve developmentally, they raised their expectations for the children and encouraged more advanced social and mental activities and achievements. Children were also older after 9+ than 4−9 months of exposure. Covarying age at initial assessment meant that the interventions had their effects regardless of children's ages. Nevertheless, the intervention could have had somewhat greater effects and standardized infant tests might be more sensitive to those effects (McCall, 1979) on somewhat older infants and toddlers.
Both typically developing and children with disabilities benefited substantially from the interventions. While children with disabilities had fewer statistically significant results because of low N, effect sizes frequently were larger than for typically developing children
This result is consistent with the literature on the benefits of early intervention and integration for children with disabilities (e.g., Buysee & Bailey, 1993; Chandler et al., 1992; Kaczmarek & Groark, 2007; McEvoy et al., 1992; Odom & Brown, 1993; Shonkoff & Phillips, 2000).
For children with disabilities, the interventions did not tend to produce effects unless children were exposed to 9+ months of the interventions
This presumably indicates that children with disabilities required a more prolonged exposure to reveal intervention effects, they needed to be somewhat older, and/or their caregivers required a longer period of time to learn to deal with these children's limitations. For example, children with disabilities are not readily accepted and integrated into St. Petersburg society, and the BH administration and staff did not expect that they could improve much developmentally. Thus, it may have taken longer for caregivers to alter their attitudes and beliefs, become confident and comfortable with such children, complement their training with experience that showed them that such children can improve, and learn how to deal with the specific skills and limitations of each child.
Specific Results
Several results were more specific to particular domains of development.
The interventions improved children's physical growth and functioning
T+SC and TO children, both typically developing and with disabilities, increased in height, weight, and chest circumference; typically developing T+SC and TO children progressively displayed fewer functional limitations; and these benefits tended to be greater the longer the children were in the intervention, especially for T+SC children. These improvements resulted from an intervention that promoted social–emotional development and relationships; no changes were made in diet, medical care, exercise regimen, or sanitation. However, no significant improvements were observed for head circumference, which is less malleable in the second year of life (D. Johnson, personal communication, October 18, 2007) and improves less than height and weight after adoption (Rutter et al., 2007; van IJzendoorn et al., 2007).
Battelle Total DQs rose substantially for T+SC children
Typically developing T+SC children increased from an average of 57 to 92 = 45 DQ points, and children with disabilities rose from 23 to 42 = 19 DQ points on average, with 27% of children with disabilities increasing more than 30 DQ points and 14% increasing more than 40 DQ points. These are among the longest gains in terms of DQ points in the literature. Partial η2 effect sizes for developmental change ranged from .29 to .45 for typically developing and .44−.73 for children with disabilities. Children with disabilities who did not increase were likely to have cerebral palsy plus microcephaly or hydrocephaly.
Consistent with the focus of the interventions, behavioral development improved most clearly for the Personal–Social subscale of the Battelle
But the interventions also produced improvements in the Motor, Communication, and Cognition subscales.
The longer typically developing children were in the T+SC intervention, the higher their Battelle scores; longer exposures to T+SC prevented declines in Battelle scores in children with disabilities
Improvements in Battelle scores occurred after initial age and initial BDI scores were covaried in cross-sectional samples, thus removing individual and BH initial differences and substantiating that the T+SC intervention was effective regardless of the children's starting age and DQ (see above for possible confounds).
In caregiver–child free play sessions, typically developing T+SC and TO children displayed a higher quality of play, alertness, and self-regulation than NoI, and T+SC children showed more positive affect, social initiative, and communication than TO and NoI
These improvements were greater the longer the children experienced the interventions. T+SC children with disabilities also displayed higher levels of these behaviors than NoI. Both T+SC and TO may have improved in quality of play, alertness, and self-regulation as a result of increased caregiver stimulation, but only T+SC improved in positive affect, social initiative, and communication perhaps as a result of better relationships with caregivers.
Following the interventions, T+SC caregivers in the free play assessment displayed more positive social–emotional engagement, responsiveness, and child-directed behaviors than caregivers in TO and NoI
The rates of these caregiver behaviors increased andremainedhighovertheprojectperiodforT+SC caregivers, but declined (engagement) or were consistently low (responsiveness, child-directed) for caregivers in TO and NoI. Presumably, TO and NoI caregivers initially displayed in these assessments the behavior they thought the project emphasized, then progressively reverted to the low-affect disengaged behavior that was typical before this project. In contrast, T+SC caregivers were rewarded by socially engaging children and maintained positive interactions.
T+SC caregiver–child dyads displayed more mutual, positive, reciprocal engagement than TO, and TO more than NoI
These differences, which were a primary aim of the interventions, were greater after longer exposures to the interventions.
In a free play–separation–reunion assessment, T+SC children's emotional behavior suggested that more of them had a better relationship with their caregivers than children in the other groups
T+SC children displayed more positive emotions, a greater number of emotions, and more activity during free play and reunions (when their caregivers were present) but not during separations, and they showed more negative emotions when their caregiver left and returned. Group differences were greater after 9+ months of exposure to the interventions. Generally, this pattern of emotional behavior is in the direction of behavior that would be expected of children with better relationships with their caregivers. T+SC children with disabilities had higher levels of positive and negative emotional tone and number of different emotions after 9 months of exposure, but they were not consistently significantly higher than the other groups.
T+SC caregivers accompanying children in the free play and reunion episodes increased in positive emotional tone, negative emotional tone, and the number of different emotions after the interventions, approximately in parallel with changes in the emotional behavior of the children
The TO and NoI caregivers declined in positive emotions after the interventions were implemented, reverting to their typically low affect style.
The attachment of T+SC children 11.5−18 months of age was substantially more likely to be categorized as Insecure-Resistant (C) and Securely-Attached (B) and substantially less likely to be considered Disorganized/Disoriented (D) than TO and NoI children
This reflects the greater likelihood that T+SC children developed some positive relationships with their caregivers. The increase in C categorizations is consistent with children who live in an environment in which there were still 6+ caregivers per month and approximately 25+ different caregivers serving children who remained in the BH for up to 18 months, plus caregivers, specialized staff, and visitors coming and going from the ward constantly.
T+SC children displayed substantially more proximity seeking and contact maintaining and less avoidance behaviors with their caregivers than did children in the other groups
These changes are consistent with their higher rates of C and B attachment categories.
Changes in the Institutional Culture
The empirical data summarized above document a variety of changes in the orphanage environment and the behavior of caregivers and children in the T+SC BH, but these data barely touch on the comprehensive qualitative transformation from an institution-like to family-like environment that occurred in T+SC. Members of the research team made periodic visits to the wards during the 5-year project period and for 2 years before and afterwards, and kept notes on their observations, which are briefly summarized in this section.
Wards and Caregivers
While T+SC wards formerly were quiet or had children crying, now they are noisy, filled with talking and excitement. Whereas children once were confined to large playpens or their cribs, now they are actively engaged with toys, their caregivers, and each other on the floor and elsewhere in their rooms. Caregivers pay individualized attention to children, frequently letting the children lead and responding to their overtures. Caregivers sit with children at mealtimes and engage them in conversation, whereas formerly they stood apart and simply watched and maintained order. The caregivers seem relaxed and to enjoy being with the children (they talk, smile, laugh and hug children); before they were dutiful, business-like, and perfunctory.
Children
Whereas T+SC children once were somber and stoic, now they are alive, constructively engaged, display a variety of emotions including smiling and laughing, and are much more cooperative and interactive with each other and their caregivers. They talk, even describe their experiences and feelings, and stereotypic self-stimulation behaviors, which were once common, have essentially disappeared. They seek out their caregivers for comfort when hurt or upset, whereas this rarely happened before. When strangers enter the room, children no longer stare at them as an object or run up to hug them in indiscriminate friendliness. Instead, toddlers are wary, they back away, and they grab the legs of their caregivers for comfort. Older children, after a few minutes of adjustment, may cautiously introduce themselves to the stranger and ask appropriate questions, whereas before they would greet the stranger with indiscriminate friendliness or point at them yelling, “Diadia” or “Teotia” (i.e., “man” “woman”). In every way, children in T+SC behave much more similarly to parent-reared children.
IMPLICATIONS
This study has several scientific and practical implications.
Scientific Implications
The results contribute to a few general conclusions.
This study, more than most in the literature, demonstrates that social–emotional-relationship neglect, a common element of many orphanages, is potentially a major contributor to children's delayed development and that improving this aspect of orphanage care can foster improved physical and behavioral development in children in most domains. Previously, the evidence for this often-voiced hypothesis has been largely circumstantial, because most orphanage environments in the literature have been deficient in many respects, not just social–emotional-relationship neglect, or the environment was not measured.
What Is the Role of Orphanage Experience?
For example, some scholars (J. McCall, 1999) point out a variety of potential confounds that characterize children who are given up to orphanages that may explain some or all of the delayed development observed in children in residence and perhaps the higher frequencies of persisting extreme behavior in such children after adoption. For example, children whose parents relinquish custody of their children to orphanages may come from a different gene pool and such children may have high rates of difficult perinatal circumstances, both of which may predispose them toward delayed development and persistent behavioral problems.
Generally, data on parents and perinatal histories of children are not mentioned or known in the studies in the literature. However, perinatal circumstances were available in the current project (St. Petersburg–USA Orphanage Research Team, 2005). While a higher than expected percentage of children residing in these orphanages had low- or very-low-birth weight, poor Apgar scores, and assisted ventilation, they constituted a minority of this orphanage population. Moreover, the exceedingly delayed physical and behavioral development of all children in these and other orphanages in the literature seems much more pervasive than the relatively fewer children who are likely to have poor genes and difficult birth circumstances. Similarly, the majority of children adopted from institutions into advantaged families catch up developmentally in many areas very quickly and achieve typical developmental levels in the long term (Gunnar, 2001; Gunnar, Van Dulmen, the International Adoption Project Team, 2007; Juffer & van IJzendoorn, 2005; MacLean, 2003; Rutter et al., 2007; van IJzendoorn & Juffer, 2006). So it seems unlikely that most delayed development in institutionalized children reflects a selected population.
Further, the adoption literature is rather consistent in demonstrating that children from globally deficient orphanages who are adopted before 6 months (Croft et al., 2007; Gunnar, 2001; MacLean, 2003; Rutter et al., 2007) and in some cases 12 months of age (Merz, 2007; Merz & McCall, 2008) are physically and behaviorally comparable to parent-reared children in the adopting culture. It is unlikely that selective adoption explains this phenomenon because information on parental genetics is typically not available to adoption agencies for most children, and many potentially adverse characteristics of children cannot be easily detected in infants 6−12 months or younger. Further, in some studies, especially those of children from globally deficient Romanian orphanages in the early 1990s, very little selective adoption occurred (Rutter et al., 2007). Many parents desired children for personal and humanitarian reasons when these children were discovered in dismal orphanages, and substantial numbers of children were adopted in short periods of time with little information about the children's background. Consequently, selective adoption seems insufficient to explain the observation that children adopted before 6−12 months do not show the persistent extreme or problem behaviors that characterize children exposed longer to orphanages.
The adoption literature also suggests a selective dose–response effect in which increased rates of some but not all extreme and problem behaviors occur the longer the child resides in the orphanage (Gunnar, 2001; MacLean, 2003). In this case, selective adoption should work against the hypothesis, because certain problem behaviors become more detectable among older children and parents may avoid adopting them.
The evidence reviewed above is mostly circumstantial, whereas the results of the current study contribute more directly to the conclusion that the behavioral environment of the orphanage is likely to be a crucial contributor to delayed development of children residing there and perhaps to long-term extreme and problem behavior after adoption. First, the interventions improved the development of both typically developing and children with several fairly severe disabilities, indicating that the nature of the orphanage environment can influence children who have no obvious limiting circumstances as well as those who do. Moreover, the intervention effect occurred after covarying the children's birth weight, Functional Ability Index, and age at initial assessment, which set of covariates was found to represent well all the perinatal variables that were uniquely available in this study. Thus, the interventions, which primarily improved the children's social–emotional-relationship experience, produced marked improvements on children's development over and above the children's ages, birth circumstances, and disability levels that otherwise might be the basis of the potential confounds of poor gene pool, damaging birth circumstances, and selective adoptions.
What Is It About the Orphanage Environment That Delays Development?
This project points more directly than previous studies to the lack of social–emotional-relationship experience of young children and the absence of physical, employment, and procedural structures to support it as the crucial corroding deficiencies that contribute to the delayed development of orphanage children (St. Petersburg–USA Orphanage Research Team, 2005). First, the orphanages in this study were acceptable with respect to medical care, nutrition, safety, sanitation, toys, equipment, and the absence of abuse; they were deficient primarily in providing very limited social–emotional-relationship experiences to young children. Nevertheless, in the absence of the interventions, children were severely delayed physically and behaviorally relative to parent-reared Russian Federation and U.S. standards (St. Petersburg–USA Orphanage Research Team, 2005) and similar to children in Tizard's study of children also reared in a relatively good orphanage but with minimal social–emotional-relationship experiences for children (e.g., Tizard & Hodges, 1978; Tizard & Rees, 1974; Tizard & Tizard, 1971). Second, the interventions focused on the caregiver–child social–emotional-relationship and warm, sensitive, responsive caregiving, and children's development improved substantiallyineverymajormeasureddomainwithnocorrespondingchanges in medical care, nutrition, safety, sanitation, and abuse. Thus, it appears that the social–emotional-relationship environment is at least a—if not the—key contributor to improving children's development in the orphanage.
Longer term, a preliminary examination of reports by highly advantaged U.S. parents who adopted from these same orphanages before these interventions (Merz, 2007; Merz & McCall, 2007, 2008) show a pattern of extreme and problem behavior on the Child Behavior Checklist similar in profile (but not always in extent) to children from globally deficient orphanages (Groze & Ileana, 1996; Gunnar, 2001; MacLean, 2003) and those from unselected institutions throughout the world (Gunnar et al., 2007). This finding parallels that of Tizard and colleagues (Tizard & Hodges, 1978; Tizard & Rees, 1974) who followed a small sample of children adopted from orphanages similar to the current BHs. This suggests that early social–emotional-relationship deficiencies are associated with persistent extreme and problem behavior. A study currently beginning will investigate whether children exposed to the T+SC intervention in this study who are placed into families in St. Petersburg and the United States will have lower rates of such extreme and problem behaviors than their TO and NoI peers.
What Is It About the Intervention That Promoted Development?
Although the intervention had many facets, it is important to speculate in the context of the literature about which components were likely to be crucial in producing the improvements in children's development.
The social nature of the intervention
Evolutionary evidence suggests that the more complex social relationships (e.g., pairwise bonding) among primates is associated with evolutionary selection favoring larger brains (i.e., neocortex) in certain primates, especially humans (Dunbar & Shultz, 2007; Silk, 2007). If “ontogeny recapitulates phylogeny,” then pair bonding, including infant–adult, may be a crucial element of early human experience. Further, Schore (1996) argued that the human infants’ affective experiences with a primary caregiver during the first and second years of life influence the pattern of activity of subcortically produced trophic bioamines, peptides, and steroids that regulate the growth and organization of the developing neocortex with lasting positive or negative consequences. In particular, stress, inconsistency, and poor affect-regulating experiences with a primary caregiver can lead to disorganized orbitofrontal organizations related to insecure attachments and higher and less regulated cortisol activity (Halligan, Herbert, Goodyer, & Murray, 2004), which has, in turn, predicted increased behavioral and emotional problems in children (Essex, Klein, Cho, & Kalin, 2002).
Moment-to-moment caregiver–child interactions
The interventions consisted of encouraging caregivers to interact in a warm, sensitive, and responsive manner, which was supported by certain structural changes that promoted relationships; caregivers were not taught specific behavioral activities, routines, or programs. Thus, a behavioral attitude and style of interaction was encouraged (e.g., caring, contingent responsiveness, and child-directed activities) that caregivers would translate into specific interactions with children in ways that would fit their own and the children's dispositions and the circumstances of the moment.
Contingent responsiveness in child-directed interactions (Gunnar, 2001)
Early exposures to response–contingent interactions appear crucial for a variety of developmental accomplishments. For example, visual–motor development in kittens seems to require response–contingent interactions with the environment (Held & Hein, 1963); human infants require several weeks of crawling experience before they avoid the visual cliff (Campos, Bertenthal, & Kermoian, 1992); and passive exposure to language does not promote language development without contingent interaction with another speaker (e.g., Sachs & Johnson, 1976; Snow et al., 1976). Promoting child-directed interactions and caregiver responsiveness was a major reversal of the heavily caregiver-directed style pervasive in the BHs.
In broad strokes, the behavioral style of T+SC caregivers is similar to the “responsive parenting” that experimental, quasi-experimental, and naturalistic studies have found to relate to improved development in a variety of domains in parent-reared children (see Chapter I). For example, Landry et al. (2006) argued that responsive parenting is a cluster concept composed of at least four elements: (1) contingent responding in which adults respond promptly, contingently and appropriately to an infant's behavior; (2) emotional-affective support that includes warmth, smiling, the absence of harsh voices and physical intrusiveness; (3) support for infant foci of attention, in which caregivers encourage joint engagement and reciprocity in interactions with the child and maintain the infant's attention and cognitive capacities rather than redirecting the infant; and (4) language input that supports developmental needs, which may include caregivers imitating infant's vocalizations, responding to infant's and toddler's speech, and eventually carrying on meaningful conversation. These themes characterized the positive social–emotional interactions and relationships implemented in this project. Also, promoting caregiver responsiveness and caregiver–child relationships necessarily involves interactions that also stimulate language and mental development. So it is not surprising that the literature on responsive parenting as well as the results of this study show developmental benefits in children's cognition and communication as well as social–emotional development.
Consistent sensitive caregiving (i.e., detecting and responding appropriately to the infant's cues)
The development of attachment seems to benefit from consistent and sensitive caregiving for the child to build a working model of expectations regarding caregiver behavior and comforting in stressful situations (e.g., DeWolff & van IJzendoorn, 1997). Both the training and the structural changes of reducing the number of different caregivers and assigning Primary Caregivers who were consistently present during the children's waking hours promoted this theme. Who knows how many more children would have benefited if the number of caregivers had been reduced even further than was done in this study.
Developmental timing
Attachment theory has long emphasized the period between approximately 8−18 months of age as being most important for the development of primary attachments. Further, the literature on adoption of previously institutionalized children shows that institutionalization that ends by 6 months or in some cases 12 months does not have deleterious longer-term effects on problem behavior, but institutionalization after 6−12 months does and prolonged institutionalization does not increase the rates of problem behaviors (Croft et al., 2007; Gunnar, 2001; MacLean, 2003; Merz & McCall, 2007, 2008; Rutter et al., 2007). This observation is consistent with a sensitive period between 6/12 and perhaps 18/24 months. Although the benefits of the intervention in this project were demonstrated over and above age at first assessment, most of the children experienced the intervention after 6 months but before 18 months, and those exposed to 9+ months of the intervention—who benefited most from it—were more likely to have experienced it during this developmental window.
Supportive work environment and circumstances (i.e., structural changes)
Structural changes, with its greater consistency of fewer caregivers, promoted sensitive and responsive interactions and especially caregiver–child relationships. While there may have been some idiosyncratic factors that limited improvement in TO, the literature on training in a variety of contexts (Fixsen et al., 2005) including early childhood settings (Kelley, 1999) indicates that training alone is relatively ineffective in changing behaviors. Either systematic supervision (Kelley, 1999), coaching (Fixsen et al., 2005), or work circumstances (Love et al., 1996) that permit or encourage implementation are required. Structural changes removed barriers to developing relationships (e.g., infrequent contact with the same children), which may have motivated T+SC caregivers to be more sensitive and responsive as well as providing the opportunity to develop relationships.
Could structural changes without training have produced the same outcomes? On the one hand, frequent contact with the same few caregivers who remain caregiver-directed, insensitive, unresponsive, and aloof seems to hold limited promise for producing the broad range of positive outcomes observed in T+SC. On the other hand, to the extent structural changes might provide “setting conditions” that “release” caregiving styles and behaviors more typical of parents with their own children, benefits might be produced. For example, Smyke et al. (2002) reduced group size and child:caregiver ratios and increased consistency of caregiver–child contact without formal training in a contemporary Bucharest orphanage and found a reduction in caregiver-reported children's reactive attachment disorders but a nonsignificant increase in reported language development. However, we suspect training that establishes clear behavioral expectations and standards that supplements appropriate structural circumstances will produce more extensive positive behavioral outcomes in children.
Each component of structural changes
Primary Caregivers, reduced group size, ending graduations, assigning substitutes to particular groups, and Family Hour all contributed to providing children with fewer, more consistent caregivers who were more motivated to behave in a warm, sensitive, responsive manner and to develop relationships with the children. Age integration also contributed to children having the same caregivers over their entire residency and caregivers having more time for individual children. Both age and disability integration provided the opportunity for children to learn from each other and likely contributed substantially to the developmental improvements in children with disabilities.
Psychosocial Short Stature
The current study also provides quasi-experimental support for the psychosocial short-stature hypothesis (Blizzard, 1990; Johnson, 2000a, 2000b; Skuse et al., 1996). The social–emotional-relationship interventions alone, without changes in nutrition, medical care, and other aspects of orphanage life, led to increases in height, weight, and chest circumference but not head circumference (see Chapter VIII). Not only does this represent one of the few quasi-experimental validations of this hypothesis (e.g., Kim et al., 2003), but it contributes to the breadth of outcomes that can be influenced by early social–emotional-relationship behavioral experiences alone.
Limitations
Limitations and threats to validity of this study are discussed in Chapter III.
PRACTICAL IMPLICATIONS
This study demonstrates that orphanages can be changed in ways that benefit caregivers and children, structural changes that remove barriers and promote social–emotional-relationship experiences appear necessary as well as training, and such changes and their benefits may be maintained after implementation without additional interventions or resources. Thus, this study may have implications for changing other residential institutions in St. Petersburg, elsewhere in the Russian Federation, and throughout the world, plus it may add impetus to broadening personnel preparation and nonresidential early childhood care and education practices in the Russian Federation, the United States, and in other countries.
Implementing Changes in Orphanages
A major question facing this project was whether such substantial changes could be implemented in a well-established orphanage with a long tradition of operational practices, and, if so, what would it take to implement them successfully, which might constitute a basis for making similar changes in other institutions. In a real sense, this was a case study in planning, designing, and implementing very substantial organizational change.
Implementing the Interventions
The data are clear that the training and structural changes were successfully implemented, and caregivers and children improved substantially more under both interventions than training only. Orphanages can be improved. We speculate that several factors contributed to the successful implementation of these interventions, which are similar to those thought to be important for most major interventions in ecological contexts (Fixsen et al., 2005; Groark & McCall, 2008).
Building a partnership
As indicated in Chapter II, several years before the project began were spent building a partnership among the St. Petersburg–USA team members. This consisted of (1) the St. Petersburg Team sharing information about BH regulations and procedures and results of studies and ideas on how to improve the life of children in the BHs and (2) the U.S. Team sharing factors from the research literature that improve children's outcomes in early care settings and knowledge of intervention design and implementation, program evaluation and analysis, and American administrative and financial procedures. This laid the foundation for jointly planning and implementing the project.
St. Petersburg and U.S. professional involvement
This project was conducted by a true interdisciplinary international collaboration composed of five Co-Principal Investigators and three collaborators with the assistance of numerous others. The Team consisted of representatives from two countries and the disciplines of child development, mental health, early childhood special education, early intervention, pediatrics, early childhood care and education, research design, and statistics. The commitment of all Team members provided necessary broad-based, intense leadership and management to the project. Expertise in each area was necessary to plan and implement the project consistent with the history and policies of the BH system.
Committed, firm director
The director of the BH implementing structural changes needed to be thoroughly committed to those changes, resolute in implementing them, and intimately involved in the total operation of the BH. Staff resist change of almost any kind, concerns and complaints are common in the early phases, and some staff are unwilling or unable to change appropriately and may need to be reassigned or replaced. For these reasons, we believe the entire BH must be changed simultaneously, not ward by ward, to minimize staff conflicts. Further, if higher administrative and political figures who have controlling influence over a BH are not supportive, a diplomatic but firm director and local team members must persuade them of the project's value. Overcoming these potential obstacles requires committed leadership, an attitude that “we are going to do this so let's determine the best way,” and confidence that in the long run the changes will benefit not only the children but the caregivers. Taneja et al. (2002) also reported the benefits of a committed Director who championed the orphanage intervention.
Involving the staff
The staff of the BH must be similarly involved, so meetings were held to inform them of the general nature of the changes and to ask them how they could be implemented successfully. The project was also described to them with familiar concepts to which they could readily subscribe, such as, “love these children” and we will do it in a “family-like atmosphere.”13 Further, the director of training observed and worked on the wards with the caregivers before the interventions were started to develop a relationship of trust and to learn the demands of the caregiving job to better relate the training and structural changes to caregivers’ job responsibilities, skills, and limitations. This was followed by regular staff meetings and a supervision process that further promoted and maintained staff involvement.
Team building
Staff involvement is only the first step in team build-ing—creating an environment in which everyone feels they are playing a role in a collective effort to change the behavioral culture of the BH. Not only did the training include sessions on team building, but all levels of staff were organized into teams that met frequently to collectively implement the project and solve problems.
Supervision
Training requires supervision for it to be implemented in routine behavior on the wards, so training sessions were held on how to supervise and procedures enacted to mentor supervisors in how to encourage positive behavior in the caregiving staff. Supervision was direct but reflective, emphasized successes, and used hands-on demonstrations and trial and error.
Financial incentives
Certain financial incentives were provided to motivate staff, including a $50 bonus for passing the training course and extra salary for extra work (e.g., attending training, accompanying children to assessments, filling out data forms and questionnaires).
Can the Interventions Be Sustained?
The answer seems to be “yes.” The interventions were deliberately designed so that once implemented, they could be maintained without additional project funds and supported financially on the regular budget of the BH. While staff lamented the termination of financial add-ons when the project ended, their workload also decreased when assessments were no longer being conducted. Further, Primary Caregivers could be maintained on the BH budget by cutting their hours per week by less than 10%. Mainly, the data show caregiver behavior and child development improvements were maintained throughout the project period, and periodic observations of the research Team indicate that the changes are being maintained years after the project terminated. Not only are the caregivers rewarded for their own behavior by the improved behavior of the children, but also orphanage administrators, professionals, and staff from other BHs frequently visit the T+SC BH to observe this unique behavioral style and circumstances.
Can the Interventions Be Replicated Elsewhere?
While we have documented that a rather specific “program” (i.e., T+SC) that is well articulated can produce substantial improvements in caregivers and children, it is simplistic to assume that this “evidence-based, proven program” can be directly and easily “replicated” in another orphanage in St. Petersburg or other places. “Replicating proven programs” has become the method of choice for policy makers, funders, and practice professionals, and in some quarters it constitutes the definition of “evidence-based programming.” The Team believes this simple strategy and expectation is unrealistic (Fixsen et al., 2005; Groark & McCall, 2005). While the intervention should be the starting model to be replicated, it is shortsighted to think that it simply can be dropped into another orphanage and will be as successful as the original. For example, the process of implementation is rarely described or studied and is typically not part of the “evidence,” but it is as crucial to the outcome as the program or intervention per se (Fixsen et al., 2005). Thus, every replication of the current intervention must begin by considering the elements necessary for successful implementation that are listed above and present in the literature (Fixsen et al., 2005). If there is no prior history of collaboration among project leaders, no example of how it can work, an uncertain or weak director, unsupportive staff attitudes, no caregiver mentors available, no buy-in by higher administrators and institution professionals, and no commitment to and skill in supervising staff, successful implementation and beneficial outcomes are unlikely until these issues are resolved. Implementation is part of the intervention.
Further, interventions need to fit the situation that exists in each institution and its political, cultural, administrative, psychological, social, and financial environment (Fixsen et al., 2005). For example, each institution must assess its own training needs—caregivers may or may not need to learn (1) how to work with children with disabilities, (2) early childhood education and early intervention principles, (3) team building, (4) how to supervise staff, and so forth. Further, it might be argued that most caregivers already know how to be caring with children in warm, sensitive, responsive ways, so training in child development and responsive caregiving may be subordinate to simply getting them to do what they already know and to change the standards and expectations for caregiver behavior that contribute to the “institutional culture,” which is the primary object of change.
Implications for Foster Care
Foster care is frequently proposed as a preferred alternative to orphanages, and recent studies in Bucharest indicate that fostered children do better in many dimensions of development than do children residing in unimproved orphanages but not always as well as parent-reared children (Julian & McCall, 2008; Nelson, 2006; Nelson et al., 2007; Zeanah et al., 2003). Good-quality foster care may well be a better strategy than orphanages (e.g., Miller, Chan, Comfort, & Tirella, 2005; van Izendoorn, Luijk, & Juffer, 2007); unfortunately, many large-scale foster-care systems are not of good quality, even in the United States, which could afford it (Bishop et al., 2000). Good-quality and effective foster care requires some of the same elements of the current intervention. Foster care typically has small groups (unless foster parents take too many children to maximize the financial benefits) and age integration, and foster parents are uncertain about getting psychologically close to foster children (Heller et al., 2002), which may dampen their propensity to provide warm, affectionate, responsive care; they often express a need for training (Denby et al., 1999); foster parents must have a commitment to the children rather than just doing a job (e.g., Dozier et al., 2001); and they may require mentoring, supervision, and professional support and assistance that are more difficult to deliver to individual homes than wards in an institution. Thus, it seems many of the same elements of early care are needed by foster parents as well as orphanage caregivers. The current study suggests these elements indeed can contribute to children's development; but how these elements are supported and delivered may be different in these two contexts.
Implications for Personnel Preparation and the Operation of Nonresidential Early Childhood Care and Education
While glib generalizations should be avoided from studies on orphanages in St. Petersburg to nonresidential care and education, the current results provide complementary evidence that may add impetus and indirect support to certain practical issues in personnel preparation and the operation of early childhood facilities.
Personnel Preparation
Current personnel preparation of early childhood care and education professionals intending to serve typically developing children and especially children with disabilities in the United States, for example, tends to emphasize skill building (e.g., emerging literacy and numeracy, positioning) and to underemphasize social–emotional-relationship building (Rimm-Kaufman et al., 2003), and this imbalance may be growing in the wake of the current emphasis in the United States on preparing children academically for school success. Some scholars (Boyd et al., 2005; National Scientific Council on the Developing Child, 2004a, 2004b) have urged that social–emotional development should be emphasized to a greater extent because it is important in its own right, it may contribute to the findings that quality early care and education experiences can minimize antisocial and later delinquent behavior (Yoshikawa, 1995), and it supports mental, language, and school readiness skills. Although very different, the results of the current study are consistent with this view and support the general idea of preparing early care and education personnel more intensely and comprehensively in social–emotional development and relationship building. Skill building and social–emotional development are not separate or competing components of personnel preparation; the first emphasizes “what” and the second “how” young children are taught and cared for.
Principles of Operating Early Care and Education Services
The current study suggests that training caregivers alone, even with some degree of supervision, is less effective at improving children's development than if they are also provided an environment that encourages and supports them in implementing what they have been trained to do. The same general principle applies to nonresidential early care and education (e.g., Love et al., 1996). While most states regulate group size and child:staff ratios in early care and education services, they do not regulate or even directly encourage other components of the structural changes in this project. Moreover, these characteristics are not widely implemented even in otherwise high-quality care environments in the United States (Ritchie & Howes, 2003). For example, preschool age children may not have a primary caregiver or teacher whom they see every day, children typically “graduate” to new caregivers at least each year, and groups tend to be homogeneous with respect to age and disability status. In contrast, until the advent of group care, young children have always been in age integrated situations over the course of human history (Hartup, 1976; Konner, 1975), and the limited research available suggests there are developmental benefits of integration even across narrow age ranges (Bailey, Burchinal et al., 1993; Bailey, McWilliam et al., 1993).
While there are substantial differences in caregivers and children between the orphanages of St. Petersburg and nonresidential care and education in the United States and other countries, the current results at least suggest it is worth trying to increase emphasis on social–emotional-relationship experiences and to improve certain structural aspects of nonresidential early child care.
TABLE 18.
ANCOVA Results (F, η2) for Infant Affect Manual Rating of Negative Emotional Tone on Cross-Sectional and Longitudinal Samples of Typical Children Conducted Separately on Each Episode
| Effect | Free Play |
Separations |
Reunions |
|||
|---|---|---|---|---|---|---|
| Cross-sectionala | Longitudinalb | Cross-sectionala | Longitudinalb | Cross-sectionala | Longitudinalb | |
| Intervention Main | 1.34 (0.01) | 3.24* (0.05) | 2.57† (0.01) | 3.31* (0.05) | 5.19** (0.03) | 3.45* (0.05) |
| Intervention × Exposure | 2.52 (0.01) | 0.38 (0.01) | 2.35† (0.01) | 1.82 (0.03) | 4.46** (0.02) | 0.48 (0.01) |
| Intervention within 4−9 months | 0.15 (0.00) | 2.51† (0.04) | 0.03 (0.00) | 1.78 (0.03) | 0.80 (0.00) | 0.76 (0.01) |
| T+SC vs. TO | — | * | — | — | — | — |
| T+SC vs. NoI | — | — | — | † | — | — |
| TO vs. NoI | — | — | — | — | — | — |
| Intervention within 9+ months. | 3.04* (0.02) | 1.29 (0.02) | 4.71** (0.02) | 5.15** (0.07) | 8.47*** (0.04) | 4.87** (0.07) |
| T+SC vs. TO | * | — | ** | ** | *** | ** |
| T+SC vs. NoI | — | — | ** | ** | *** | ** |
| TO vs. NoI | * | — | — | — | — | — |
Note.
Ns: T+SC = 119, TO = 162, NoI = 142.
Ns: T+SC = 43, TO = 42, NoI = 64.
p ≤ .10
p ≤ .05
p ≤ .01
p ≤ .001; Intervention (T+SC, TO, NoI) × Exposure (4−9, 9+ months) × Age at Initial Assessment (≤ 6, >6 months) with covariates of age, Functional Abilities Index, and value of dependent variable at initial assessment conducted separately for each episode.
TABLE 19.
ANCOVA Results (F, η2) for Infant Affect Manual Rating of Number of Different Emotions on Cross-Sectional and Longitudinal Samples of Typical Children Conducted Separately on Each Episode
| Free Play |
Separations |
Reunions |
||||
|---|---|---|---|---|---|---|
| Effect | Cross-sectionala | Longitudinalb | Cross-sectionala | Longitudinalb | Cross-sectionala | Longitudinalb |
| Intervention main | 4.75** (0.02) | 10.69*** (0.14) | 1.01 (0.01) | 4.50** (0.06) | 7.11*** (0.04) | 5.84** (0.08) |
| Intervention × Exposure | 4.79** (0.02) | 0.14 (0.00) | 1.77 (0.01) | 1.74 (0.03) | 1.88 (0.01) | 0.84 (0.01) |
| Intervention within 4−9 months | 1.79 (0.01) | 5.61** (0.08) | 0.74 (0.00) | 4.61** (0.06) | 1.37 (0.01) | 4.98** (0.07) |
| T+SC vs. TO | — | ** | — | † | — | — |
| T+SC vs. NoI | — | ** | — | ** | — | ** |
| TO vs. NoI | † | — | — | — | — | — |
| Intervention within 9+ months | 7.32*** (0.04) | 4.75** (0.07) | 1.67 (0.01) | 0.87 (0.01) | 7.16*** (0.04) | 3.85* (0.05) |
| T+SC vs. TO | *** | ** | † | — | *** | ** |
| T+SC vs. NoI | ** | ** | — | — | ** | * |
| TO vs. NoI | — | — | — | — | — | — |
Note.
Ns: T+SC = 119, TO = 162, NoI = 142.
Ns: T+SC = 43, TO = 42, NoI = 64.
p ≤ .10
p ≤ .05
p ≤ .01
p ≤ .001
Intervention (T+SC, TO, NoI) × Exposure (4−9, 9+ months) × Age at Initial Assessment (≤ 6, >6 months) with covariates of age, Functional Abilities Index, and value of dependent variable at initial assessment conducted separately for each episode.
TABLE 23.
ANCOVA Results (F, % Variance) for Infant Affect Manual Rating of Negative Emotional Tone on Cross-Sectional and Longitu- dinal Samples of Children With Disabilities Conducted Separately on Each Episode
| Effect | Free Play |
Separations |
Reunions |
|||
|---|---|---|---|---|---|---|
| Cross-sectionala | Longitudinalb | Cross-sectionala | Longitudinalb | Cross-sectionala | Longitudinalb | |
| Intervention Main | 4.72** (0.13) | 3.09† (0.16) | 2.40† (0.07) | 1.11 (0.07) | 6.66** (0.17) | 2.94 (0.07) |
| Intervention × Exposure | 2.72† (0.08) | 2.56† (0.12) | 1.06 (0.03) | 8.77** (0.24) | 0.85 (0.03) | 3.66* (0.17) |
| Intervention within 4−9 months | 3.36* (0.09) | 0.99 (0.05) | 1.60 (0.05) | 2.24 (0.11) | 3.54* (0.10) | 0.28 (0.02) |
| T+SC vs. TO | — | — | — | † | — | — |
| T+SC vs. NoI | * | — | — | — | — | — |
| TO vs. NoI | * | — | † | † | ** | † |
| Intervention within 9+ months | 4.28* (0.12) | 4.80* (0.21) | 1.81 (0.05) | 3.99* (0.19) | 4.13* (0.11) | 5.40** (0.23) |
| T+SC vs. TO | ** | ** | † | ** | ** | ** |
| T+SC vs. NoI | — | — | — | — | — | — |
| TO vs. NoI | † | — | — | — | * | * |
Note.
Ns: T+SC = 39, TO = 18, NoI = 18.
Ns: T+SC = 20, TO = 8, NoI = 10.
p ≤ .15
p ≤ .05
p ≤ .01
p ≤ .001; Intervention (T+SC, TO, NoI) × Exposure (4−9, 9+ months) × Age at Initial Assessment (≤ 6, >6 months) with covariates of age, functional abilities index, and value of dependent variable at initial assessment conducted separately for each episode.
TABLE 24.
ANCOVA Results (F, η2) for Infant Affect Manual Rating of Number of Different Emotions on Cross-Sectional and Longitudinal Samples of Children With Disabilities Conducted Separately on Each Episode
| Free Play |
Separations |
Reunions |
||||
|---|---|---|---|---|---|---|
| Effect | Cross-sectionala | Longitudinalb | Cross-sectionala | Longitudinalb | Cross-sectionala | Longitudinalb |
| Intervention main | 0.30 (0.01) | 3.12† (0.16) | 1.04 (0.03) | 2.16 (0.12) | 3.39* (0.09) | 4.02* (0.20) |
| Intervention × Exposure | 2.86† (0.08) | 1.91 (0.10) | 2.63† (0.08) | 1.97 (0.10) | 1.46 (0.04) | 1.86 (0.09) |
| Intervention within 4−9 months | 1.02 (0.03) | 2.59† (0.13) | 2.05 (0.06) | 2.25 (0.11) | 1.83 (0.05) | 2.36 (0.12) |
| T+SC vs. TO | — | † | — | — | — | — |
| T+SC vs. NoI | — | — | † | † | — | † |
| TO vs. NoI | — | * | † | * | † | † |
| Intervention within 9+ months | 2.83† (0.08) | 2.06 (0.10) | 1.10 (0.03) | 1.91 (0.10) | 3.80* (0.11) | 3.02† (0.14) |
| T+SC vs. TO | * | — | — | † | * | * |
| T+SC vs. NoI | † | † | — | — | † | — |
| TO vs. NoI | — | — | — | — | — | — |
Note.
Ns: T+SC = 39, to = 18, NoI = 18.
Ns: T+SC = 20, to = 8, NoI = 10.
p ≤ .10
p ≤ .05
** p ≤ .01, ***p ≤ .001; Intervention (T+SC, to, NoI) × Exposure (4−9, 9+ months) × Age at Initial Assessment (≤ 6, >6 months) with covariates of age, Functional Abilities Index, and value of dependent variable at initial assessment conducted separately for each episode.
TABLE 25.
ANCOVA Results (F, % Variance) for Infant Affect Manual Rating of Passivity-Activity on Cross-Sectional and Longitudinal Samples of Children With Disabilities Conducted Separately on Each Episode
| Effect | Free Play |
Separations |
Reunions |
|||
|---|---|---|---|---|---|---|
| Cross-sectionala | Longitudinalb | Cross-sectionala | Longitudinalb | Cross-sectionala | Longitudinalb | |
| Intervention Main | 1.80 (0.05) | 0.42 (0.03) | 2.32 (0.07) | 1.69 (0.10) | 3.27* (0.09) | 2.63† (0.14) |
| Intervention × Exposure | 0.58 (0.02) | 0.80 (0.04) | 2.74† (0.08) | 0.44 (0.03) | 1.00 (0.03) | 3.85* (0.16) |
| Intervention within 4−9 months | 1.35 (0.04) | 0.01 (0.00) | 3.44* (0.10) | 0.86 (0.05) | 2.39† (0.07) | 0.71 (0.04) |
| T+SC vs. TO | — | — | ** | — | * | — |
| T+SC vs. NoI | — | — | — | — | — | — |
| TO vs. NoI | — | — | — | — | — | — |
| Intervention within 9+ months | 1.02 (0.03) | 0.73 (0.04) | 0.58 (0.02) | 0.36 (0.02) | 1.88 (0.06) | 2.12 (0.11) |
| T+SC vs. TO | — | — | — | — | — | * |
| T+SC vs. NoI | — | — | — | — | † | — |
| TO vs. NoI | — | — | — | — | — | — |
Note.
Ns: T+SC = 39, to = 18, NoI = 18.
Ns: T+SC = 20, to = 8, NoI = 10.
p ≤ .10
p ≤ .05
p ≤ .01
***p ≤ .001; Intervention (T+SC, to, NoI) × Exposure (4−9, 9+ months) × Age at Initial Assessment (≤ 6, >6 months) with covariates of age, Functional Abilities Index, and value of dependent variable at initial assessment conducted separately for each episode.
ACKNOWLEDGMENTS
This project was conducted by a true interdisciplinary international collaboration called The St. Petersburg–USA Orphanage Research Team composed of five Co-Principal Investigators, three collaborators, and numerous assistants and consultants. The team consisted of representatives from two countries and the disciplines of child development, early childhood special education, pediatrics, early childhood care and education, and statistics.
Listed in alphabetical order by country and individual, the team's Co-Principal Investigators were: Russian Federation—Rifkat J. Muhamedrahimov, St. Petersburg State University; Natalia V. Nikiforova, Baby Home #13; Oleg I. Palmov, St. Petersburg State University. USA—Christina J. Groark and Robert B. McCall, University of Pittsburgh Office of Child Development.
Team collaborators were: Russian Federation—Elena Vershinina, Pavlov Institute of Physiology, Russian Academy of Sciences. USA—Jacqueline L. Dempsey, Early Childhood International; Larry A. Fish, University of Pittsburgh Office of Child Development. Joy Osofsky, Louisiana State University Medical School, was a special collaborative consultant.
The team appreciates the assistance of: Russian Federation—Data Manager: Lubov Smykalo; Assessors for Children: Olga Borkovskaya, Natalya Gorbunova, Elena Mikshina, Irina Valkova; Staff Assessors: Varvara Anikina, Anna Chernakova, Marianna Mladentseva; Coders: Natalya Iskra, Valentina Ivanova, Natalya Palmova, Natalya Pleshkova, Marina Vasilieva; Technical Manager: Walter Zigle; Data Input: Irina Klimova; Secretaries: Darya Boriskina, Varvara Diment; Database Programmer: Andrey Vershinina; Scanning Programmer: Yuri Sliznikov; and Baby Home Staff Consultants: Alla Pastorova, Ludmila Istomina. USA—Database Manager: Wendy Barnard; Administrative Assistants: Mary Ellen Colella, Roger Fustich, Mary Louise Kaminski; Database Programmers: Harry Wang, Xiaoyan Zang.
The team appreciates the advice provided by numerous scholarly consultants including Mark Appelbaum, Robert Bradley, Susan Campbell, Chris Fraley, Mark Greenberg, Daniel Shaw, Megan Gunnar, Dana Johnson, Kim Chisholm MacLean, Michael Rutter, and Charles Zeanah as well as the very comprehensive, detailed, and respectful reviews of three consultants to the Monographs.
This project was made possible by the extensive cooperation of the professionals and staff of Baby Home #13, Natalia V. Nikiforova, Director; Baby Home #3, Nina Smirnova and Dmitry G. Penkov, Directors; and Baby Home #12, Valentina J. Samsonova and Svetlana Nikitina, Directors, in St. Petersburg, Russian Federation. These directors were provided administrative support by Lilia Chromova and Valentina Korablina. In addition, the following orphanage staff served as supervisors and advisors in the implementation of the T+SC interventions: Nadezhda Belova, Nadezhda Filipenko, Nina Karetnikova, Lidiya Kibaradina, Lidiya Nazarova, Tatiana Pitanova, Irina Polyanskaya, Elena Popova, Zoya Sharoikina, El'vira Vyalkova. The team appreciates the special assistance of Lilia Zigle, Director of the Center for Inclusion; and the support of Albert Krylov and Larisa Tsvetkova, Deans of the St. Petersburg State University Faculty of Psychology; Tatiana Prokof'eva, Head Pediatrician of Admiraltejsky District of St. Petersburg; and Alexandr Rjanenkov, Chairman of the St. Petersburg City Administration Labor and Social Protection Committee. We dedicate this study to the cooperation, personal adjustment, and commitment of all these professionals to improve the development of young children living in institutions in St. Petersburg, the Russian Federation, and elsewhere throughout the world. The team alone takes complete responsibility for the content of this monograph.
This project was funded by grant HD 39017, an Administrative Supplement, and a Research Supplement for Underrepresented Minorities from the U.S. Department of Health and Human Services, the National Institute of Child Health and Human Development, supplemented by a grant from the Howard Heinz Endowment of Pittsburgh. It was seeded with start-up funds from the International Assistance Group of Pittsburgh, Larisa Mason, President, Executive Director.
Footnotes
Because the Ns for typical children were substantially larger than for children with disabilities and because we expected the intervention to affect both groups similarly in direction if not magnitude, we did not include both groups of children in the same analyses and then statistically test for interactions between typical-disability children and the other factors because the power of such interaction tests would usually be extremely low. Conducting separate analyses meant that results for the two groups could not be compared statistically; instead, the direction of effects and effect sizes must be used (significance levels cannot be used because of the substantial difference in Ns).
Four months was selected as minimum exposure primarily for practical reasons. Assessments were given to children every 3 months during the first year of life, so 4 months was required for a child to have a pre- and postintervention exposure assessment. We also adopted 9+ months to define relatively longer exposure to the interventions because it gave us sufficient numbers of children in both the 4−9 and 9+ months exposure groups.
This strategy was deemed preferable to several alternatives. First, using only children who arrived after interventions were completely implemented would have reduced sample size substantially. Second, dividing children into two groups of those having their initial assessment before or after interventions were completed would have reduced cell sizes and (given our initial explorations of this possibility with Battelle scores) potentially introduced nonsystematic and uninterpretable higher-order interactions. Third, using the next assessment after the completed interventions as the initial assessment for children in residence during implementation would have meant that these children had been exposed to some of the intervention before their initial score, thus reducing sensitivity to detecting intervention effects. Fourth, the nonsystematic effects observed in the exploratory analyses called into question a simple linear relation between test interval and outcome, undermining the assumptions necessary to use it as a covariate. Moreover, such an assessment interval covariate would also be somewhat confounded with length of exposure, which would potentially remove some effect for that independent variable. Consequently, ignoring this issue and placing its variance in the error term seemed preferable.
Primary caregivers in T+SC had to have some commitment to the principles of the training and structural changes to agree to work 5 days and 40 hr per week. Some Secondary Caregivers did not like the proposed changes and quit or needed to be replaced at the beginning, producing the higher initial turnover among Secondaries in T+SC.
Means and SDs for all graphs are available at www.education.pitt.edu/OCD/publications/policyreports/means&SDs.aspx.
Effect sizes are reported for partial η2 given by SPSS. These are percent variance estimates calculated for each source in an analysis of variance with other sources partialed out. They are not the same as Cohen's effect sizes. Moreover, the total influence of an intervention may be reflected in more than one source, for example, the main effect for intervention and the Intervention × Time interaction (or at least some part of the interaction). Consequently, the total influence of the intervention may be greater than any single partial η2.
The unusual step of replacing extreme scores was taken because a few caregivers occasionally responded in rather extreme and erratic ways that were not typical of response patterns of individuals who were truly extreme. Rather than eliminating the caregiver entirely, extreme scores were replaced. While more sophisticated methods of replacing missing or extreme values are available, computing means preserved the portrait of each BH at each time point. However, such a procedure is conservative and may mask truly extreme attitudes and perceptions.
Russian growth standards for parent-reared children were available, and offered the possibility of calculating percentiles or z scores, which would have constituted an age-invariate index of relative growth. However, the age intervals used in the standards were sufficiently wide so that a child of a given height or weight who was 1 week shy of the age-span boundary might be given a percentile or z score that was very much different than the same child would receive if he were 10 days older. These differences in percentiles or z scores are made much larger when children are at the extremes of the distributions, which was often typical of BH children. Consequently, it was decided that using percentiles or z scores introduced a great deal of error in the assessment of growth in this context.
Length of exposure is also confounded with the particular ages at which children were exposed to the interventions, because children with longer exposures were more likely to be exposed at older ages. While this is a potential confound for some outcome measures, the fact that age at initial assessment was not related to the physical-growth outcomes makes it of less concern as a confound of dose–response for the physical-growth outcomes.
Means and SDs for results presented in figures can be found at www.education.pitt.edu/OCD/publications/policyreports/means&SDs.aspx
It is unclear how much of a confound this actually represents. While TO was the only home to have such a nutritional supplement, it occurred in most summers and its effects should have influenced the initial value (a covariate) as well as the outcome value and not the amount of change. Also, the diets of children were examined and found to be nutritionally adequate and children in BHs eat a substantial amount; hence, it is not clear how much “supplementation” is really needed or how much effect it might have. However, given that this was the only area in which TO seemed to do better than T+SC, it seemed necessary to mention this here.
A database in which children entered and left the BHs at varying ages and were assessed different numbers of times at different ages could be analyzed with the Growth Curve Modeling strategy of Hierarchical Linear Modeling (Bryk & Raudenbush, 1992). This approach was tried with the BDI and other outcome variables, but many models failed to converge, so this strategy was abandoned.
While we recognized that not all parents “love” their children and not every family atmosphere conforms to the intent of the interventions, these labels provided convenient, simple concepts familiar to most caregivers that communicated and provided a rationale for what the interventions were intended to be like.
REFERENCES
- Ainsworth MDS. Attachment as related to mother–infant interaction. In: Rosenblatt JS, Hinde RA, Beer C, Busnel M, editors. Advances in the study of behavior. Academic Press; New York: 1979. pp. 1–51. [Google Scholar]
- Ainsworth MDS, Bell SM, Stayton DJ. Infant mother attachment and social development: Socialization as a product of reciprocal responsiveness to signals. In: Richards MPM, editor. The integration of the child into a social world. Cambridge University Press; Cambridge, U.K.: 1974. pp. 99–135. [Google Scholar]
- Ainsworth MDS, Blehar MC, Waters E, Wall S. Patterns of attachment: A psychological study of the strange situation. Erlbaum Associates; Hillsdale, NJ: 1978. [Google Scholar]
- Alanese A, Hamill G, Jones J, Skuse DH, Matthews DR, Stanhope R. Reversibility of physiological growth hormone secretion in children with psychosocial dwarfism. Clinical Endocrinology. 1994;40(5):687–692. doi: 10.1111/j.1365-2265.1994.tb03022.x. [DOI] [PubMed] [Google Scholar]
- Alpers LH, Johnson DE, Hostetter MK, Iverson S, Miller LC. Health of children adopted from the former Soviet Union and Eastern Europe: Comparison with preadoptive medical records. JAMA. 1997;278(11):922–924. [PubMed] [Google Scholar]
- American Association of Colleges for Teachers Education . The early childhood challenge: Preparing high-quality teachers for a changing society. Author; Washington, DC: 2004. [September 10, 2008]. from http://www.aacte.org/News/Press_Room/ECEpaper.pdf. [Google Scholar]
- Ames EW, Chisholm K, Fisher L, Morison SJ, Thompson S, Mainemer H. The development of Romanian orphanage children adopted to Canada. Final report to the National Welfare Grants Program Human Resources Development Canada, Simon Fraser University; Vancouver, Canada: 1997. [Google Scholar]
- Anastasiow N, Nucci C. Yearbook in early childhood education. Teachers College Press; New York: 1994. Social, historical and theoretical foundations of early childhood special education and early intervention. [Google Scholar]
- Anderson CW, Nagle RJ, Roberts WA, Smith JW. Attachment to substitute caregivers as a function of center quality and caregiver involvement. Child Development. 1981;52:53–61. [Google Scholar]
- Avierzer O, Sagi A, Resnick G, Gini M. School competence in young adolescence: Links to early attachment relationships beyond concurrent self-perceived competence and representations of relationships. International Journal of Behavioral Development. 2002;26(1):397–409. [Google Scholar]
- Bailey DB, Burchinal MR, McWilliam RA. Age of peers and early child development. Child Development. 1993;64:848–862. doi: 10.1111/j.1467-8624.1993.tb02947.x. [DOI] [PubMed] [Google Scholar]
- Bailey DB, McWilliam RA, Ware WB, Burchinal MR. The social interactions of toddlers and preschoolers in same-age and mixed-age play groups. Journal of Applied Developmental Psychology. 1993;14:261–276. [Google Scholar]
- Bakermans-Kranenburg MJ, van IJzendoorn MH, Bradley RH. Those who have, receive: The Matthew Effect in early childhood intervention in the home environment. Review of Educational Research. 2005;75:1–26. [Google Scholar]
- Bakermans-Kranenburg MJ, van IJzendoorn MH, Juffer F. Less is more: Meta-analyses of sensitivity and attachment interventions in early childhood. Psychological Bulletin. 2003;129:195–215. doi: 10.1037/0033-2909.129.2.195. [DOI] [PubMed] [Google Scholar]
- Bakwin H. Emotional deprivation of infants. Journal of Pediatrics. 1949;35:512–521. doi: 10.1016/s0022-3476(49)80071-0. [DOI] [PubMed] [Google Scholar]
- Bandura A. Social learning theory. Prentice-Hall; Englewood Cliffs, NJ: 1977. [Google Scholar]
- Barnas M, Cummings EM. Caregiver stability and toddlers’ attachment-related behavior towards caregivers in day care. Infant Behavior and Development. 1994;17:141–147. [Google Scholar]
- Barnett D, Ganiban J, Cicchetti D. Maltreatment, negative expressivity, and the development of type D attachments from 12 to 24 months of age. Monographs of the Society for Research in Child Development. 1999;64(3):97–118. doi: 10.1111/1540-5834.00035. [DOI] [PubMed] [Google Scholar]
- Beck AT, Steer RA, Ball R, Ranier WF. Comparison of Beck Depression Inventories-IA and -II in psychiatric outpatients. Journal of Personality. 1996;567(3):588–597. doi: 10.1207/s15327752jpa6703_13. [DOI] [PubMed] [Google Scholar]
- Beck AT, Steer RA, Brown GK. Manual for the Beck Depression Inventory-II. Psychological Corp.; San Antonio, TX: 1996. [Google Scholar]
- Beck AT, Steer RA, Garbin MG. Psychometric properties of the Beck Depression Inventory: Twenty-five years of evaluation. Clinical Psychology Review. 1988;8(1):77–100. [Google Scholar]
- Beckwith L. Adaptive and maladaptive parenting: Implications for intervention. In: Meisels SJ, Shonkoff JP, editors. Handbook of early childhood intervention. Cambridge University Press; Cambridge, UK: 1990. pp. 53–77. [Google Scholar]
- Beckwith L, Rodning C. Evaluating effects of intervention with parents of preterm infants. In: Friedman S, Sigman M, editors. The psychological development of low-birthweight children: Annual advances in applied developmental psychology. Vol. 6. Ablex; Norwood, NJ: 1992. pp. 389–410. [Google Scholar]
- Beeghly M, Cicchetti D. Child maltreatment, attachment, and the self system: Emergence of an IS lexicon in toddlers at high social risk. Development and Psychopathology. 1994;6:5–30. [Google Scholar]
- Begley T. Coping strategies as predictors of employee distress and turnover after an organisational consolidation: A longitudinal analysis. Journal of Occupational and Organizational Psychology. 1998;71(4):305–329. [Google Scholar]
- Begley TM, Czajka JM. Panel analysis of the moderating effects of commitment on job satisfaction, intent to quit, and health following organizational change. Journal of Applied Psychology. 1993;78(4):552–556. doi: 10.1037/0021-9010.78.4.552. [DOI] [PubMed] [Google Scholar]
- Benoit T, Joycelyn LJ, Moddemann DM, Embree JE. Romanian adoption: The Manitoba experience. Archives of Pediatric and Adolescent Medicine. 1996;150:1278–1282. doi: 10.1001/archpedi.1996.02170370056008. [DOI] [PubMed] [Google Scholar]
- Berk LE, Winsler A. Scaffolding children's learning: Vygotsky and early childhood education. NAEYC; Washington, DC: 1995. [Google Scholar]
- Bishop SJ, Murphy JM, Hicks R, Quinn D, Lewis PJ, Grace M, et al. What progress has been made in meeting the needs of seriously maltreated children? The course of 200 cases through the Boston Juvenile Court. Child Abuse and Neglect. 2000;24:599–610. doi: 10.1016/s0145-2134(00)00125-3. [DOI] [PubMed] [Google Scholar]
- Bjorck-Akesson E, Brodin J. International diversity of toy libraries. Topics in Early Childhood Special Education. 1991;12(4):528–543. [Google Scholar]
- Blizzard RM. Psychosocial short stature. In: Lifshitz F, editor. Pediatric endocrinology. Marcel Dekker; New York: 1990. pp. 77–91. [Google Scholar]
- Bornstein MH, Tamis-LeMonda CS. Maternal responsiveness and cognitive development in children. In: Bornstein MH, editor. Maternal responsiveness: Characteristics and consequences. Jossey-Bass; San Francisco: 1989. pp. 49–61. [DOI] [PubMed] [Google Scholar]
- Bowlby J. The nature of the child's tie to his mother. International Journal of Psychoanalysis. 1958;39:350–373. [PubMed] [Google Scholar]
- Bowlby J. Attachment and loss: Vol. 1. Attachment. 2nd ed. Basic Books; New York: 1969. [Google Scholar]
- Bowman B, Donovan M, Burns M. Eager to learn: Educating our preschoolers. National Academy Press; Washington, DC: 2001. [Google Scholar]
- Boyd J, Barnett WS, Bodrova E, Leong DJ, Gomby D, Robin KB, et al. [September 10, 2008];Promoting children's social and emotional development through preschool. 2005 National Institute for Early Education Research (NIEER).from http://nieer.org/docs/index.php?DocID=125.
- Bradekamp S, Copple C. Developmentally appropriate practices in early childhood programs. Rev. ed. NAEYC; Washington, DC: 1997. [Google Scholar]
- Bradley RH. Children's home environments, health, behavior, and interventions efforts: A review using HOME inventory as a marker measure. Genetic, Social, and General Psychology Monographs. 1993;119:439–490. [PubMed] [Google Scholar]
- Bradley RH, Caldwell BM. Caregiving and the regulation of child growth and development: Describing proximal aspects of caregiving systems. Developmental Review. 1995;15:38–85. [Google Scholar]
- Bradley RH, Caldwell BM, Corwyn RF. The child care HOME inventories: Assessing the quality of family child care homes. Early Childhood Research Quarterly. 2003;18:294–309. [Google Scholar]
- Bradley RH, Corwyn RF, Burchinal M, McAdoo HP, Coll CG. The home environments of children in the United States. Part II: Relations with behavioral development through age thirteen. Child Development. 2001;72:1868–1886. doi: 10.1111/1467-8624.t01-1-00383. [DOI] [PubMed] [Google Scholar]
- Brazelton TB, Cramer BG. The earliest relationship. Parents, infants, and the drama of early attachment. Karnac Books; London: 1991. p. 252. [Google Scholar]
- Bretherton I, Waters E, editors. Growing points of attachment theory and research. Monographs of the Society for Research in Child Development. 1985;50 (Serial No. 209, Nos. 1−2) [Google Scholar]
- Bronfenbrenner U. Two worlds of childhood: U.S. and U.S.S.R. Russell Sage Foundation; New York: 1970. [Google Scholar]
- Brossard M, Decarie TG. The effects of three kinds of perceptual–social stimulation on the development of institutionalized infants: Preliminary report of a longitudinal study. Early Child Development and Care. 1971;1:111–130. [Google Scholar]
- Bryk A, Raudenbush SW. Hierarchical linear models for social and behavioral research: Applications and data analysis methods. Sage; Newbury Park, CA: 1992. [Google Scholar]
- Bryk AA, Weisberg HI. Value-added analysis: A dynamic approach to the estimation of treatment effects. Journal of Educational Statistics. 1976;1:127–155. [Google Scholar]
- Buysee V, Bailey DB. Behavioral and developmental outcomes in young children with disabilities in integrated and segregated settings: A review of comparative studies. The Journal of Special Education. 1993;26:434–461. [Google Scholar]
- Caldwell BM, Bradley RH. Home observation for measurement of the environment. University of Arkansas at Little Rock; Little Rock: 1984. [Google Scholar]
- Campos JJ, Bertenthal BI, Kermoian R. Early experience and emotional development: The emergence of wariness of heights. Psychological Science. 1992;3:61–64. [Google Scholar]
- Caplan RD, Cobb S, French JRP,, Jr., Van Harrison R, Pinneau SR,, Jr. Job demands and worker health. U.S. Department of Health, Education and Welfare; Washington, DC: 1975. [Google Scholar]
- Carlson EA. A prospective longitudinal study of attachment disorganization/disorientation. Child Development. 1998;69(4):1107–1128. [PubMed] [Google Scholar]
- Carlson EA, Sroufe AL. Contributions of attachment theory to developmental psychopathology. In: Cicchetti D, Cohen DJ, editors. Developmental psychopathology, Vol. 1. Theory and methods. Wiley; New York: 1995. pp. 581–617. [Google Scholar]
- Carlson M, Earls F. Psychological and neuroendocrinological consequences of early social deprivation in institutionalized children in Romania. Integrative neurobiology of affiliation. Annals of the New York Academy of Sciences. 1997;807:419–428. doi: 10.1111/j.1749-6632.1997.tb51936.x. [DOI] [PubMed] [Google Scholar]
- Carlson V, Cicchetti D, Barnett D, Braunwald K. Disorganized/disoriented attachment relationships in maltreated infants. Developmental Psychology. 1989;25:525–531. [Google Scholar]
- Carpenter SC, Clyman RB, Davidson AJ, Steiner JF. The association of foster care or kinship care with adolescent sexual behavior and first pregnancy. [September 10, 2008];Pediatrics. 2001 108:e46. doi: 10.1542/peds.108.3.e46. from http://www.pediatrics.org/cgi/content/full/108/3/e46. [DOI] [PubMed]
- Carson TP. Assessment of depression. In: Ciminero AR, Calhoun KS, Adams HE, editors. Handbook of behavioral assessments. 2nd ed. Wiley; New York: 1986. pp. 404–445. [Google Scholar]
- Carver CS, Pozo C, Harris SD, Noriega J, Scheier MF, Robinson DS, et al. How coping mediates the effect of optimism on distress: A study of women with early stage breast cancer. Journal of Personality and Social Psychology. 1993;65:375–390. doi: 10.1037//0022-3514.65.2.375. [DOI] [PubMed] [Google Scholar]
- Carver CS, Scheier MF. Situational coping and coping dispositions in a stressful transaction. Journal of Personality and Social Psychology. 1994;66:184–195. doi: 10.1037//0022-3514.66.1.184. [DOI] [PubMed] [Google Scholar]
- Carver CS, Scheier MF, Weintraub JK. Assessing coping strategies: A theoretically based approach. Journal of Personality and Social Psychology. 1989;56:267–283. doi: 10.1037//0022-3514.56.2.267. [DOI] [PubMed] [Google Scholar]
- Casler L. The effects of extra tactile stimulation on a group of institutionalized infants. Genetic Psychology Monographs. 1965;71:137–175. [PubMed] [Google Scholar]
- Chandler LK, Lubeck RC, Fowler SA. Generalization and maintenance of preschool children's social skills: A critical review and analysis. Journal of Applied Behavior Analysis. 1992;25:415–428. doi: 10.1901/jaba.1992.25-415. [DOI] [PMC free article] [PubMed] [Google Scholar]
- Chugani HT, Behen ME, Muzik O, Juhasz C, Nagy F, Chugani DC. Local brain functional activity following early deprivation: A study of postinstitutionalized Romanian orphans. Neuroimage. 2001;14:1290–1301. doi: 10.1006/nimg.2001.0917. [DOI] [PubMed] [Google Scholar]
- Cicchetti D, Barnett D. Toward the development of a scientific nosology of child maltreatment. In: Grove W, Cicchetti D, editors. Thinking clearly about psychology: Essays in the honor of Paul E. Meehl. University of Minnesota Press; Minneapolis: 1991. pp. 346–377. [Google Scholar]
- Clark R. The parent–child early relational assessment instrument and manual. Department of Psychiatry, University of Wisconsin Medical School; Madison, WI: 1985. [Google Scholar]
- Clark R. The parent–child early relational assessment: A factorial validity study. Educational and Psychological Measurement. 1999;59:821–846. [Google Scholar]
- Clark R, Hyde JS, Essex JJ, Klein MH. Length of maternity leave and quality of mother–infant interactions. Child Development. 1997;68:364–383. doi: 10.1111/j.1467-8624.1997.tb01945.x. [DOI] [PubMed] [Google Scholar]
- Colombo M, de la Parra A, Lopez I. Intellectual and physical outcome of children undernourished in early life is influenced by later environmental conditions. Developmental Medicine and Child Neurology. 1992;34:611–622. doi: 10.1111/j.1469-8749.1992.tb11492.x. [DOI] [PubMed] [Google Scholar]
- Crittenden PM. Organization, alternative organizations, and disorganization: Competing perspectives on the development of endangered children. Contemporary Psychology. 2001;46:593–596. [Google Scholar]
- Croft C, Beckett C, Rutter M, Castle J, Colvert E, Groothues C, et al. Early adolescent outcomes of institutionally-deprived and non-deprived adoptees. II: Language as a protective factor and vulnerable outcome. Journal of Child Psychology and Psychiatry. 2007;48(1):31–44. doi: 10.1111/j.1469-7610.2006.01689.x. [DOI] [PubMed] [Google Scholar]
- Cronbach LJ, Furby L. How we should measure “change”-or should we? Psychological Bulletin. 1970;74:68–80. [Google Scholar]
- DeKlyen M, Odom SL. Activity structure and social interaction with peers in developmentally integrated play groups. Journal of Early Intervention. 1989;13:342–351. [Google Scholar]
- DeMulder EK, Radke-Yarrow M. Attachment with affectively ill and well mothers: Concurrent behavioral correlates. Development and Psychopathology. 1991;3:227–242. [Google Scholar]
- Denby R, Rindfleisch N, Bean G. Predictors of foster parents’ satisfaction and intent to continue to foster. Child Abuse and Neglect. 1999;23(3):287–303. doi: 10.1016/s0145-2134(98)00126-4. [DOI] [PubMed] [Google Scholar]
- Dennis W, Najarian P. Infant development under environmental handicap. Psychological Monographs. 1957;71 (7, Whole No. 436) [Google Scholar]
- Dewe PH. Investigating the frequency of nursing stressors: A comparison across wards. Social Science and Medicine. 1988;26:375–380. doi: 10.1016/0277-9536(88)90403-0. [DOI] [PubMed] [Google Scholar]
- DeWolff MS, van IJzendoorn MH. Sensitivity and attachment: A meta-analysis on parental antecedents of infant attachment. Child Development. 1997;68:571–591. [PubMed] [Google Scholar]
- Division for Early Childhood (DEC) DEC recommended practices: Indicators of quality in programs for infants and young children with special needs and their families. Council for Exceptional Children; Reston, VA: 1993. [Google Scholar]
- Division for Early Childhood (DEC) National Association for the Education of Young Children (NAEYC) Association of Teacher Educators (ATE) Personnel standards for early education and early intervention: Guidelines for licensure in early childhood special education programs. Division for Early Childhood; Denver, CO: 1995. [Google Scholar]
- Dozier M, Stovall KC, Albus KE, Bates B. Attachment in infants in foster care: The role of caregiver state of mind. Child Development. 2001;72(5):1467–1477. doi: 10.1111/1467-8624.00360. [DOI] [PubMed] [Google Scholar]
- Dunbar RIN, Shultz S. Evolution in the social brain. Science. 2007;317:1344–1347. doi: 10.1126/science.1145463. [DOI] [PubMed] [Google Scholar]
- Early DM, Winton PJ. Preparing the workforce: Early childhood teacher preparation at 2- and 4-year institutions of higher education. Early Childhood Research Quarterly. 2001;16:255–306. [Google Scholar]
- Edwards CP, Raikes H. Extending the dance: Relationship-based approaches to infant/toddler care and education. Young Children. 2002;57:10–17. [Google Scholar]
- Emde RM. Infant mental health: Clinical dilemmas, the expansion of meaning, and opportunities. In: Osofsky JD, editor. Handbook of infant development. 2nd ed. Wiley; New York: 1987. pp. 1297–1320. [Google Scholar]
- Erickson M, Egeland B. Child neglect. In: Myers JB, Berliner L, Brier J, Hendrix CT, Jenny C, Reid TA, editors. The APSAC handbook on child maltreatment. 2nd ed. Sage; Thousand Oaks, CA: 2002. pp. 269–292. [Google Scholar]
- Ernst C. Are early childhood experiences overrated? A reassessment of maternal deprivation. European Archives of Psychiatry and Neurological Science. 1988;237:80–90. doi: 10.1007/BF00382371. [DOI] [PubMed] [Google Scholar]
- Essex MJ, Klein MH, Cho E, Kalin NH. Maternal stress beginning in infancy may sensitize children to later stress exposure: Effects on cortisol and behavior. Biological Psychiatry. 2002;52:776–784. doi: 10.1016/s0006-3223(02)01553-6. [DOI] [PubMed] [Google Scholar]
- Family Code of the Russian Federation supplemented and augmented. Teis; Moscow: May, 1996. [Google Scholar]
- Fiene R, Greenberg M, Bergsten M, Fegley C, Carl R, Gibbons E. The Pennsylvania Governor's Task Force early childhood quality settings study. Commonwealth of Pennsylvania; Harrisburg, PA: 2002. [Google Scholar]
- Fixsen DL, Naoom SF, Blase KA, Friedman RM, Wallace F. Implementation research: A synthesis of the literature. University of South Florida, Louis de la Parte Florida Mental Health Institute, National Implementation Research Network; Tampa, FL: 2005. (FMHI Publication #231) [Google Scholar]
- Fonagy P, Steele M, Steele H, Leigh T, Kennedy R, Mattoon G, et al. Attachment, the reflective self, and borderline states. In: Goldberg S, Muir R, Kerr J, editors. Attachment theory: Social developmental and clinical perspectives. The Academic Press; Hillsdale, NJ: 1995. pp. 233–278. [Google Scholar]
- Fonagy P, Target M, Steele M, Steele H, Leigh T, Atkinson A, et al. Crime and attachment: Morality, disruptive behavior, borderline personality, crime, and their relationships to security of attachment. In: Atkinson L, Zucker K, editors. Attachment and psychopathology. Guilford Press; New York: 1997. [Google Scholar]
- Fraley RC, Spieker SJ. Are infant attachment patterns continuously or categorically distributed? A taxometric analysis of strange situation behavior. Developmental Psychology. 2003;39(3):387–404. doi: 10.1037/0012-1649.39.3.387. [DOI] [PubMed] [Google Scholar]
- Freud A. The ego and its mechanisms of defense. Hogarth Press; London: 1937. [Google Scholar]
- Freud S. An outline of psychoanalysis. Norton; New York: 1940. [Google Scholar]
- Fried R, Mayer M. Socio-economic factors accounting for growth failure in children living in an institution. Journal of Pediatrics. 1948;33:444–451. doi: 10.1016/s0022-3476(48)80202-7. [DOI] [PubMed] [Google Scholar]
- Galiguzova LN, Mescheriakova SJ, Tcaregurodtceva LM. Psikhicheskie aspekty vospitaniya detej v domakh rebenka I detskikh domakh [Psychological aspects of children's upbringing in baby homes and children homes]. Voprosi Psychologii. 1990;6:17–25. [Google Scholar]
- Gavrin JB, Sacks LS. Growth potential of preschool-aged children in institutional care: A positive approach to a negative condition. American Journal of Orthopsychiatry. 1963;33:399–408. doi: 10.1111/j.1939-0025.1963.tb00374.x. [DOI] [PubMed] [Google Scholar]
- George C, Solomon J. Attachment and caregiving: The caregiving behavioural system. In: Cassidy J, Shaver TR, editors. Handbook of attachment: Theory, research, and clinical implications. Guilford Press; New York: 1999. pp. 649–670. [Google Scholar]
- Goldfarb W. Infant rearing and problem behavior. American Journal of Orthopsychiatry. 1943;13:249–265. [Google Scholar]
- Greenberg MT. Attachment and psychopathology in childhood. In: Cassidy J, Shaver PR, editors. Handbook of attachment: Theory, research, and clinical applications. Guilford; New York: 1999. pp. 469–496. [Google Scholar]
- Greenberg MT, Speltz ML, DeKleyen M, Endriga MC. Attachment security in preschoolers with and without externalizing behavior problems: A replication. Development and Psychopathology. 1992;3:413–430. [Google Scholar]
- Greenspan SI, Wieder S. The child with special needs: Encouraging intellectual and emotional growth. Perseus Books; Reading, MA: 1998. [Google Scholar]
- Groark CJ, McCall RB. Integrating developmental scholarship into practice and policy. In: Bornstein MH, Lamb ME, editors. Developmental psychology: An advanced textbook. 5th ed. Erlbaum Associates; Mahwah, NJ: 2005. pp. 570–601. [Google Scholar]
- Groark CJ, McCall RB. Community-based interventions and services. In: Rutter M, Bishop D, Pine D, Scott S, Stevenson J, Taylor E, Thapar A, editors. Rutter's child and adolescent psychiatry. 5th ed. Blackwell Publishing; London: pp. 971–988. in press. [Google Scholar]
- Groark CJ, Muhamedrahimov RJ, Palmov OI, Nikiforova NV, McCall RB. Improvements in early care in Russian orphanages and their relationship to observed behaviors. Infant Mental Health Journal. 2005;26(2):96–109. doi: 10.1002/imhj.20041. [DOI] [PubMed] [Google Scholar]
- Groze V, Ileana D. A follow-up study of adopted children from Romania. Child and Adolescent Social Work Journal. 1996;13:541–565. [Google Scholar]
- Grusec JE, Lytton H. Social development: History, theory, and research. Springer-Verlag; New York: 1988. [Google Scholar]
- Gunnar M. Effects of early deprivation: Findings from orphanage-reared infants and children. In: Nelson CA, Luciana M, editors. Handbook of developmental cognitive neuroscience. MIT Press; Cambridge, MA: 2001. pp. 617–629. [Google Scholar]
- Gunnar MR, Van Dulmen MHM, the International Adoption Project Team Behavior problems in postinstiutionalized internationally adopted children. Development and Psychopathology. 2007;19:129–148. doi: 10.1017/S0954579407070071. [DOI] [PubMed] [Google Scholar]
- Guralnick MJ, Connor R, Hammond M, Gottman JM, Kinnish D. Immediate effects of mainstreamed settings on the social interaction and social integration of preschool children. American Journal on Mental Retardation. 1996;100:359–377. [PubMed] [Google Scholar]
- Hakimi-Manesh Y, Mojdehi H, Tashakkori A. Short communication: Effects of environmental enrichment on the mental and psychomotor development of orphanage children. Journal of Child Psychology and Psychiatry. 1984;25(4):643–650. doi: 10.1111/j.1469-7610.1984.tb00178.x. [DOI] [PubMed] [Google Scholar]
- Halligan SL, Herbert J, Goodyer IM, Murray M. Exposure to postnatal depression predicts elevated cortisol in adolescent offspring. Biological Psychiatry. 2004;55:376–381. doi: 10.1016/j.biopsych.2003.09.013. [DOI] [PubMed] [Google Scholar]
- Hartup WW. Cross-age versus same-age peer interaction: Ethological and cross-cultural perspectives. In: Allen V, editor. Children as tutors: Theory and research on tutoring. Academic Press; New York: 1976. pp. 41–55. [Google Scholar]
- Haskins R. Beyond metaphor: The efficacy of early childhood education. American Psychologist. 1989;44(2):127–132. [Google Scholar]
- Helburn GW, Bergmann BR. America's child care problem: The way out. Foundation for Child Development; New York: 2002. [Google Scholar]
- Held R, Hein A. Movement-produced stimulation in the development of visually guided behaviour. Journal of Comparative and Physiological Psychology. 1963;56:872–876. doi: 10.1037/h0040546. [DOI] [PubMed] [Google Scholar]
- Heller SS, Smyke AT, Boris NW. Very young foster children and foster families: Clinical challenges and interventions. Infant Mental Health Journal. 2002;23:555–575. [Google Scholar]
- Hodges J, Tizard B. IQ and behavioural adjustment of ex-institutional adolescents. Journal of Child Psychology and Psychiatry. 1989a;30:53–75. doi: 10.1111/j.1469-7610.1989.tb00769.x. [DOI] [PubMed] [Google Scholar]
- Hodges J, Tizard B. Social and family relationships of ex-institutional adolescents. Journal of Child Psychology and Psychiatry. 1989b;30:77–97. doi: 10.1111/j.1469-7610.1989.tb00770.x. [DOI] [PubMed] [Google Scholar]
- Hough SD. Risk factors for the speech and language development of children adopted from Eastern Europe and the Former USSR. In: Tepper T, Sandstorm D, Hannon CL, editors. International adoption: Challenges and opportunities. Parents Network for the Post-Institutionalized Child; Meadowlands, PA: 1999. pp. 108–128. [Google Scholar]
- Howes C. Social–emotional classroom climate in child care, child–teacher relationships, and children's second grade peer relations. Social Development. 2000;9:191–204. [Google Scholar]
- Howes C, Hamilton CE. Children's relationships with caregivers. Child Development. 1992;63:859–866. doi: 10.1111/j.1467-8624.1992.tb01666.x. [DOI] [PubMed] [Google Scholar]
- Howes C, Hamilton CE. The changing experience of child care: Changes in teachers and in teacher–child relationships and children's social competence with peers. Early Childhood Research Quarterly. 1993;8:15–32. [Google Scholar]
- Howes C, Matheson CC, Hamilton CE. Maternal, teacher, and child care history correlates of children's relationships with peers. Child Development. 1994;65:264–273. doi: 10.1111/j.1467-8624.1994.tb00749.x. [DOI] [PubMed] [Google Scholar]
- Hunt JM, Mohandessi K, Ghodssi M, Akiyama M. The psychological development of orphanage-reared infants: Interventions with outcomes (Tehran). Genetic Psychology Monographs. 1976;94:177–226. [PubMed] [Google Scholar]
- Jacobsen T, Miller L. Attachment quality in young children of mentally ill mothers: Contribution of maternal caregiving abilities and foster care context. In: Solomon J, George C, editors. Attachment disorganization. Guilford Press; New York: 1999. pp. 347–378. [Google Scholar]
- Johnson DE. Long-term medical issues in international adoptees. Pediatric Annals. 2000a;29:234–241. doi: 10.3928/0090-4481-20000401-09. [DOI] [PubMed] [Google Scholar]
- Johnson DE. Medical and developmental sequelae of early childhood institutionalization in Eastern European adoptees. In: Nelson CA, editor. The effects of early adversity on neurobehavioral development. Minnesota Symposium on Child Psychology. Vol. 31. Lawrence Erlbaum; Mahwah, NJ: 2000b. pp. 113–162. [Google Scholar]
- Johnson DE. International adoption: New kids, new challenges. Pediatric Basics. 2001;94:16–28. [Google Scholar]
- Johnson DE, Alpers L, Iverson S, Mathers M, Dole K, Georgieff M, et al. Health status of US adopted Eastern European orphans. Pediatric Research. 1996;39(4):134. [Google Scholar]
- Johnson DE, Miller LC, Iverson S. The health of children adopted from Romania. Journal of the American Medical Association. 1992;268:3446–3451. [PubMed] [Google Scholar]
- Jones-Harden B. Safety and stability for foster children: A developmental perspective. Future of Children. 2004;14:31–48. [PubMed] [Google Scholar]
- Juffer F, Hoksbergen RA, Riksen-Walraven JM, Kohnstamm GA. Early intervention in adoptive families: Supporting maternal sensitive responsiveness, infant–mother attachment, and infant competence. Journal of Child Psychology and Psychiatry. 1997;38(8):1039–1050. doi: 10.1111/j.1469-7610.1997.tb01620.x. [DOI] [PubMed] [Google Scholar]
- Juffer F, Van IJzendoorn MH. Behavior problems and mental health referrals of international adoptees: A meta-analysis. Journal of the American Medical Association. 2005;293(20):2501–2515. doi: 10.1001/jama.293.20.2501. [DOI] [PubMed] [Google Scholar]
- Julian M, McCall RB. The development of children within different alternative residential care environments. 2008 Unpublished manuscript. [Google Scholar]
- Kaczmarek L, Groark CJ. Early intervention practices for children with and at risk for delays. In: Groark CJ, Mehaffie KE, McCall RB, Greenberg MT, editors. Evidence-based programs and practices for early childhood care and education. Corwin Press; Thousand Oaks, CA: 2007. pp. 25–55. [Google Scholar]
- Kaler S, Freeman B. Analysis of environmental deprivation: Cognitive and social development in Romanian orphans. Journal of Child Psychology and Psychiatry. 1994;35:769–781. doi: 10.1111/j.1469-7610.1994.tb01220.x. [DOI] [PubMed] [Google Scholar]
- Kelley S. Regulatable factors in early childhood services. Briefing Paper, University of Pittsburgh Office of Child Development; Pittsburgh, PA: Sep, 1999. [Google Scholar]
- Kim PI, Shin YH, White-Traut RC. Multisensory intervention improves physical growth and illness rates in Korean orphaned newborn infants. Research in Nursing and Health. 2003;26:424–433. doi: 10.1002/nur.10105. [DOI] [PubMed] [Google Scholar]
- Kohen-Raz R. Mental and motor development of Kibbutz, institutionalized, and home-reared infants in Israel. Child Development. 1968;39:489–503. [PubMed] [Google Scholar]
- Kojevnikova EV, Chistovich LA, Muhamedrahimov RJ. St. Petersburg infant habilitation of infants program–The first early intervention program in Russia. Pediatrics. 1995;4:112–113. [Google Scholar]
- Konius EM. The way of development of Soviet defense of motherhood and infancy (1917−1940) Central Post Graduate Medical Institute; Moscow: 1954. [Google Scholar]
- Konner M. Relations among infants and juveniles in comparative perspective. In: Lewis M, Rosenblum L, editors. Friendship and peer relations. Wiley; New York: 1975. [Google Scholar]
- Konova SR. Medical–social problems of organization of services for children in baby homes; Presented at the conference, Problems of complex rehabilitation of children brought up in baby homes, Ministry of Health and Social Development; Moscow, Russian Federation. Jun 28−29, 2005. [Google Scholar]
- Kontos S, Fiene R. Childcare quality, compliance with regulations, and children's development: The Pennsylvania study. In: Phillips DA, editor. Quality in childcare: What does research tell us. National Association for the Education of Young Children; Washington, DC: 1987. pp. 57–80. [Google Scholar]
- Kontos S, Howes C, Shinn M, Galinsky E. Quality in family child care and relative care. Teachers College Press; New York: 1995. [Google Scholar]
- Koren-Karie N, Sagi-Schwartz A, Egoz-Mizrachi N. The emotional quality of child care centers in Israel: The Haifa study of early childcare. Infant Mental Health Journal. 2005;26(2):110–126. doi: 10.1002/imhj.20039. [DOI] [PubMed] [Google Scholar]
- Kortenkamp K, Ehrle J. The well-being of children involved with the child welfare system: A national overview. The Urban Institute; Washington, DC: 2002. Series B, No. B-43. [Google Scholar]
- Kossover R. Analysis of dietary composition and nutritional adequacy in Russian orphans living in Baby Home No. 13. University of Minnesota; Minneapolis: 2004. Unpublished manuscript. [Google Scholar]
- Krauss MW, Jacobs F. Family assessment: Purposes and techniques. In: Meisels SJ, Shonkoff JP, editors. Handbook of early childhood intervention. Cambridge University Press; Cambridge, UK: 1990. pp. 305–325. [Google Scholar]
- Landry SH, Smith KE, Swank PR. Responsive parenting: Establishing early foundations for social, communication, and independent problem-solving skills. Developmental Psychology. 2006;42:627–642. doi: 10.1037/0012-1649.42.4.627. [DOI] [PubMed] [Google Scholar]
- Landry SH, Smith KE, Swank PR, Miller-Loncar CL. Early maternal and child influences on children's later independent cognitive and social functioning. Child Development. 2000;71:358–375. doi: 10.1111/1467-8624.00150. [DOI] [PubMed] [Google Scholar]
- Lewis M, Feiring C, McGuffog C, Jaskir J. Predicting psychopathology in six year olds from early social relations. Child Development. 1984;55:123–136. [PubMed] [Google Scholar]
- Libova EB. Baby homes activity in year 2004; Annual report, St. Petersburg City Administration, Committee of Health; St. Petersburg, Russian Federation. Mar 1, 2005. [Google Scholar]
- LINC Associates . The Battelle Developmental Inventory scoring booklet. Riverside; Itasca, IL: 1988. [Google Scholar]
- Love SM, Schochet PZ, Meckstroth AL. Are they in any real danger? What research does–and doesn't–tell us about child care quality and children's well-being. Mathematica Policy Research Inc.; Princeton, NJ: 1996. Unpublished manuscript. [Google Scholar]
- Lyons-Ruth K, Alpern L, Repacholi D. Disorganized infant attachment classification and maternal psychosocial problems as predictors of hostile-aggressive behavior in the preschool classroom. Child Development. 1993;64:572–585. doi: 10.1111/j.1467-8624.1993.tb02929.x. [DOI] [PubMed] [Google Scholar]
- Lyons-Ruth K, Bronfman E, Parsons E. Vondra JI, Barnett D, editors. Maternal frightened, frightening, or atypical behavior in disorganized infant attachment patterns. Atypical attachment in infancy and early childhood among children at developmental risk Monographs of the Society for Research in Child Development. 1999;64(3):67–96. doi: 10.1111/1540-5834.00034. Serial No. 258. [DOI] [PubMed] [Google Scholar]
- Lyons-Ruth K, Connell DB, Grunebaum HU, Botein S. Infants at social risk: Maternal depression and family support services as mediators of infant development and security of attachment. Child Development. 1990;61:85–98. doi: 10.1111/j.1467-8624.1990.tb02762.x. [DOI] [PMC free article] [PubMed] [Google Scholar]
- Lyons-Ruth K, Repacholi B, McLeod S, Silva E. Disorganized attachment behavior in infancy: Short-term stability, maternal and infant correlates, and risk-related subtypes. Development and Psychopathology. 1991;3:377–396. [Google Scholar]
- MacLean K. The impact of institutionalization on child development. Development and Psychopathology. 2003;15:853–884. doi: 10.1017/s0954579403000415. [DOI] [PubMed] [Google Scholar]
- Mahler M, Pine F, Bergman A. The psychological birth of the human infant. Mares Field Library; London: 1975. [Google Scholar]
- Mahoney G, Boyce G, Fewell RR, Spiker D, Wheeden CA. The relationship of parent–child interaction to the effectiveness of early intervention services for at-risk children and children with disabilities. Topics in Early Childhood Special Education. 1998;18:5–17. [Google Scholar]
- Main M, Hesse E. Parents’ unresolved traumatic experiences are related to infant disorganized attachment status: Is frightened and/or frightening parental behavior the linking mechanism? In: Greenberg MT, Cicchetti D, Cummings E, editors. Attachment in the preschool years: Theory, research, and intervention. University of Chicago Press; Chicago: 1990. pp. 161–182. [Google Scholar]
- Main M, Solomon J. Procedures for identifying infants as disorganized/disoriented during the Ainsworth Strange Situation. In: Greenberg MT, Cicchetti D, Cummings EM, editors. Attachment in the preschool years. University of Chicago Press; Chicago: 1990. pp. 161–182. [Google Scholar]
- McCall JN. Research on the psychological effects of orphanage care: A critical review. In: McKenzie RB, editor. Rethinking orphanages for the 21st century. Sage; Newbury Park, CA: 1999. pp. 127–150. [Google Scholar]
- McCall RB. The development of intellectual functioning in infancy and the prediction of later IQ. In: Osofsky JD, editor. Handbook of infant development. Wiley; New York: 1979. pp. 707–741. [Google Scholar]
- McCall RB, Larsen L, Ingram A. The science and policies of early childhood education and family services. In: Reynolds AJ, Wang MC, Walberg HJ, editors. Early childhood programs for a new century: Issues in children's and families lives. The University of Illinois at Chicago Series on Children and Youth. CWLA Press; Washington, DC: 2003. pp. 255–298. [Google Scholar]
- McCall RB, Ryan CS, Green BL. Some non-randomized constructed comparison groups for evaluating early age-related outcomes of intervention programs. American Journal of Evaluation. 1999;2(20):213–226. [Google Scholar]
- McEvoy MA, Odom SL, McConnell SR. Peer social competence interventions of young children with disabilities. In: Odom SL, McConnell SR, McEvoy MA, editors. Social competence of young children with disabilities: Issues and strategies for intervention. Brookes; Baltimore: 1992. pp. 113–133. [Google Scholar]
- Mehaffie KE, McCall RB, Groark CJ, Etheridge WE, Nelkin RP, The Universities Children's Policy Collaborative . The state of early care and education in Pennsylvania: The 2002 higher education survey. Governor's Task Force on Early Childhood Care and Education. University of Pittsburgh Office of Child Development.; Pittsburgh, PA: 2002. [September 10, 2008]. from http://www.prevention.psu.edu/ECE/ [Google Scholar]
- Merz EC. Behavior problems in children adopted from socially–emotionally depriving orphanages. University of Pittsburgh; 2007. Unpublished master's thesis. [Google Scholar]
- Merz EC, McCall RB. Behavioral functioning of children adopted from socially–emotionally depriving orphanages; Poster presented at the meetings of the Society for Research in Child Development; Boston. Mar 31, 2007. [Google Scholar]
- Merz EC, McCall RB. Behavior problems in children adopted from socially–emotionally depriving orphanages. 2008 Unpublished manuscript. [Google Scholar]
- Miller LC. International adoption, behavior, and mental health. Journal of the American Medical Association. 2005;293(20):2533–2535. doi: 10.1001/jama.293.20.2533. [DOI] [PubMed] [Google Scholar]
- Miller L, Chan W, Comfort K, Tirella L. Health of children adopted from Guatamela: Comparisons of orphanage and foster care. Pediatrics. 2005;115(6):710–717. doi: 10.1542/peds.2004-2359. [DOI] [PubMed] [Google Scholar]
- Morgan G, Fraser J. Systems for professional development in early care and education: Issues in personnel preparation. In: Groark CJ, Mehaffie KE, McCall RB, Greenberg MT, editors. Evidence-based practices and programs for early childhood care and education. Corwin Press; Thousand Oaks, CA: 2006. pp. 159–180. [Google Scholar]
- Muhamedrahimov RJ. New attitudes: Infant care facilities in St. Petersburg, Russia. In: Osofsky JD, Fitzgerald HE, editors. WAIMH handbook of infant mental health. Vol. 1. Perspectives on infant mental health. Wiley; New York: 1999. pp. 245–294. [Google Scholar]
- Muhamedrahimov RJ, Palmov OI, Istomina LA. The Functional Abilities Index. Authors; St. Petersburg, Russian Federation: 2000. Unpublished manual. [Google Scholar]
- Muhamedrahimov RJ, Palmov OI, Nikiforova N. Va. Infant–infant interaction in orphanage. In: Guedeney A, de Chateau P, Kaukonen P, Tamminen T, editors. World Association for Infant Mental Health Conference abstracts. Vammalan Kirjapaino Oy; Tampere, Finland: 1996. p. 152. [Google Scholar]
- Muhamedrahimov RJ, Palmov OI, Nikiforova NV, Groark CJ, McCall RB. Institution-based early intervention program. Infant Mental Health Journal. 2004;25(5):488–501. [Google Scholar]
- National Scientific Council on the Developing Child [September 14, 2007];Young child in an environment of relationships. 2004a Working paper #1. from http://www.developingchild.net/pubs/wp/Young_Children_Environment_Relationships.pdf.
- National Scientific Council on the Developing Child [September 14, 2007];Children's emotional development is built into the architecture of their brains. 2004b Working paper #2. from http://www.developingchild.net/pubs/wp/Childrens_Emotional_Development_Architecture_Brains.pdf.
- Nelson CA. The effects of early experience on brain-behavioral development: The Bucharest Early Intervention Project. Colloquium, University of Pittsburgh; Pittsburgh, PA: Jan. 6, 2006. [Google Scholar]
- Nelson CA, Zeanah CH, Fox NA, Marshall PJ, Smyke AT, Guthrie D. Cognitive recovery in socially deprived young children: The Bucharest early intervention project. Science. 2007;318:1934–1940. doi: 10.1126/science.1143921. [DOI] [PubMed] [Google Scholar]
- NICHD Early Child Care Research Network The effects infant child care on infant–mother attachment security: Results of the NICHD study of early child care. Child Development. 1997;68:860–879. doi: 10.1111/j.1467-8624.1997.tb01967.x. [DOI] [PubMed] [Google Scholar]
- NICHD Early Child Care Research Network Characteristics and quality of child care for toddlers and preschoolers. Applied Developmental Science. 2000;4:116–135. [Google Scholar]
- NICHD Early Child Care Research Network Child care and children's peer interaction at 24 and 36 months: The NICHD study of early child care. Child Development. 2001;72:1478–1500. doi: 10.1111/1467-8624.00361. [DOI] [PubMed] [Google Scholar]
- O'Connor MJ, Sigman M, Brill N. Disorganization of attachment in relation to maternal alcohol consumption. Journal of Consulting and Clinical Psychology. 1987;55:831–836. doi: 10.1037//0022-006x.55.6.831. [DOI] [PubMed] [Google Scholar]
- Odom SL, Bailey DB. Inclusive preschool programs: Classroom ecology and child outcomes. In: Guralnick MJ, editor. Early childhood inclusion: Focus on change. Brookes; Baltimore: 2001. pp. 253–291. [Google Scholar]
- Odom SL, Brown WH. Social interaction skills interventions for young children with disabilities in integrated settings. In: Peck CA, Odom SL, Bricker DD, editors. Integrating young children with disabilities into community programs: Ecological perspectives on research and implementation. Brookes; Baltimore: 1993. pp. 39–64. [Google Scholar]
- Oppenheim D, Sagi A, Lamb ME. Infant–adult attachments on the kibbutz and their relation to socioemotional development 4 years later. Developmental Psychology. 1988;24:427–433. [Google Scholar]
- Osofsky JD. The effects of exposure to violence on young children. American Psychologist. 1995;50(9):782–788. doi: 10.1037//0003-066x.50.9.782. [DOI] [PubMed] [Google Scholar]
- Osofsky JD, Connors K. Mother–infant interaction: An integrative view of a complex system. In: Osofsky JD, editor. Handbook of infant development. Wiley; New York: 1979. pp. 519–548. [Google Scholar]
- Osofsky JD, Culp AM, Hann DM, Carter SL. Infant affect manual. Louisiana State University Medical School; New Orleans: 1988. Unpublished manuscript. [Google Scholar]
- Osofsky JD, Muhamedrahimov RJ, Hammer BA. The infant affect manual. LSU Medical School; New Orleans, LA: 1998. [Google Scholar]
- Peters DL, Pence AR, editors. Family day care: Current research for informed public policy. Teachers College Press; New York: 1992. [Google Scholar]
- Peterson NL. Early intervention for handicapped and at-risk children. Love Publishing Company; Denver, CO: 1987. [Google Scholar]
- Pettit GS, Bates JE, Dodge KE. Support of parenting, ecological context, and children's adjustment: A seven-year longitudinal study. Child Development. 1997;68:908–923. doi: 10.1111/j.1467-8624.1997.tb01970.x. [DOI] [PubMed] [Google Scholar]
- Pew Charitable Trusts . Foster care: Voices from the inside. The Pew Charitable Trusts; Philadelphia: 2004. [Google Scholar]
- Posada G, Jacobs A, Richmond MK, Carbonell OA, Alzate G, Bustamante MR, et al. Maternal care giving and infant security in two cultures. Developmental Psychology. 2002;38:67–78. doi: 10.1037//0012-1649.38.1.67. [DOI] [PubMed] [Google Scholar]
- Provence S, Lipton RC. Infants in institutions: A comparison of their development with family reared infants during the first year of life. International Universities Press; New York: 1962. [Google Scholar]
- Ramey SL, Ramey CT. Early educational intervention with disadvantaged children: To what effect? Applied and Preventive Psychology. 1992;1:131–140. [Google Scholar]
- Ransel DL. Mothers of misery: Child abandonment in Russia. Princeton University Press; Princeton, NJ: 1988. [Google Scholar]
- Rashkovich MP. Towards the question of providing for foundling children by the public foundations. Proceedings of the Fourth Congress of Russian Doctors. Pechatnya S. P. Yakovleva; Moscow: 1892. pp. 296–316. [Google Scholar]
- Rheingold HL. The modification of social responsiveness in institutional babies. Monographs of the Society for Research in Child Development. 1956;21 Serial No. 63, No. 2. [Google Scholar]
- Rheingold HL, Bayley N. The later effects of an experimental modification of mothering. Child Development. 1959;30:363–372. [Google Scholar]
- Richter L, Dev Griesel R, Manegold J. The importance of caregiver–child interactions for the survival and healthy development of young children: A review. Department of Child and Adolescent Health and Development, World Health Organization; Geneva, Switzerland: 2004. [September 10, 2008]. from http://www.who.int/child-adolescent-health. [Google Scholar]
- Rimm-Kaufman SE, Voorhees MD, Snell ME, LaParo KM. Improving the sensitivity and responsivity of preservice teachers toward young children with disabilities. Topics in Early Childhood Special Education. 2003;23:151–163. [Google Scholar]
- Ritchie S, Howes C. Program practices, caregiver stability, and child–caregiver relationships. Applied Developmental Psychology. 2003;24:497–516. [Google Scholar]
- Rodning C, Beckwith L, Howard J. Quality of attachment and home environments in children prenatally exposed to PCP and cocaine. Development and Psychopathology. 1991;3:351–366. [Google Scholar]
- Rodulovich VI. On the care of abandoned children in general and for those in the Orel municipal orphanage in particular. Proceedings of the Fourth Congress of Russian Doctors. Pechatnya S. P. Yakovleva; Moscow: 1892. pp. 290–295. [Google Scholar]
- Rosas J, McCall RB. Characteristics of institutions and resident children's development. 2008 Unpublished manuscript. [Google Scholar]
- Rothbaum F, Weisz JR. Parental care giving and child externalizing behavior in non-clinical samples: A meta-analysis. Psychological Bulletin. 1994;116:55–74. doi: 10.1037/0033-2909.116.1.55. [DOI] [PubMed] [Google Scholar]
- Russian Federation . On childhood conditions in the Russian Federation (1993): Government Report. Russian Federation; Moscow: 1994. [Google Scholar]
- Rutter M. Psychosocial influences: Critiques, findings, and research needs. Development and Psychopathology. 2000;12:265–296. doi: 10.1017/s0954579400003072. [DOI] [PubMed] [Google Scholar]
- Rutter M, Beckett C, Castle J, Colvert E, Kreppner J, Mehta M, et al. Effects of profound early institutional deprivation: An overview of findings from a UK longitudinal study of Romanian adoptees. European Journal of Developmental Psychology. 2007;4(3):332–350. [Google Scholar]
- Rutter M, Colvert E, Kreppner J, Beckett C, Castle J, Groothues C, et al. Early adolescent outcomes for institutionally deprived and non-deprived adoptees. I: Dis-inhibited attachment. Journal of Child Psychology and Psychiatry. 2007;48(1):17–30. doi: 10.1111/j.1469-7610.2006.01688.x. [DOI] [PubMed] [Google Scholar]
- Rutter M, the English and Romanian Adoptees. (ERA) Study Team Developmental catch-up, and deficit, following adoption after severe global early privation. Journal of Child Psychology and Psychiatry. 1998;39(4):415–476. [PubMed] [Google Scholar]
- Rutter M, Kreppner JM, O'Connor T, the English Romanian Adoption Studies Team Specificity and heterogeneity in children's responses to profound institutional privation. British Journal of Psychiatry. 1998;179:97–103. doi: 10.1192/bjp.179.2.97. [DOI] [PubMed] [Google Scholar]
- Sachs JS, Johnson M. Language development in a hearing child of deaf parents. In: von Raffler Engel W, LeBrun Y, editors. Baby talk and infant speech (Neurolinguistics 5) Swets & Zeitlinger; Amsterdam, NE: 1976. pp. 246–252. [Google Scholar]
- Safford P, Sargent M, Cook C. Instructional models in early childhood special education: Origins, issues and trends. In: Safford P, editor. Early childhood special education: Yearbook in early childhood education. Vol. 5. Teachers College Press; New York: 1994. pp. 96–117. [Google Scholar]
- Sagi A, Koren-Karie N, Gini M, Ziv Y, Joels T. Shedding further light on the effects of various types and quality of early childcare on infant–mother attachment relationship: The Haifa study of early childcare. Child Development. 2002;73:1166–1186. doi: 10.1111/1467-8624.00465. [DOI] [PubMed] [Google Scholar]
- Sayegh Y, Dennis W. The effect of supplementary experiences upon the behavioral development of infants in institutions. Child Development. 1965;36:81–90. [PubMed] [Google Scholar]
- Schaefer E, Edgerton M. Parent and child correlates of parental modernity. In: Siegel EI, editor. Parental belief systems. Erlbaum; Hillsdale, NJ: 1985. pp. 287–318. [Google Scholar]
- Schaffer HR. Objective observations of personality development in early infancy. British Journal of Medical Psychology. 1958;31:174–183. doi: 10.1111/j.2044-8341.1958.tb01965.x. [DOI] [PubMed] [Google Scholar]
- Schore AN. The experience-dependent maturation of a regulatory system in the orbital prefrontal cortex and the origin of developmental psychopathology. Development and Psychopathology. 1996;8:59–87. [Google Scholar]
- Schuengel C, Bakermans-Kranenberg MJ, van IJzendoorn MH. Frightening maternal behavior linking unresolved loss and disorganized attachment behavior. Journal of Consulting and Clinical Psychology. 1999;67:54–63. doi: 10.1037//0022-006x.67.1.54. [DOI] [PubMed] [Google Scholar]
- Schuengel C, Bakermans-Kranenberg MJ, van IJzendoorn MH. Set for success: Building a strong foundation for school readiness based on the social–emotional development of young children. The Ewing Marion Kaufman Foundation; Kansas City, MO: 2004. [September 10, 2008]. from http://www.kauffman.org/pdf/ecx-summary.pdf. [Google Scholar]
- Shaw DS, Owens EB, Vondra JI, Keenan K, Winslow EB. Early risk factors and pathways in the development of early disruptive behavior problems. Development and Psychopathology. 1997;8:679–700. [Google Scholar]
- Shonkoff J, Phillips DA. From neurons to neighborhoods. National Academy of Sciences; Washington, DC: 2000. [PubMed] [Google Scholar]
- Shonkoff JP, Hauser-Cram P, Krauss MW, Upshur CC. Development of infants with disabilities and their families: Implications for theory and service delivery. Monographs of the Society for Research in Child Development. 1992;57(6) Serial No. 230. [PubMed] [Google Scholar]
- Silk JB. Social components of fitness in primate groups. Science. 2007;317:1347–1351. doi: 10.1126/science.1140734. [DOI] [PubMed] [Google Scholar]
- Simeonsson RJ, Bailey DB. Essential elements of the assessment process. In: Wachs TD, Sheehan B, editors. Assessment of developmentally disabled infants and preschool children. Plenum Press; New York: 1988. pp. 25–41. [Google Scholar]
- Simeonsson RJ, Bailey DB. Abilities Index–Modified. Frank Porter Graham Child Development Center, University of North Carolina; Chapel Hill: 1991. [Google Scholar]
- Skeels HM, Dye HA. A study of the effects of differential stimulation in mentally retarded children. Proceedings of the American Association of Mental Deficiency. 1939;44:114–136. [Google Scholar]
- Skuse D, Albanese A, Stanhope R, Gilmour J, Voss L. A new stress-related syndrome of growth failure and hyperphagia in children, associated with reversibility of growth-hormone insufficiency. Lancet. 1996;348:353–358. doi: 10.1016/s0140-6736(96)01358-x. [DOI] [PubMed] [Google Scholar]
- Sloutsky VM. Institutional care and developmental outcomes of 6- and 7-year-old children: A conceptualist perspective. International Journal of Behavioral Development. 1997;20(1):131–151. [Google Scholar]
- Smith BJ, Miller PS, Bradekamp S. Sharing responsibility: DEC-, NAEYC-, and Vygotsky-based practices for quality inclusion. Young Exceptional Children. 1998;2:11–20. [Google Scholar]
- Smyke AT, Dumitrescu ABA, Zeanah CH. Attachment disturbances in young children. I: The continuum of caretaking casualty. Journal of the American Academy of Child and Adolescent Psychiatry. 2002;41:972–982. doi: 10.1097/00004583-200208000-00016. [DOI] [PubMed] [Google Scholar]
- Smyke AT, Koga SFM, Johnson DE, Zeanah CH, the BEIP Core Group . The caregiving context in institution reared and family reared infants and toddlers in Romania. Tulane University; New Orleans, LA: 2004. [DOI] [PubMed] [Google Scholar]
- Snow CE, Arlman-Rupp A, Hassing Y, Jobse J, Joosten J, Vorster J. Mother's speech in three social classes. Journal of Psycholinguistic Research. 1976;5:1–20. [Google Scholar]
- Solomon J, George C. The development of attachment in separated and divorced families: Effects of overnight visitation, parent, and couple variables. Attachment and Human Development. 1999;1:2–33. doi: 10.1080/14616739900134011. [DOI] [PubMed] [Google Scholar]
- Solomon RL, Leesac MS. A control group design for experimental studies of developmental processes. Psychological Bulletin. 1968;70:145–150. doi: 10.1037/h0026147. [DOI] [PubMed] [Google Scholar]
- Sparling J, Dragomir C, Ramey SL, Florescu L. An educational intervention improves developmental progress of young children in a Romanian orphanage. Infant Mental Health Journal. 2005;26(2):127–142. doi: 10.1002/imhj.20040. [DOI] [PubMed] [Google Scholar]
- Sparling JJ, Lewis I, Ramey CT. Partners for learning: Birth to 36 months. Kaplan Press; Lewisville, NC: 1995. [Google Scholar]
- Speltz ML, Greenberg MT, DeKleyen M. Attachment in preschoolers with disruptive behavior: A comparison of clinic-referred and non-problem children. Development and Psychopathology. 1990;2:31–46. [Google Scholar]
- Spielberger CD. Manual for the State-Trait Anxiety Inventory. Consulting Psychologists Press; Palo Alto, CA: 1983. [Google Scholar]
- Spitz R. Anaclitic depression: An inquiry into the genesis of psychiatric conditions in early childhood-II. The Psychoanalytic Study of the Child. 1945;2:313–342. [PubMed] [Google Scholar]
- Sroufe LA. Infant–caregiver attachment and patterns of adaptation in preschool: The roots of maladaptation and competence. In: Perlmutter M, editor. Minnesota Symposium on Child Psychology. Vol. 16. Erlbaum Associates; Hillsdale, NJ: 1983. pp. 41–81. [Google Scholar]
- Sroufe LA, Carlson EA, Levy AK, Egeland B. Implications of attachment theory for developmental psychopathy. Development and Psychopathy. 1999;11:1–13. doi: 10.1017/s0954579499001923. [DOI] [PubMed] [Google Scholar]
- St. Petersburg State Pediatric Medical Academy . Assessment of main anthropometrical items and some physiological parameters of children in North-Western Region. Author; St. Petersburg, Russian Federation: 2000. [Google Scholar]
- Stams G-JJM, Juffer F, van IJzendoorn MH. Maternal sensitivity, infant attachment, and temperament in early childhood predict adjustment in middle childhood: A case of adopted children and their biologically unrelated parents. Developmental Psychology. 2002;38:806–821. doi: 10.1037//0012-1649.38.5.806. [DOI] [PubMed] [Google Scholar]
- Steelman LM, Assel MA, Swank PR, Smith KE, Landry SH. Early maternal warm responsiveness as a predictor of child social skills: Direct and indirect paths of influence over time. Applied Developmental Psychology. 2002;23:135–156. [Google Scholar]
- Steer RA, Beck AT, Garrison B. Applications of the Beck Depression Inventory. In: Sartorius N, Ban TA, editors. Assessment of depression. Springer-Verlag; New York: 1986. pp. 123–142. [Google Scholar]
- Stern DN. The interpersonal world of the infant. A view from psychoanalysis and developmental psychology. Basic Books; New York, NY: 1985. [Google Scholar]
- Strain PS, McConnell SR, Carta JJ, Fowler SA, Neisworth JT, Wolery M. Behaviorism in early intervention. Topics in Early Childhood Special Education. 1992;12:121–141. [Google Scholar]
- Taneja V, Sriram S, Beri RS, Sreenivas V, Aggarwal R, Kaur R, et al. ‘Not by bread alone’: Impact of a structured ninety-minute play session on development of children in an orphanage. Child: Care, Health and Development. 2002;28(1):95–100. doi: 10.1046/j.1365-2214.2002.00246.x. [DOI] [PubMed] [Google Scholar]
- Teti DM, Gelfand DM, Messinger D, Isabella R. Maternal depression and the quality of early attachment: An examination of infants, preschoolers, and their mothers. Developmental Psychology. 1995;31:364–376. [Google Scholar]
- Tharp-Taylor ST. The effects of early social deprivation on children reared in foreign orphanages. University of Pittsburgh; Pittsburgh, PA: 2003. Unpublished manuscript. [Google Scholar]
- The St. Petersburg-USA Orphanage Research Team Characteristics of children, caregivers, and orphanages for young children in St. Petersburg, Russian Federation. Journal of Applied Developmental Psychology: Special Issue on Child Abandonment. 2005;26:477–506. [Google Scholar]
- Tizard B, Hodges J. The effect of early institutional rearing on the development of eight-year-old children. Journal of Child Psychology and Psychiatry. 1978;19:99–118. doi: 10.1111/j.1469-7610.1978.tb00453.x. [DOI] [PubMed] [Google Scholar]
- Tizard B, Rees J. A comparison of the effects of adoption, restoration to the natural mother, and continued institutionalization on the cognitive development of four-year-old children. Child Development. 1974;45:92–99. [PubMed] [Google Scholar]
- Tizard B, Rees J. The effect of early institutional rearing on the behavior problems and affectual relationships of four-year-old children. Journal of Child Psychology and Psychiatry. 1975;16:61–73. doi: 10.1111/j.1469-7610.1975.tb01872.x. [DOI] [PubMed] [Google Scholar]
- Tizard J, Tizard B. The social development of two-year-old children in residential nurseries. In: Schaffer HR, editor. Origins of human social relations. Academic Press; New York: 1971. pp. 147–163. [Google Scholar]
- U.S. Government Accounting Office . Foster parents recruiting and preservices training practices need evaluation. GAO; Washington, DC: 1989. Report to Congressional Requesters from Linda Morra, Director of Select Congressional Studies (GAO/HRD-89−86) [Google Scholar]
- U.S. Government Accounting Office . Foster care services to prevent out of home placement limited by barriers. GAO; Washington, DC: 1993. Report to the Chairman, Subcommittee on Oversight of Government Management, Committee on Governmental Affairs, US Senate (GAO/HRD-93−76) [Google Scholar]
- van IJzendoorn MH, Bakermans-Kranenburg MJ, Juffer F. Plasticity of growth in height, weight and head circumference: Meta-analytic evidence for massive catch-up after international adoption. Journal of Developmental and Behavioral Pediatrics. 2007;28(4):334–343. doi: 10.1097/DBP.0b013e31811320aa. [DOI] [PubMed] [Google Scholar]
- van IJzendoorn MH, Juffer F. The Emanuel Miller Memorial Lecture 2006: Adoption as intervention. Meta-analytic evidence for massive catch-up and plasticity in physical, socio-emotional, and cognitive development. Journal of Child Psychology and Psychiatry. 2006;47(12):1228–1245. doi: 10.1111/j.1469-7610.2006.01675.x. [DOI] [PubMed] [Google Scholar]
- van IJzendoorn MH, Juffer F, Poelhuis CWK. Adoption and cognition development: A meta-analytic comparison of adopted and nonadopted children's IQ and school performance. Psychological Bulletin. 2005;131(2):301–316. doi: 10.1037/0033-2909.131.2.301. [DOI] [PubMed] [Google Scholar]
- van IJzendoorn MH, Luijk MPCM, Juffer F. Detrimental effects on cognitive development of growing up in children's homes: A meta-analysis on IQ in orphanages. Center for Child and Family Studies, Leiden University; Leiden, NE: 2007. Unpublished paper. [Google Scholar]
- van IJzendoorn MH, Sagi A. Cross-cultural patterns of attachment. In: Cassidy J, Shaver PR, editors. Handbook of attachment. Guilford Press; New York: 1999. pp. 713–734. [Google Scholar]
- van IJzendoorn MH, Schuengel C, Bakermans-Kranenburg MJ. Disorganized attachment in early childhood: Meta-analysis of precursors, concomitants, and sequelae. Development and Psychopathology. 1999;11:225–249. doi: 10.1017/s0954579499002035. [DOI] [PubMed] [Google Scholar]
- Vazquez DM, Watson SJ, Lopez JF. Failure to terminate stress responses in children with psychosocial dwarfism: A mechanism for growth failure; Paper presented at the International Conference of Infant Studies; Brighton, U.K.. Jul, 2000. [Google Scholar]
- Vorria P, Papaligoura Z, Dunn J, van IJzendoorn MH, Steele H, Kontopoulou A, et al. Early experiences and attachment relationships of Greek infants raised in residential group care. Journal of Child Psychology and Psychiatry. 2003;44:1208–1220. doi: 10.1111/1469-7610.00202. [DOI] [PubMed] [Google Scholar]
- Vorria P, Rutter M, Pickles A, Wolkind S, Hobsbaum A. A comparative study of Greek children in long-term residential group care and in two-parent families. I: Social, emotional, and behavioral differences. Journal of Child Psychology. 1998a;39(2):225–236. [PubMed] [Google Scholar]
- Vorria P, Rutter M, Pickles A, Wolkind S, Hobsbaum A. A comparative study of Greek children in long-term residential group care and in two-parent families. II: Possible mediating mechanisms. Journal of Child Psychology. 1998b;39(2):237–245. [PubMed] [Google Scholar]
- Vygotsky LS. Mind in society: The development of higher psychological processes. Harvard University Press; Cambridge, MA: 1978. [Google Scholar]
- Whitebook M, Howes C, Phillips D, Pemberton C. Who cares? Child care teachers and the quality of care in America. Young Children. 1989;46:5–47. [Google Scholar]
- Yoshikawa H. Long-term effects of early childhood programs on social outcomes and delinquency. The Future of Children. 1995;5(3):51–75. [PubMed] [Google Scholar]
- Yuzhakov SN, Milyukov PN, editors. Fostering asylums. 4th ed. Vol. 5. Prosvesheniye; St. Petersburg, Russian Federation: 1904. pp. 523–526. [Google Scholar]
- Zeanah CH, Smyke AT, Dumitrescu A. Attachment disturbances in young children. II: Indiscriminate behaviors and institutional care. Journal of the American Academy of Child and Adolescent Psychiatry. 2002;41:983–989. doi: 10.1097/00004583-200208000-00017. [DOI] [PubMed] [Google Scholar]
- Zeanah CH, Smyke AT, Koga S. Effects of foster care following institutionalization: Cognitive development and behavior problems; Paper presented as part of the symposium (C. Nelson, chair) titled The Effects of Early Institutionalization on Brain-Behavior Development: The Bucharest Early Intervention Project at the meetings of the Society for Research in Child Development; Tampa, FL. Apr 26, 2003. [Google Scholar]
- Zeanah CH, Smyke AT, Koga SF, Carlson E, the Bucharest Early Intervention Project Care Group Attachment in institutionalized and community children in Romania. Child Development. 2005;76(5):1015–1028. doi: 10.1111/j.1467-8624.2005.00894.x. [DOI] [PubMed] [Google Scholar]
- Zung WWK. A self-rating depression scale. Archives of General Psychiatry. 1965;12:63–70. doi: 10.1001/archpsyc.1965.01720310065008. [DOI] [PubMed] [Google Scholar]