Abstract
Continuous arterial spin labeling (CASL) is a noninvasive magnetic resonance (MR) method for measuring cerebral perfusion. In its most widely used form, CASL incorporates a postlabeling delay to minimize the sensitivity of the technique to transit time effects, which otherwise corrupt cerebral blood flow (CBF) quantification. For this delay to work effectively, it must be longer than the longest transit time present in the system. In this work, CASL measurements were made in four coronal slices in the rat brain using a range of postlabeling delays. By doing this, direct estimation of both CBF and arterial transit time (δa) was possible. These measurements were performed in the normal brain and during hypoperfusion induced by occlusion of the common carotid arteries. It was found that, in the normal rat brain, significant regional variation exists for both CBF and δa. Mean values of CBF and δa in the selected gray matter regions of interest were 233 mL/100 g min and 266 ms, respectively, with the latter ranging from 100 to 500 ms. Therefore, use of a 500-ms postlabeling delay is suitable for any location in the normal rat brain. After common carotid artery occlusion, CBF decreased and δa increased by regionally dependent amounts. In the sensory cortex, δa increased to a mean value of 740 ms, significantly greater than 500 ms. These results highlight the importance of either (a) determining δa as part of the CASL measurement or (b) knowing the approximate range of values δa is likely to take for a given application, so that the parameters of the CASL sequence can be chosen appropriately.
Keywords: arterial spin labeling, arterial transit time, cerebral hypoperfusion, magnetic resonance imaging, perfusion quantification, rat brain
Introduction
Arterial spin labeling (ASL) (Detre et al, 1994) is a magnetic resonance (MR) method for the measurement of tissue perfusion, and has been most widely used for the evaluation of cerebral blood flow (CBF) (Calamante et al, 1999). The method has the particular advantage of being completely noninvasive, allowing dynamic changes in CBF to be monitored. This makes ASL ideally suited to applications such as functional brain imaging (Detre and Wang, 2002), where focal increases in CBF can be used to identify the regions of increased neuronal activation, and studies of animal models of cerebrovascular disease, where ASL can be used to identify regions of ischemia. In combination with measurements of other MR parameters (e.g. apparent diffusion coefficient), evolving tissue status can be assessed over experimental time courses of minutes or hours (Thomas et al, 2000).
Quantification of CBF using ASL methods is an active area of research (Alsop and Detre, 1996; Buxton et al, 1998; St Lawrence et al, 2000; Ewing et al, 2001; Zhou et al, 2001; Parkes and Tofts, 2002). Most current implementations of the method use the original biophysical model for CBF quantification (Detre et al, 1992; Calamante et al, 1996), due to its relative simplicity, the limited signal-to-noise ratio (SNR) of the ASL data, and the concordance with CBF values obtained using other non-MRI techniques (Pell et al, 2003; Ewing et al, 2003; Ye et al, 2000). In this model, the two main hemodynamic parameters affecting perfusion quantification are CBF itself and the arterial transit time, that is, the time between inversion of the arterial blood water and its arrival at the imaging slice. If the existence of the transit time is ignored, severely erroneous CBF values can result, particularly in regions of ischemia (Detre et al, 1998). Also, when CBF changes (due to neuronal activation, for example) concurrent transit time alterations occur, confounding the CBF measurement if they are not accounted for (Gonzalez-At et al, 2000). To make the ASL sequences insensitive to transit time, modifications have been suggested (Alsop and Detre, 1996; Wong et al, 1998), which use delays after the spin labeling period. However, this solution reduces the precision in a method which is already inherently low in SNR. Alternatively, it is possible to acquire multiple ASL images over a range of postlabeling delay times (Buxton et al, 1998; Gonzalez-At et al, 2000; Mildner et al, 2005) or with a periodic labeling function (Barbier et al, 2001). Although this increases the total scan time of the measurement, it allows direct estimation of both CBF and transit time.
In this work, continuous arterial spin labeling (CASL) has been used with a range of postlabeling delays to measure regional CBF and regional arterial transit time in the rat brain. These measurements have been performed under conditions of normal flow and after occlusion of the common carotid arteries, which induces a state of cerebral hypoperfusion (Tsuchiya et al, 1992). Knowledge of regional variations of transit time is important for two main reasons. First, if one intends to use a postlabeling delay to eliminate the sensitivity of the CASL CBF measurement to transit time, it is necessary to know the full range of transit times that exist, since the delay must be longer than the longest transit time present. Second, the spatial pattern of transit time variation is likely to reflect regional differences in arterial supply, and thus may allow identification of the different vascular territories of the brain. Measurement of CBF and transit time after bilateral common carotid artery occlusion allows assessment of the changes that occur to both these parameters during a condition of compromised blood flow.
Materials and methods
Animal Preparation
Twelve Sprague–Dawley rats (Harlan, UK) were used in this study (weight = 190±39 g (mean±s.d.)). Anesthesia was induced using 4% halothane in 100% O2. During surgery, anesthesia was maintained via a nose cone at 2% halothane in 60% N2O and 40% O2. Halothane concentration was reduced to 1.0% to 1.2%, while the animal was in the magnet. Body temperature was monitored with a rectal thermometer and maintained at 37°C±0.5°C. This was achieved using a homeothermic blanket during surgery and by blowing warm air into the enclosed magnet bore during imaging. Electrocardiograph (ECG) and respiratory rates were monitored continuously using subcutaneous brass electrodes. The animals breathed spontaneously throughout the experiment. A custom-designed nonmagnetic Perspex probe was used to secure the animal in a fixed position in the magnet bore. The animal’s head was held by ear bars to minimize motion during data acquisition.
Remote Bilateral Common Carotid Artery Occlusion (BCCAo)
Remote BCCAo was performed in eight of the 12 rats. To expose the carotid arteries, a midline ventral cervical incision was made, the overlying muscle was retracted, and the common carotid artery was dissected away from the vagus nerve. A nylon thread was placed round each common carotid artery and attached to individually controlled manual screw systems to form a snare. This enabled remote bilateral carotid artery occlusion while the rat was positioned in the bore of the magnet (Allen et al, 1993). Before placing the animal in the magnet, the mechanics of the occlusion procedure were verified (with sequential unilateral occlusions of less than 5 secs).
MRI Hardware
MRI studies were performed using a 2.35 T horizontal magnet with a 120 mm clear bore (Oxford Instruments, Eynsham, UK), interfaced to a Surrey Medical Imaging Systems (SMIS, UK) console. Radiofrequency (RF) excitation pulses were transmitted via a volume coil (6 cm length) into which the animal probe was inserted. Magnetic resonance signals were received by a separate passively decoupled single loop surface coil of 3 cm diameter, which was fixed closely above the head of the animal.
Continuous Arterial Spin Labeling Sequence Details
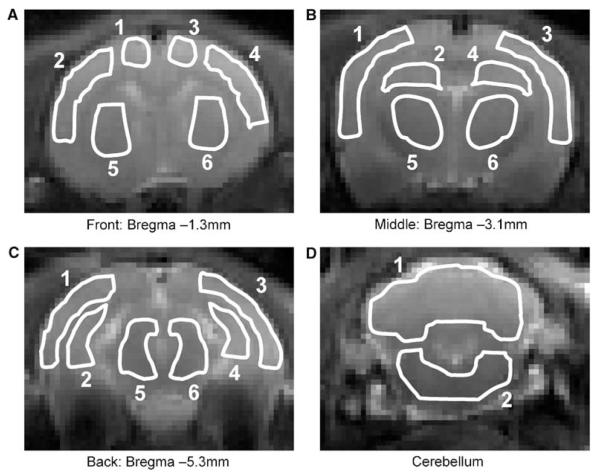
Single-slice CASL was implemented with spin-echo echo planar imaging (SE-EPI). The imaging parameters were: slice thickness = 2 mm; FOV = 40 × 20 mm; image matrix = 128 × 64; TE = 35 ms. The B1 amplitude of the spin labeling pulse was 200 Hz, applied continuously for 3 secs in the presence of a magnetic field gradient along the axial (z) direction with amplitude 17.4 mT/m. The inversion plane was positioned adjacent to the posterior aspect of the brain (2 mm from the edge of the cerebellum), to intersect with the carotid and vertebral arteries and ensure efficient spin labeling. Four coronal imaging slices were examined, from the cerebellum to ~1 mm posterior to the bregma (see Figure 1). The frequency offset of the CASL labeling pulse was chosen to maintain its position adjacent to the brain, and ranged from ~5000 Hz, when the cerebellum was imaged (corresponding to a spatial offset from the imaging slice of ~7 mm), to ~11,000 Hz, when the most anterior slice was imaged (corresponding to a spatial offset from the imaging slice of ~15 mm). Control images of each slice were acquired by reversing the frequency offset of the labeling pulse. Separate CASL acquisitions were performed with eight postlabeling delay times (w) between the 3-sec labeling pulse and image acquisition, ranging from 100 to 1500 ms. A bipolar gradient was applied simultaneously along all the three axes after spin excitation to eliminate intravascular signal from fast-flowing blood vessels (b≈12 s/mm2 (Le Bihan et al, 1986)). Signal averaging (Nav = 44) was performed for each delay time, resulting in a total acquisition time of approximately 50 mins for each slice. For the animals undergoing BCCAo, four slices were acquired before occlusion and a single-slice was acquired after occlusion (corresponding to a location of bregma -3.1 mm; see Figure 1).
Figure 1.
Regions of interest used for quantification of CBF and arterial transit time (δa). The ROIs are superimposed on the CASL control images (single-shot EPI images). Four coronal slices were acquired at different caudal–rostral locations in the rat brain. The anatomical locations of the ROIs are (A) front slice (bregma -1.3 mm): motor cortex (1,3); sensory cortex (2,4); caudate putamen (5,6); (B) middle slice (bregma -3.1 mm): sensory/auditory cortex (1,3); hippocampus (2,4); thalamus (5,6); (C) back slice (bregma -5.3 mm): visual/auditory cortex (1,3); hippocampus (2,4); midbrain (5,6); (D) cerebellum (1,2).
Cerebral Blood Flow and Transit Time Quantification and Comparison
In addition to the CASL acquisitions, an inversion recovery SE-EPI sequence with a nonselective adiabatic inversion pulse was used to measure T1ns (T1 in the absence of an off-resonance saturation pulse) and spin density (). Using these results, and assuming values for arterial blood T1 (T1a) and tissue T1s (T1 in the presence of an off-resonance saturation pulse) to be 1500 and 500 ms respectively, CBF(f), arterial transit time (δa) and tissue transit time (δ) were calculated by fitting the ASL signal difference (δM) as a function of the postlabeling delay (w) to the biophysical model of Alsop and Detre (1996):
| (1) |
where
Equation (1) describes a two-compartment model consisting of the brain tissue compartment (the term in the first pair of square brackets in the definition of K) and the intravascular compartment (the term in the second pair of square brackets in the definition of K). The degree of inversion (α) for spin labeling was assumed to be 0.7 (based on previous measurements, not shown) and the blood:brain partition coefficient for water (λ) was assumed to be 0.9 mL/g (Herscovitch and Raichle, 1985). Fits were performed on region of interest (ROI) data using GraphPad Prism 4 (GraphPad Software Inc., San Diego, CA, USA), with the constraint δ>δa. Regions of interest were drawn symmetrically in both hemispheres in anatomically distinct areas of gray matter in each of the four slices acquired (see Figure 1 for the locations of the ROIs). Statistical analyses were performed using GraphPad Prism 4. Differences in CBF and δa between ROIs in the normal rat brain were evaluated using a one way ANOVA with Bonferroni’s correction for multiple comparisons. Changes in CBF and δa after BCCAo were assessed using a repeated measures ANOVA (before occlusion versus after occlusion), again with the Bonferroni correction for multiple comparisons.
Results
Cerebral Blood Flow and δa in Normal Rat Brain
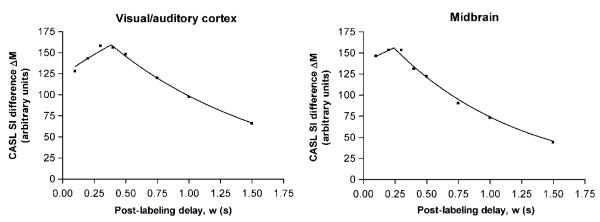
Figure 2 shows an example of CASL data acquired with a range of postlabeling delays from two ROIs in the normal rat brain. The fit to the theoretical model is also plotted. It can be seen that the model fits the data well, with the CASL signal difference (ΔM) increasing at short delay times and subsequently decreasing at longer delay times. Several qualitative points are shown by the graphs in Figure 2. First, from equation (1), the peak amplitude of the signal difference curves is proportional to CBF (as well as several other measured or known parameters). Second, also from equation (1), it can be shown that the time of the point of inflexion of the curves is equal to the arterial transit time (δa). In contrast, the tissue transit time (δ) affects the curve in a more subtle manner, by causing a change in the decay rate of the latter portion of the curve. Consequently, using this method of measurement, the values obtained for CBF and δa are much more reliable and reproducible than the values obtained for δ. For this reason, only the measured values of CBF and δa are reported here. For both CBF and δa there was no evidence for differences between the left and right cerebral hemispheres, and so equivalent left and right ROIs were averaged for further regional comparisons.
Figure 2.
Example of ROI data (symbols) and best fit to equation (1) (lines) for CASL difference signal (control image – labeled image) as a function of postlabeling delay in the normal rat brain. The peak height of the curves is proportional to CBF and the point of inflexion indicates the arterial transit time (δa).
The CBF values for all the ROIs are shown in Figure 3. It is apparent that a regional variation of CBF exists. In particular, the hippocampus had a significantly lower CBF than the sensory cortex, caudate putamen, thalamus, and midbrain (P<0.05). The deep gray matter of the midbrain had the highest CBF of all the regions examined. The mean CBF over all ROIs was 233 mL/100 g min.
Figure 3.
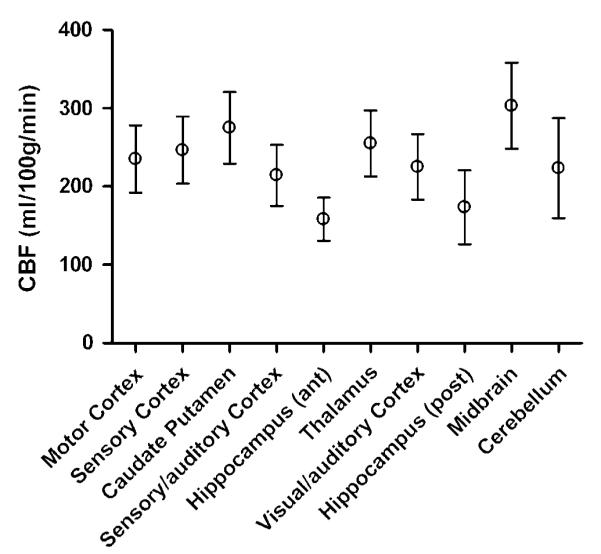
Regional variation of CBF in the normal rat brain measured with CASL (plotted as means with 95% confidence intervals). Lowest CBF values are observed in the hippocampus and highest CBF values are observed in the deep gray matter regions, that is, midbrain and caudate putamen. Mean CBF values (in mL/100 g min) for each ROI were: motor cortex 235; sensory cortex 247; caudate putamen 275; sensory/auditory cortex 214; anterior hippocampus 158; thalamus 255; visual/auditory cortex 225; posterior hippocampus 173; midbrain 303; cerebellum 223.
Arterial transit times for the different ROIs are shown in Figure 4. As with CBF, a regional variation of δa is observed. This is expected since different brain regions are supplied by different cerebral arteries, each with its own individual topology. For the brain regions studied, δa is in the range of 100 to 500 ms, consistent with previous measurements made in the rat brain (Zhang et al, 1992; Barbier et al, 2001). The mean δa over all ROIs was 266 ms. The areas which were found to have significantly different values of δa are shown in Table 1. Areas with longer δa have correspondingly longer or more circuitous routes between the labeling plane and entry to the imaging slice. For example, the motor cortex (mean δa = 337 ms) is supplied by the anterior cerebral artery, and therefore has a longer vascular supply path than the caudate putamen (mean δa = 177 ms), which is supplied by the more direct striate arteries (Scremin, 1995).
Figure 4.
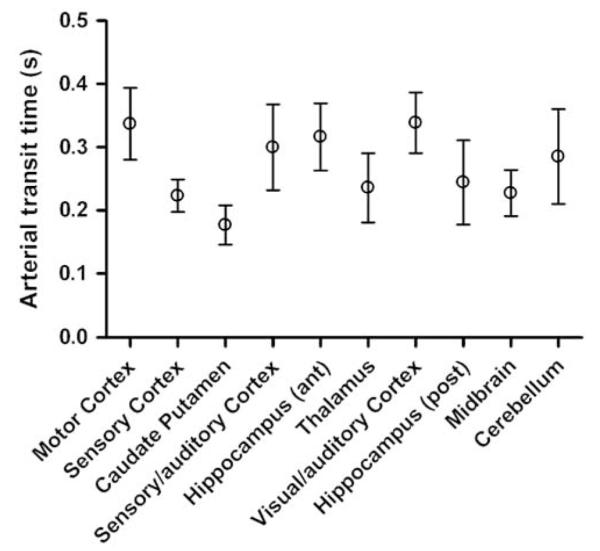
Regional variation of δa in the normal rat brain measured with CASL (plotted as means with 95% confidence intervals). See Table 1 for details of significant differences between regions. The regional differences of δa reflect differences in the vascular supply to those regions, for example, the caudate putamen (which is supplied by the striate arteries) has a relatively short δa, whereas the motor cortex (which is supplied by the more circuitous anterior cerebral artery) has a relatively long δa. The mean δa values (in ms) for each ROI were: motor cortex 337; sensory cortex 223; caudate putamen 177; sensory/auditory cortex 300; anterior hippocampus 316; thalamus 236; visual/auditory cortex 339; posterior hippocampus 244; midbrain 228; cerebellum 285.
Table 1.
ROI comparisons of arterial transit time measurements in normal rat brain using one-way ANOVA with Bonferroni’s multiple comparison test
| Arterial transit time δa in: | Is greater than in: | With significance (P) |
|---|---|---|
| Motor cortex (front slice) | Sensory cortex (front slice) | <0.01 |
| Caudate putamen (front slice) | <0.001 | |
| Thalamus (middle slice) | <0.05 | |
| Midbrain (back slice) | <0.05 | |
| Visual/auditory cortex (back slice) | Sensory cortex (front slice) | <0.05 |
| Caudate putamen (front slice) | <0.001 | |
| Hippocampus (middle slice) | Caudate putamen (front slice) | <0.001 |
| Sensory/auditory cortex (middle slice) | Caudate putamen (front slice) | <0.01 |
All ROI comparisons apart from those shown in this table showed no significant evidence of regional differences in arterial transit time.
Cerebral Blood Flow and δa Changes After Bilateral Common Carotid Artery Occlusion
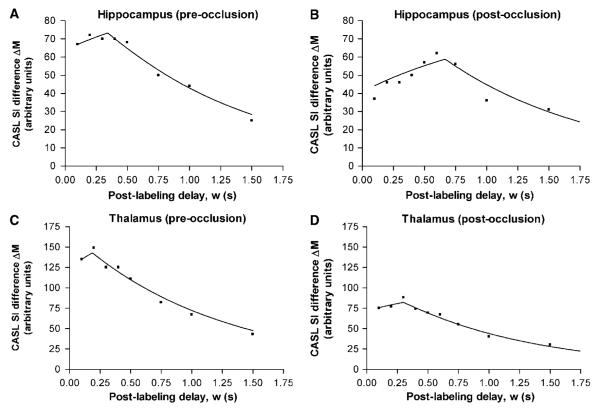
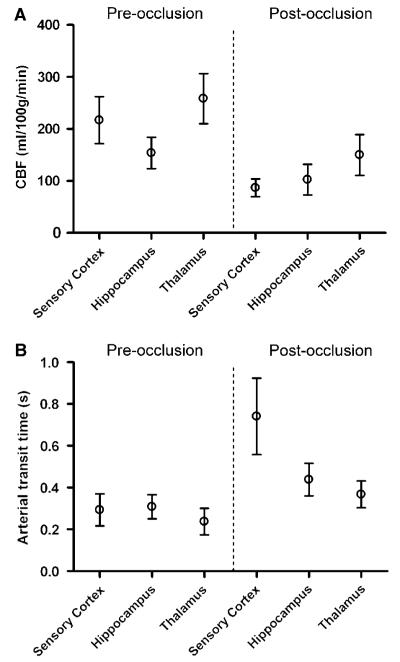
Figure 5 shows examples from two ROIs of the CASL raw data and model fits before and after BCCAo. In both regions, CBF decreases (indicated by a reduced peak height of the curve) and δa increases (indicated by a shift of the point of inflexion of the curve to longer delay times) after carotid artery occlusion, as expected from hemodynamic considerations. The results from all BCCAo animals are summarized in Figure 6. For all regions, CBF decreased significantly after occlusion (sensory cortex and thalamus P<0.001; hippocampus P<0.05). Mean CBF values were 214, 158 and 255 mL/100 g min in the sensory cortex, hippocampus and thalamus, respectively, before occlusion, and 87, 103 and 150 mL/100 g min after occlusion. Mean δa increased in all ROIs, but the change was only significant in the sensory cortex (P<0.001). Mean δa values in the sensory cortex, hippocampus and thalamus were 300, 316 and 236 ms, respectively, before occlusion and 740, 438 and 367 ms postocclusion. In the sensory cortex, the 95% confidence interval of δa postocclusion was 557 to 924 ms, showing it to be significantly greater than 500 ms (i.e. greater than the preocclusion upper limit over the whole brain). The 95% confidence intervals for the mean difference between pre- and postocclusion δa values for the hippocampus and the thalamus were both -262 ms to + 2 ms (i.e. the confidence intervals contain zero, from which the statistical test concludes that the difference is nonsignificant). However, since zero falls at the extreme edge of the confidence interval range, the difference is on the verge of significance, and so this provides some evidence for elevated transit times in the hippocampus and thalamus after BCCAo.
Figure 5.
Continuous arterial spin labeling difference signal (control image – labeled image) from two example ROIs in the rat brain before (A, C) and after (B, D) bilateral occlusion of the common carotid arteries. The symbols represent the acquired data and the lines show the fit to the biophysical model (equation (1)). Postocclusion, CBF decreases (indicated by a reduced curve peak amplitude) and δa increases (indicated by a shift of the point of inflexion of the curve to longer delay times).
Figure 6.
Changes in (A) CBF and (B) δa after BCCAo in various ROIs in the rat brain (data plotted as means with 95% confidence intervals). (A) Cerebral blood flow decreases significantly in all regions postocclusion (sensory cortex and thalamus P<0.001; hippocampus P<0.05). Mean pre-occlusion CBF values (in mL/100 g min) were 214, 158, and 255 in the sensory cortex, hippocampus and thalamus, respectively; mean postocclusion CBF values (in mL/100 g min) were 87, 103, and 150. (B) δa shows an upward trend postocclusion in all regions, but the increase is only statistically significant in the sensory cortex (P<0.001). Mean preocclusion δa values (in ms) were 300, 316, and 236 in the sensory cortex, hippocampus, and thalamus, respectively; mean postocclusion δa values (in ms) were 740, 438, and 367.
Discussion
In this work, CASL MRI has been used to measure CBF and arterial transit time at various locations in the rat brain. This has allowed assessment of the range of CBF and δa values present under normal conditions, which is essential for the design of reliable and accurate transit-time-insensitive CASL sequences using a single postlabeling delay time. Additionally, CBF and arterial transit time changes after bilateral occlusion of the common carotid arteries have been measured. This information is important because, as well as providing insights into the hemodynamic changes and collateral mechanisms of the vascular system, it allows evaluation of the suitability of postlabeling delays during conditions of compromised blood flow.
From the results presented above, it can be concluded that using CASL with a postlabeling delay of 500 ms is sufficient to ensure transit time insensitivity throughout the normal rat brain. Since the delay time only needs to be longer than the longest transit time that exists in the brain, use of a 500 ms delay is also valid for situations where δa is likely to reduce, for example, studies involving hypercapnia or functional activation. However, during hypoperfusion induced by BCCAo, δa increases to values greater than 500 ms in some brain regions, and it is therefore necessary to use a longer postlabeling delay (e.g. 800 to 1000 ms) to maintain transit time insensitivity. Of course, the exact amount by which a disturbance of the cerebrovascular system affects CBF and δa will depend on the details of the disturbance, and may differ considerably according to severity (e.g. whether feeding arteries are completely or partially occluded (Calamante et al, 1999; Lythgoe et al, 2000)). However, the main point is that, for each particular application, it is important to know the range of values which δa is likely to have, so that if it is not measured directly it can be eliminated as a confounding factor in the measurement of CBF.
While measurements of transit times in the normal rat brain have been made previously using ASL approaches (Zhang et al, 1992; Barbier et al, 2001), this study represents the first attempt to assess the full extent of transit times present in slices over a range of caudal–rostral locations. To choose a postlabeling delay that is suitable for whole brain imaging with full insensitivity to transit time effects, this information is essential. An alternative approach to using a postlabeling delay is to use a sequence which measures CBF and δa simultaneously after a single spin labeling period (Günther et al, 2001; Hendrikse et al, 2003). However, the penalty associated with acquiring multiple images after a single spin labeling period is significantly reduced SNR, with a concomitant loss of measurement precision. Therefore, it would seem preferable to achieve transit time insensitivity at the minimum required postlabeling delay to maximize the precision and reliability of CBF values.
The regional variation of CBF is in overall agreement with that found previously in the rat brain using 14C-iodoantipyrine autoradiography (Hansen et al, 1988; Young et al, 1991). In these previous studies, it was also found that CBF was relatively high in the neocortex, caudate putamen and midbrain (inferior colliculus), and lower in the hippocampus. In addition, it was shown that the choice of anesthetic agent affects CBF significantly (see also Hendrich et al, 2001). Of particular relevance to the findings presented here, halothane anesthesia was shown to elevate CBF compared with isoflurane and nitrous oxide/morphine sulfate. Halothane interferes with neurovascular coupling and acts as a region-dependent vasodilator, which may explain why the values measured in this study are slightly higher than those previously reported from studies using ASL with different anesthetics (Silva and Kim, 1999).Whether halothane affects δa is unknown, though it would most likely reduce δa in regions where CBF is elevated. Despite this, halothane is frequently used as an anesthetic in animal models of brain disease, and the results of this study have wide applicability. However, it is important to note that the results of this study may need to be verified for different anesthetic conditions.
In this study, four coronal slices of the rat brain were imaged, covering the majority of the brain extent in the caudal–rostral direction. This was performed by acquiring each slice in successive single-slice CASL experiments. A more time-efficient way to acquire such data would be to use the multislice CASL method proposed by Alsop and Detre (1998). However, the efficiency of the amplitude-modulated control pulse used in this multislice method depends on a variety of factors, including arterial blood velocity at the point of inversion, the relaxation times of blood water, the frequency of the sinusoidal amplitude modulation, and the spatial separation of the two inversion planes (Utting et al, 2005). Predicting the reduction in efficiency associated with the use of the amplitude-modulated control is difficult and complicated, due to this multifactorial dependence, and, consequently, accurate CBF quantification becomes problematic. Indeed, the only practical method to assess the actual reduction in efficiency has been to compare the signal difference between the spin labeled and control images for both the single-slice and multislice methods and scale the result from the multislice approach accordingly (Alsop and Detre, 1998). In this study, achieving the minimum possible scan time was not the primary objective. Therefore, to quantify CBF accurately with this technique, single-slice CASL was used.
The potential value of the ASL transit time as a physiological parameter of interest, especially in cerebrovascular disease, has been noted previously (Detre et al, 1998; Chalela et al, 2000). A recently developed modification of the ASL technique, known as Flow Encoding Arterial Spin Tagging (FEAST), was designed to measure the tissue transit time (δ) by incorporating bipolar flow-crushing gradients into the pulse sequence (Wang et al, 2003). As long as the postlabeling delay is longer than the arterial transit time, both CBF and δ can be estimated from a pair of CASL subtraction images, one with the flow-crushing gradients and one without. An interesting observation found using the FEAST method was that, in normal human subjects, different regions of the brain corresponding to different vascular territories appeared to have different tissue transit times associated with them. The data in the study described here support this suggestion (see Figure 4 and Table 1). In the rat brain, we found that the brain regions corresponding to the vascular territory of the anterior cerebral arteries had longer arterial transit times than regions supplied by the middle cerebral artery, which in turn had longer δa than regions supplied by the striate arteries. This suggests that ASL transit times could potentially be used as a hemodynamic parameter for mapping vascular territories.
In conclusion, we have measured CBF and arterial transit time at various locations in the rat brain using CASL. We have found that, while a postlabeling delay of 500 ms is sufficient to ensure transit time insensitivity throughout the whole normal brain, during hypoperfusion δa becomes elevated to values greater than 500 ms. It is important to be aware of this when using CASL in the hypoperfused or ischemic brain, to avoid corruption of the measured CBF values by transit time effects.
Acknowledgements
The authors would like to thank Dr John Thornton and Ms Rebeccah Slater for their assistance with this work.
Footnotes
This work was supported by the Wellcome Trust.
References
- Allen KL, Busza AL, Proctor E, King MD, Williams SR, Crockard HA, Gadian DG. Controllable graded cerebral ischemia in the gerbil – studies of cerebral blood flow and energy-metabolism by hydrogen clearance and P-31 NMR spectroscopy. NMR Biomed. 1993;6:181–6. doi: 10.1002/nbm.1940060303. [DOI] [PubMed] [Google Scholar]
- Alsop DC, Detre JA. Reduced transit-time sensitivity in noninvasive magnetic resonance imaging of human cerebral blood flow. J Cereb Blood Flow Metab. 1996;16:1236–49. doi: 10.1097/00004647-199611000-00019. [DOI] [PubMed] [Google Scholar]
- Alsop DC, Detre JA. Multi-section cerebral blood flow MR imaging with continuous arterial spin labeling. Radiology. 1998;208:410–6. doi: 10.1148/radiology.208.2.9680569. [DOI] [PubMed] [Google Scholar]
- Barbier EL, Silva AC, Kim SG, Koretsky AP. Perfusion imaging using dynamic arterial spin labeling (DASL) Magn Reson Med. 2001;45:1021–9. doi: 10.1002/mrm.1136. [DOI] [PubMed] [Google Scholar]
- Buxton RB, Frank LR, Wong EC, Siewert B, Warach S, Edelman RR. A general kinetic model for quantitative perfusion imaging with arterial spin labeling. Magn Reson Med. 1998;40:383–96. doi: 10.1002/mrm.1910400308. [DOI] [PubMed] [Google Scholar]
- Calamante F, Lythgoe MF, Pell GS, Thomas DL, King MD, Busza AL, Sotak CH, Williams SR, Ordidge RJ, Gadian DG. Early changes in water diffusion, perfusion, T1 and T2 during focal ischaemia in the rat studied at 8.5 T. Magn Reson Med. 1999;41:479–85. doi: 10.1002/(sici)1522-2594(199903)41:3<479::aid-mrm9>3.0.co;2-2. [DOI] [PubMed] [Google Scholar]
- Calamante F, Williams SR, van Bruggen N, Kwong KK, Turner R. A model for quantification of perfusion in pulsed labeling techniques. NMR Biomed. 1996;9:79–83. doi: 10.1002/(SICI)1099-1492(199604)9:2<79::AID-NBM399>3.0.CO;2-4. [DOI] [PubMed] [Google Scholar]
- Chalela JA, Alsop DC, Gonzalez-Atavales JB, Maldjian JA, Kasner SE, Detre JA. Magnetic resonance perfusion imaging in acute ischemic stroke using continuous arterial spin labeling. Stroke. 2000;31:680–7. doi: 10.1161/01.str.31.3.680. [DOI] [PubMed] [Google Scholar]
- Detre JA, Alsop DC, Vives LR, Maccotta L, Teener JW, Raps EC. Noninvasive MRI evaluation of cerebral blood flow in cerebrovascular disease. Neurology. 1998;50:633–41. doi: 10.1212/wnl.50.3.633. [DOI] [PubMed] [Google Scholar]
- Detre JA, Leigh JS, Williams DS, Koretsky AP. Perfusion imaging. Magn Reson Med. 1992;23:37–45. doi: 10.1002/mrm.1910230106. [DOI] [PubMed] [Google Scholar]
- Detre JA, Wang J. Technical aspects and utility of fMRI using BOLD and ASL. Clin Neurophysiol. 2002;113:621–34. doi: 10.1016/s1388-2457(02)00038-x. [DOI] [PubMed] [Google Scholar]
- Detre JA, Zhang WG, Roberts DA, Silva AC, Williams DS, Grandis DJ, Koretsky AP, Leigh JS. Tissue-specific perfusion imaging using arterial spin labeling. NMR Biomed. 1994;7:75–82. doi: 10.1002/nbm.1940070112. [DOI] [PubMed] [Google Scholar]
- Ewing JR, Cao Y, Fenstermacher JD. Single-coil arterial spin tagging for estimating cerebral blood flow asviewed from the capillary: relative contributions of intra- and extravascular signal. Magn Reson Med. 2001;46:465–75. doi: 10.1002/mrm.1215. [DOI] [PubMed] [Google Scholar]
- Ewing JR, Wei L, Knight RA, Pawa S, Nagaraja TN, Brusca T, Divine GW, Fenstermacher JD. Direct comparison of local cerebral blood flow rates measured by MRI arterial spin-tagging and quantitative autoradiography in a rat model of experimental cerebral ischemia. J Cereb Blood Flow Metab. 2003;23:198–209. doi: 10.1097/01.WCB.0000046147.31247.E8. [DOI] [PubMed] [Google Scholar]
- Gonzalez-At JB, Alsop DC, Detre JA. Cerebral perfusion and arterial transit time changes during task activation determined with continuous arterial spin labeling. Magn Reson Med. 2000;43:739–46. doi: 10.1002/(sici)1522-2594(200005)43:5<739::aid-mrm17>3.0.co;2-2. [DOI] [PubMed] [Google Scholar]
- Günther M, Bock M, Schad LR. Arterial spin labelling in combination with a Look-Locker sampling strategy: Inflow Turbo-Sampling EPI-FAIR (ITS-FAIR) Magn Reson Med. 2001;46:974–84. doi: 10.1002/mrm.1284. [DOI] [PubMed] [Google Scholar]
- Hansen TD, Warner DS, Todd MM, Vust LJ, Trawick DC. Distribution of cerebral blood flow during halothane versus isoflurane anesthesia in rats. Anesthesiology. 1988;69:332–7. doi: 10.1097/00000542-198809000-00008. [DOI] [PubMed] [Google Scholar]
- Hendrich KS, Kochanek PM, Melick JA, Schiding JK, Statler KD, Williams DS, Marion DW, Ho C. Cerebral perfusion during anesthesia with fentanyl, isoflurane, or pentobarbital in normalrats studied by arterial spin-labeled MRI. Magn Reson Med. 2001;46:202–6. doi: 10.1002/mrm.1178. [DOI] [PubMed] [Google Scholar]
- Hendrikse J, Lu H, van der Grond J, van Zijl PCM, Golay X. Measurements of cerebral perfusion and arterial hemodynamics during visual stimulation using Turbo-TILT. Magn Reson Med. 2003;50:429–33. doi: 10.1002/mrm.10525. [DOI] [PubMed] [Google Scholar]
- Herscovitch P, Raichle ME. What is the correct value for the blood–brain partition coefficient for water? J Cereb Blood Flow Metab. 1985;5:65–9. doi: 10.1038/jcbfm.1985.9. [DOI] [PubMed] [Google Scholar]
- Le Bihan D, Breton E, Lallemand D, Grenier P, Cabanis E, Laval-Jeantet M. MR imaging of intravoxel incoherent motions: application to diffusion and perfusion in neurologic disorders. Radiology. 1986;161:401–7. doi: 10.1148/radiology.161.2.3763909. [DOI] [PubMed] [Google Scholar]
- Lythgoe MF, Thomas DL, Calamante F, Pell GS, King MD, Busza AL, Sotak CH, Williams SR, Ordidge RJ, Gadian DG. Acute changes in MRI diffusion, perfusion, T1, and T2 in a rat model of oligemia produced by partial occlusion of the middle cerebral artery. Magn Reson Med. 2000;44:706–12. doi: 10.1002/1522-2594(200011)44:5<706::aid-mrm8>3.0.co;2-1. [DOI] [PubMed] [Google Scholar]
- Mildner T, Moller HE, Driesel W, Norris DG, Trampel R. Continuous arterial spin labeling at the human common carotid artery: the influence of transit times. NMR Biomed. 2005;18:19–23. doi: 10.1002/nbm.917. [DOI] [PubMed] [Google Scholar]
- Parkes LM, Tofts PS. Improved accuracy of human cerebral blood perfusion measurements using arterial spin labeling: accounting for capillary water permeability. Magn Reson Med. 2002;48:27–41. doi: 10.1002/mrm.10180. [DOI] [PubMed] [Google Scholar]
- Pell GS, King MD, Proctor E, Thomas DL, Lythgoe MF, Gadian DG, Ordidge RJ. Comparative study of the FAIR technique of perfusion quantification with the hydrogen clearance method. J Cereb Blood Flow Metab. 2003;23:689–99. doi: 10.1097/01.WCB.0000063990.19746.58. [DOI] [PubMed] [Google Scholar]
- Scremin OU. Cerebral vascular system. In: Paxinos G, editor. The rat nervous system. Academic Press; San Diego: 1995. pp. 3–35. [Google Scholar]
- Silva AC, Kim SG. Pseudo-continuous arterial spin labeling technique for measuring CBF dynamics with high temporal resolution. Magn Reson Med. 1999;42:425–9. doi: 10.1002/(sici)1522-2594(199909)42:3<425::aid-mrm3>3.0.co;2-s. [DOI] [PubMed] [Google Scholar]
- St Lawrence KS, Frank JA, Mclaughlin AC. Effect of restricted water exchange on cerebral blood flow values calculated with arterial spin tagging: a theoretical investigation. Magn Reson Med. 2000;44:440–9. doi: 10.1002/1522-2594(200009)44:3<440::aid-mrm15>3.0.co;2-6. [DOI] [PubMed] [Google Scholar]
- Thomas DL, Lythgoe MF, Pell GS, Calamante F, Ordidge RJ. The measurement of diffusion and perfusion in biological systems using magnetic resonance imaging. Phys Med Biol. 2000;45:R97–138. doi: 10.1088/0031-9155/45/8/201. [DOI] [PubMed] [Google Scholar]
- Tsuchiya M, Sako K, Yura S, Yonemasu Y. Cerebral blood flow and histopathological changes following permanent bilateral carotid artery ligation in Wistar rats. Exp Brain Res. 1992;89:87–92. doi: 10.1007/BF00229004. [DOI] [PubMed] [Google Scholar]
- Utting JF, Thomas DL, Gadian DG, Ordidge RJ. Understanding and optimising the amplitude modulated control for multiple-slice continuous arterial spin labelling. Magn Reson Med. 2005;54 doi: 10.1002/mrm.20604. (in press) [DOI] [PubMed] [Google Scholar]
- Wang J, Alsop DC, Song HK, Maldjian JA, Tang K, Salvucci AE, Detre JA. Arterial transit time imaging with flow encoding arterial spin tagging (FEAST) Magn Reson Med. 2003;50:599–607. doi: 10.1002/mrm.10559. [DOI] [PubMed] [Google Scholar]
- Wong EC, Buxton RB, Frank LR. Quantitative imaging of perfusion using a single subtraction (QUIPSS and QUIPSS II) Magn Reson Med. 1998;39:702–8. doi: 10.1002/mrm.1910390506. [DOI] [PubMed] [Google Scholar]
- Ye FQ, Berman KF, Ellmore T, Esposito G, van Horn JD, Yang Y, Duyn J, Smith AM, Frank JA, Weinberger DR, Mclaughlin AC. H215O PET validation of steady-state arterial spin tagging cerebral blood flow measurements in humans. Magn Reson Med. 2000;44:450–6. doi: 10.1002/1522-2594(200009)44:3<450::aid-mrm16>3.0.co;2-0. [DOI] [PubMed] [Google Scholar]
- Young WL, Barkai AI, Prohovnik I, Nelson H, Durkin M. Effect of PaCO2 on cerebral blood flow distribution during halothane compared with isoflurane anaesthesia in the rat. Br J Anaesth. 1991;67:440–6. doi: 10.1093/bja/67.4.440. [DOI] [PubMed] [Google Scholar]
- Zhang W, Williams DS, Detre JA, Koretsky AP. Measurement of brain perfusion by volume-localized NMR spectroscopy using inversion of arterial water spins – accounting for transit-time and cross-relaxation. Magn Reson Med. 1992;25:362–71. doi: 10.1002/mrm.1910250216. [DOI] [PubMed] [Google Scholar]
- Zhou JY, Wilson DA, Ulatowski JA, Trajstman RJ, van Zijl PCM. Two-compartment exchange model for perfusion quantification using arterial spin tagging. J Cereb Blood Flow Metab. 2001;21:440–55. doi: 10.1097/00004647-200104000-00013. [DOI] [PubMed] [Google Scholar]


