Abstract
The elliptical centric (EC) view order samples a 3DFT acquisition from the center of k-space outward, and when applied to contrast-enhanced MR angiography (CE-MRA) provides intrinsic venous suppression. This is because the veins enhance several seconds after the scan is initiated, and are thus encoded solely by noncentral k-space frequencies. A separate method, sensitivity encoding (SENSE), accelerates the k-space sampling rate by reducing the phase FOV or, equivalently, by increasing the k-space sampling interval, and has been used to increase spatiotemporal resolution. We hypothesized that by combining SENSE with EC, sampling of central k-space would be accelerated and the k-space radius at which the veins first showed contrast enhancement would be increased over a reference scan, thus providing improved venous suppression and spatial resolution without additional scan time. This hypothesis was studied with the use of phantom and carotid CE-MRA experiments, and the results demonstrated an approximate 25% reduction in venous signal when SENSE was used.
Keywords: SENSE, elliptical centric view order, contrast-enhanced MRA, venous suppression, spatial resolution
Contrast-enhanced magnetic resonance angiography (CE-MRA) has gained clinical acceptance for imaging the vasculature (1–3). The success of the method depends on the balance between delivery of the contrast agent to the vascular site of interest and proper initiation of the acquisition during the arterial phase of contrast arrival. Venous suppression in 3D CE-MRA remains a critical factor in obtaining high-quality angiograms. The elliptical centric (EC) view order exploits the relationship between low spatial frequencies and image contrast by sampling central k-space during arterial contrast enhancement (4,5). Any subsequent venous return is encoded solely by high spatial frequencies in k-space. Thus, venous signals are intrinsically attenuated in the resulting angiogram (6).
Sensitivity encoding (SENSE) is a parallel-imaging method that provides scan time reduction or spatial resolution improvement over reference acquisitions (7), and has gained acceptance for a variety of clinical MR applications (8). In CE-MRA, SENSE has been used to improve spatial resolution and examination efficiency in studies of the carotid (9), pulmonary (10), abdominal (11), and peripheral runoff (12) vasculature. The basis of SENSE is to acquire data using a reduced FOV that would generally cause aliasing, and to use previously measured coil sensitivity maps to account for this in the reconstruction. When applied to enhance spatial resolution, SENSE reduces the phase FOV by a factor R while maintaining the same number of views and scan time as a non-SENSE reference acquisition.
The purpose of this work was to test the hypothesis that when SENSE is utilized to improve spatial resolution in CE-MRA, it can further suppress venous signal when integrated with a properly triggered EC acquisition. Based on the SENSE algorithm's intrinsic requirement to reduce phase FOV, and thus increase Δk in the phase-encode direction, k-space will be traversed farther and central k-space will be sampled more rapidly with SENSE and EC than in a non-SENSE EC reference acquisition of the same scan duration. This will in effect encode the delayed-enhancing venous signals to higher k-space frequencies and reduce their contribution in the reconstructed image. We examined the proposed hypothesis using k-space analysis, as well as both phantom and in vivo experiments.
Materials And Methods
Analysis
The EC view order is determined by the Euclidean distance of each phase encode from the center of k-space in the kY-kZ plane, where Y and Z denote the two phase-encoded axes. Starting from the center of k-space, views of increasing distance from k-space origin are subsequently sampled. Previous work derived the relationship between the k-space radius of an EC view order and relevant scan parameters (13). For a 3D CE-MRA acquisition triggered during arterial enhancement, the specific k-space radius, kvenous, corresponding to the time of venous return, treturn, is represented by
| [1] |
Equation [1] demonstrates that venous enhancement and its resultant contribution to image contrast in the reconstructed angiogram can be simply limited by minimization of the phase FOVs and TR in a properly triggered EC CE-MRA acquisition.
The basis of SENSE is to accelerate the acquisition by increasing the k-space sampling interval Δk by a factor R greater than unity along one or both phase-encoding directions. This is equivalent to a reduction in FOV along the corresponding axes. Thus, allowing for acceleration factors RY and RZ along the Y and Z axes, respectively, Eq. [1] can be modified for the SENSE case:
| [2] |
Thus it is seen in Eq. [2] that for a given venous return time treturn, the smallest k-space radius kvenous containing venous signal is larger with SENSE than for the corresponding non-SENSE reference case. As kvenous increases, the reconstructed venous signal is gradually reduced, principally because a larger central region of k-space is encoded with zero venous-enhanced signals. Therefore, we anticipate that SENSE will further suppress venous signal and improve spatial resolution in CE-MRA without prolonging scan time when combined with an EC view order triggered during peak arterial enhancement.
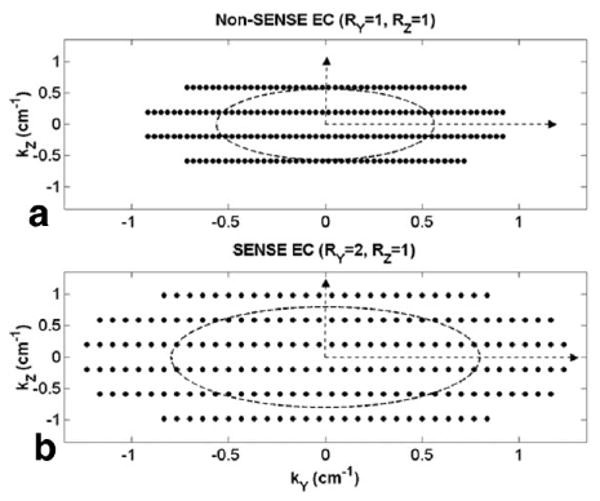
Figure 1a and b are simplified k-space plots of the accumulated EC trajectory for the first 200 views as seen in the kY-kZ plane for reference non-SENSE (RY = RZ = 1) and SENSE acquisitions (RY = 2, RZ = 1), respectively. The plots were generated with the following parameters: FOVX = FOVY = 30 cm, FOVZ = 2.56 cm, Δz = 1.6 mm, TR = 8.5 ms, and sampling matrix = 256 × 128 × 16. The dashed ellipses in both plots correspond to a venous return time that occurs approximately 70 repetitions after the start of the EC acquisition. It is evident in Fig. 1b that a twofold reduction in FOVY by SENSE has allowed the EC trajectory to expand farther in k-space by increasing Δk along the SENSE-encoded axis (kY in this example). Consequently, k-space is more sparsely sampled, central k-space is acquired more quickly, and higher spatial frequencies are collected than in a reference acquisition.
FIG. 1.

Simplified illustrations of the accumulated k-space trajectory with EC view order for (a) non-SENSE and (b) twofold Y-SENSE cases in the kY-kZ plane, using scan parameters from the flow phantom study. The first 200 views are shown in each plot. Note the greater k-space area coverage with SENSE EC in b due to a twofold increase in ΔkY.
When SENSE is applied to 3DFT acquisitions, the use of two phase-encode directions allows flexibility in obtaining improved spatial resolution. In the approach presented in Fig. 1b, improved resolution is obtained in both Y and Z for the 200 EC-ordered views plotted, even though SENSE was only applied along Y. In contrast, in the phantom and in vivo experiments described below, the resolution improvement was solely along Y.
Flow Phantom Experiment
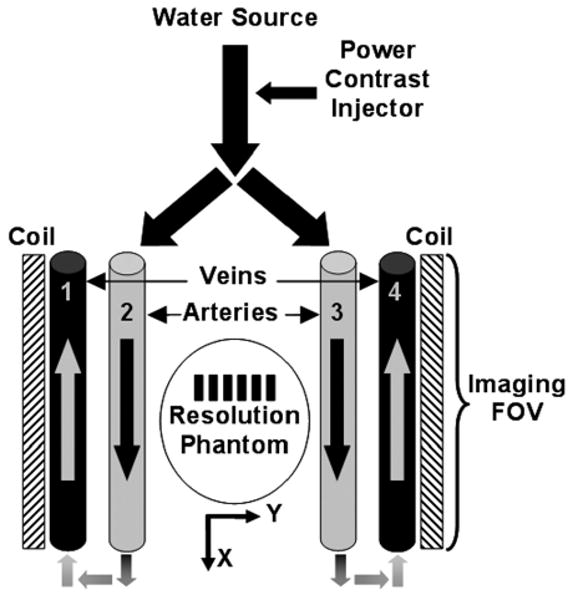
We designed a flow phantom to test our hypothesis. Figure 2 shows a schematic of the experimental setup. Four parallel tubes with an inner diameter of 5 mm were placed in the center of a GE 1.5T Signa scanner (GE Medical Systems, Milwaukee, WI). A variable-rate flow pump linked to an electronically-controlled contrast injector (Medrad Spectris Solaris; Medrad Inc., Indianola, PA) provided continuous flow and controlled quantities of Gd-contrast agent (Magnevist; Berlex Imaging, Wayne, NJ). Two surface coils measuring 34 cm in length and 15 cm in width were placed along the Y (L/R) axis, one on each side of the phantom. A static resolution phantom was placed between the tubes. Flow initially entered and exited the imaging FOV through two of the inner tubes (labeled “arteries”). After a time delay dictated by an additional length of tubing, flow returned to the imaging FOV via the two remaining outer tubes (labeled “veins”). Small (2-mL) test boluses were used to measure the arterial and venous contrast arrival times of the setup, which were 7 and 14 s, respectively. Based on these time measurements and the artery-to-vein contrast transit window (Δt), six sets of EC scans were acquired using the start times of the EC acquisition window (Tstart = 6, 7, 8, 10, 12, 14 s) after contrast injection (t = 0 s). For each scan, a pair of non-SENSE and SENSE images was obtained. For all cases, the non-SENSE acquisition was obtained first, followed (after adequate flushing with saline) by the SENSE scan. Coronal slices (X-S/I, Y-L/R, Z-A/P) were acquired by means of a 3D spoiled gradient echo with EC view order and the following parameters: TR/TE = 8.5 ms/1.6 ms, flip angle = 30°, FOVX = 30 cm, FOVy = 30 cm, Δz = 1.6 mm, sampling matrix = 256 × 128 × 16, and scan time = 18 s. A protocol of 25 mL of contrast followed by an equal volume of saline flush was injected at a rate of 1.5 mL/s. For the SENSE examinations, a twofold acceleration along Y was applied (RY = 2), while all other parameters were kept the same as for the non-SENSE case.
FIG. 2.

Schematic of the flow phantom. Arrows define directional flow within the tubes, and arteries (tubes 2 and 3) and veins (tubes 1 and 4) are labeled. Note the static resolution phantom, and placement of surface coils along the L/R Y-axis.
Human Studies
CE-MRA studies of the carotid arteries were performed in seven healthy volunteers on a GE 1.5T Signa scanner. Institutional review board approval and volunteer consent were obtained prior to the studies. The neck vessels were chosen as the vasculature of interest primarily because the artery-to-vein bolus transit time is on the order of 5–10 s, and thus it is highly probable that some degree of venous contamination will occur. The CE-MRA protocol was performed with the volunteers placed supine on the scanner table. Two circular coils measuring approximately 15 cm in diameter were secured on the left and right sides of each subject's neck. A 2-mL test bolus was used for contrast arrival timing measurements in each study, and the proper start of the EC acquisition window was subsequently determined. This was followed by identical non-SENSE and SENSE examinations, with a wait period of 10 min between the scans to allow the first contrast bolus to adequately clear the vasculature and surrounding tissue. Table 1 summarizes the order of the scans and contrast arrival times for each of the seven volunteers. Coronal slices (X-S/I, Y-L/R, Z-A/P) were acquired for all studies by means of a 3D spoiled gradient echo with EC view order and the following parameters: TR/TE = 8 ms/1.6 ms, flip angle = 45°, FOVX = 24 cm, FOVY = 18 cm, FOVZ = 6.72 cm, Δz = 1.4 mm, sampling matrix = 256 × 192 × 48, and scan time = 1 min 14 s. A protocol of 19 mL of Gd-contrast infused at 3 mL/s followed by 25 mL of saline flush at 2 mL/s was used. For SENSE acquisitions, an acceleration factor of RY = 2 was applied, while all other values were kept constant to ensure a scan time equal to that of the corresponding reference non-SENSE scan. The same trigger time after contrast injection was used for both the non-SENSE and SENSE examinations in each study. For volunteers 5–7, a mask acquisition was also acquired prior to each non-SENSE or SENSE CE examination.
Table 1.
Summary of Acquisition Parameters and Evaluation for Seven Volunteers*
| Volunteer no. | First scan | Contrast arrival time carotid artery, jugular vein (s) |
Artery to vein transition window Δt (s) |
Elliptical centric acquisition trigger (s) |
Venous suppression score |
|---|---|---|---|---|---|
| 1 | SENSE | 14,20 | 6 | 15 | 2 |
| 2 | Non-SENSE | 13,20 | 7 | 13 | 0 |
| 3 | SENSE | 17,23 | 6 | 18 | 2 |
| 4 | Non-SENSE | 17,26 | 9 | 18 | 0 |
| 5 | Non-SENSE | 13,17 | 4 | 13 | 1 |
| 6 | Non-SENSE | 17,23 | 6 | 18 | 2 |
| 7 | SENSE | 17,21 | 4 | 17 | 1 |
Scoring is described in the text.
SENSE-reconstructed and reference non-SENSE images of the seven volunteers were reviewed by three of the authors. Specifically, the reviewers assessed the ability of SENSE to suppress venous signal by evaluating full MIPs, targeted MIPs of the jugular veins, and individual partitions from each volunteer. Grading was done on a five-point scale, according to the intensity of the jugular vein signal in the SENSE image relative to that in the corresponding non-SENSE image (−2 = non-SENSE significantly lower, −1 = non-SENSE moderately lower, 0 = equivalent, 1 = SENSE moderately lower, and 2 = SENSE significantly lower). Scoring was obtained by consensus.
Results
Flow Phantom Experiment
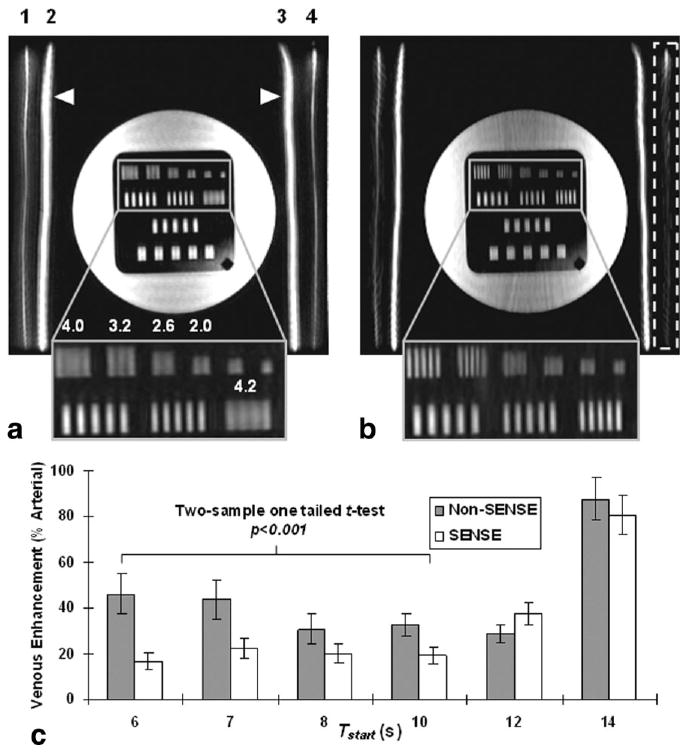
Figure 3 shows maximum intensity projection (MIP) images from the flow phantom experiment for Tstart = 10 s, depicting peak arterial enhancement throughout tubes 2 and 3 (white arrowheads). Improvement in spatial resolution is evident in the SENSE image (Fig. 3b): the first and second rows of bars in the resolution phantom (enlarged insets) are better resolved than those in the non-SENSE image (Fig. 3a). The distance per line pair in millimeters for each improved set of bars is indicated. Veins (tubes 1 and 4) show noticeable contrast enhancement in the non-SENSE image (Fig. 3a). In contrast, the corresponding SENSE image (Fig. 3b) depicts significant venous suppression, especially in tube 4 (dashed box), where it is hardly noticeable. Both normalized images in Fig. 3 are displayed on the same grayscale. In Fig. 3c, a bar plot of venous enhancement as a percentage of arterial signal is shown for the six Tstart values used in the flow phantom experiment. Mean and standard deviation (SD) measurements were collected from regions of interest (ROIs) throughout vessels 1–4 in both the non-SENSE and SENSE images. Since the arterial and venous contrast arrival times were 7 and 14 s, respectively, EC scans with Tstart values between 6 and 10 s were considered properly triggered. In these images, SENSE significantly reduced venous signal compared to corresponding non-SENSE images (P < 0.001, two-sample one-tailed t-test). For Tstart values beyond 10 s (Tstart = 12–14 s), SENSE was unsuccessful at further suppressing venous enhancement, principally because the scan was initiated at the onset of the venous phase, and corresponding signal was mapped mainly to central k-space.
FIG. 3.

MIP images from the flow phantom experiment using EC view order (a) without SENSE and (b) with SENSE for Tstart = 10 s. Note the improvement in resolution bars (enlarged inset). The distance per line pair for each set of better-resolved bars is indicated in millimeters. Numbers above the vessels in image a correspond to those in Fig. 2. Note the significant venous suppression with SENSE for vessel 4 (dashed box) in b. c: Bar graph illustrating venous enhancement (% arterial signal) versus Tstart for non-SENSE and SENSE acquisitions. SENSE significantly suppressed venous signal (P < 0.001) for Tstart values < 10 s (Tstart = 6–10 s). For Tstart = 12–14 s, venous overlay was not suppressed by SENSE, principally because the EC acquisition was initiated during onset of the venous phase.
Human Studies
Table 1 summarizes the evaluation scores for all volunteers. In two of these studies (studies 2 and 4), jugular vein signal intensity was similar in both the SENSE and non-SENSE image sets. This is because these two volunteers exhibited relatively long artery-to-vein contrast transit times (7 and 9 s, respectively), and the corresponding non-SENSE EC provided high venous suppression, leaving little room for improvement. Positive scores were assigned to the remaining five study cases, in which SENSE successfully demonstrated its ability to minimize venous overlay (P < 0.05, two-sided Wilcoxon signed-rank test).
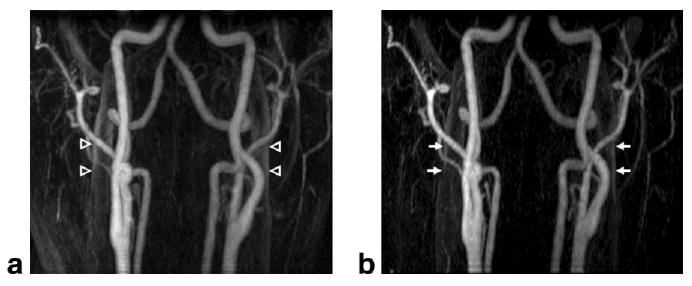
Figure 4 illustrates mask-subtracted MIP images from volunteer 7. Both results depict excellent contrast enhancement in the carotid and vertebral arteries. Although the non-SENSE and mask-subtracted EC result (Fig. 4a) has a high degree of venous suppression, improved venous suppression in the SENSE image (Fig. 4b) is still evident. Areas of jugular vein enhancement are noted with arrows in both figure parts. The moderate improved suppression of venous signal with SENSE, measured at approximately 20%, yielded a score of “+ 1” from the reviewing authors.
FIG. 4.

Results from volunteer study 7, in which the SENSE scan was acquired first. Mask-subtracted MIP images are shown for (a) non-SENSE and (b) SENSE acquisitions. Areas of venous enhancement are noted in the (a) non-SENSE image (open arrowheads), while corresponding locations in the (b) SENSE image (arrows) show significant venous suppression of approximately 20%, and improved conspicuity of the arteries.
Discussion
The present work demonstrates the ability of SENSE to simultaneously improve venous suppression and enhance spatial resolution in 3D CE-MRA when used with a properly initiated EC acquisition. In previous studies the benefits of SENSE and the EC view order were shown separately: the former was used to either reduce scan time (9,10) or enhance spatial resolution (11,12), and the latter was employed to acquire arterial-phase angiograms with limited venous contamination (14,15). To our knowledge, this is the first work to analyze the improved venous suppression provided by SENSE in an EC acquisition of fixed duration.
Because SENSE fundamentally requires a reduction in phase FOV, and thus increases Δk, its combination with an EC view order intrinsically forces kvenous to increase for a given set of acquisition parameters. Consequently, venous signal is encoded to a greater degree by high-spatial-frequency views, which generally results in an overall diminished venous signal.
In the current phantom and volunteer studies, significant differences in k-space trajectory, k-space sampling area coverage, and degree of venous suppression were observed for a SENSE factor of 2 along the Y-axis. Larger SENSE factors R can further accentuate the difference in the k-space trajectory and the degree of venous suppression between otherwise similar non-SENSE and SENSE EC acquisitions. However, caution should be taken when large acceleration factors are used, because the SNR of the SENSE-acquired images intrinsically drops as a function of R. Furthermore, larger R factors can potentially lead to SENSE reconstruction artifacts as a consequence of poor coil geometry (high g-factors) and ill-conditioned sensitivity matrices (7).
It is also important to note that the ability of SENSE to reduce venous contamination depends significantly on a properly triggered EC acquisition. SENSE is unable to limit venous overlay in acquisitions that are triggered too late, principally because the corresponding signals are mapped to lower-spatial-frequency views, closer to the k-space origin. In addition, we observed in the volunteer studies that due to mapping of the venous contrast signal to higher-spatial-frequency phase encodes, SENSE provided some modest edge enhancement of the veins. However, the subtlety of this should not affect the clinical interpretation.
Another possible use of SENSE would be to reduce scan time while maintaining a fixed spatial resolution with respect to a reference non-SENSE scan. This would inherently minimize venous contamination because it allows the MRA acquisition to be completed in a shorter scan time, possibly even prior to venous return. This should be distinguished from our present aim, which is to exploit SENSE with EC for additional venous suppression and the intrinsic benefit of improved spatial resolution.
Acknowledgments
Grant sponsor: NIH; Grant number: HL37310; HL70620; EB00212; Grant sponsor: GE Medical Systems.
References
- 1.Prince MR, Yucel EK, Kaufman JA, Harrison DC, Geller SC. Dynamic gadolinium-enhanced three-dimensional abdominal MR arteriography. J Magn Reson Imaging. 1993;3:877–881. doi: 10.1002/jmri.1880030614. [DOI] [PubMed] [Google Scholar]
- 2.Prince MR. Gadolinium-enhanced MR aortography. Radiology. 1994;191:155–164. doi: 10.1148/radiology.191.1.8134563. [DOI] [PubMed] [Google Scholar]
- 3.Prince MR, Grist TM, Debatin JF. 3D contrast MR angiography. 3rd. Berlin: Springer; 2003. [Google Scholar]
- 4.Wilman AH, Riederer SJ. Improved centric phase encoding orders for three-dimensional magnetization-prepared MR angiography. Magn Reson Med. 1996;36:384–392. doi: 10.1002/mrm.1910360309. [DOI] [PubMed] [Google Scholar]
- 5.Wilman AH, Riederer SJ, King BF, Debbins JP, Rossman PJ, Ehman RL. Fluoroscopically triggered contrast-enhanced three-dimensional MR angiography with elliptical centric view order: application to the renal arteries. Radiology. 1997;205:137–146. doi: 10.1148/radiology.205.1.9314975. [DOI] [PubMed] [Google Scholar]
- 6.Maki JH, Prince MR, Londy FJ, Chenevert TL. The effects of time varying intravascular signal intensity and k-space acquisition order on three-dimensional MR angiography image quality. J Magn Reson Imaging. 1996;6:642–651. doi: 10.1002/jmri.1880060413. [DOI] [PubMed] [Google Scholar]
- 7.Pruessmann KP, Weiger M, Scheidegger MB, Boesiger P. SENSE: sensitivity encoding for fast MRI. Magn Reson Med. 1999;42:952–962. [PubMed] [Google Scholar]
- 8.van den Brink JS, Watanabe Y, Kuhl CK, Chung T, Muthupillai R, Van Cauteren M, Yamada K, Dymarkowski S, Bogaert J, Maki JH, Matos C, Casselman JW, Hoogeveen RM. Implications of SENSE MR in routine clinical practice. Eur J Radiol. 2003;46:3–27. doi: 10.1016/s0720-048x(02)00333-9. [DOI] [PubMed] [Google Scholar]
- 9.Golay X, Brown SJ, Itoh R, Melhem ER. Time-resolved contrast-enhanced carotid MR angiography using sensitivity encoding (SENSE) AJNR Am J Neuroradiol. 2001;22:1615–1619. [PMC free article] [PubMed] [Google Scholar]
- 10.Ohno Y, Kawamitsu H, Higashino T, Takenaka D, Watanabe H, Van Cauteren M, Fujii M, Hatabu H, Sugimura K. Time-resolved contrast-enhanced pulmonary MR angiography using sensitivity encoding (SENSE) J Magn Reson Imaging. 2003;17:330–336. doi: 10.1002/jmri.10261. [DOI] [PubMed] [Google Scholar]
- 11.Weiger M, Pruessmann KP, Kassner A, Roditi G, Lawton T, Reid A, Boesiger P. Contrast-enhanced 3D MRA using SENSE. J Magn Reson Imaging. 2000;12:671–677. doi: 10.1002/1522-2586(200011)12:5<671::aid-jmri3>3.0.co;2-f. [DOI] [PubMed] [Google Scholar]
- 12.Maki JH, Wilson GJ, Eubank WB, Hoogeveen RM. Utilizing SENSE to achieve lower station sub-millimeter isotropic resolution and minimal venous enhancement in peripheral MR angiography. J Magn Reson Imaging. 2002;15:484–491. doi: 10.1002/jmri.10079. [DOI] [PubMed] [Google Scholar]
- 13.Fain SB, Riederer SJ. Dependence of venous enhancement on the field of view in 3D contrast-enhanced MRA using the elliptical centric view order. Magn Reson Med. 2001;45:1134–1141. doi: 10.1002/mrm.1151. [DOI] [PubMed] [Google Scholar]
- 14.Wilman AH, Riederer SJ, Huston J, 3rd, Wald JT, Debbins JP. Arterial phase carotid and vertebral artery imaging in 3D contrast-enhanced MR angiography by combining fluoroscopic triggering with an elliptical centric acquisition order. Magn Reson Med. 1998;40:24–35. doi: 10.1002/mrm.1910400104. [DOI] [PubMed] [Google Scholar]
- 15.Huston J, 3rd, Fain SB, Riederer SJ, Wilman AH, Bernstein MA, Busse RF. Carotid arteries: maximizing arterial to venous contrast in fluoroscopically triggered contrast-enhanced MR angiography with elliptic centric view ordering. Radiology. 1999;211:256–273. doi: 10.1148/radiology.211.1.r99ap08265. [DOI] [PubMed] [Google Scholar]


