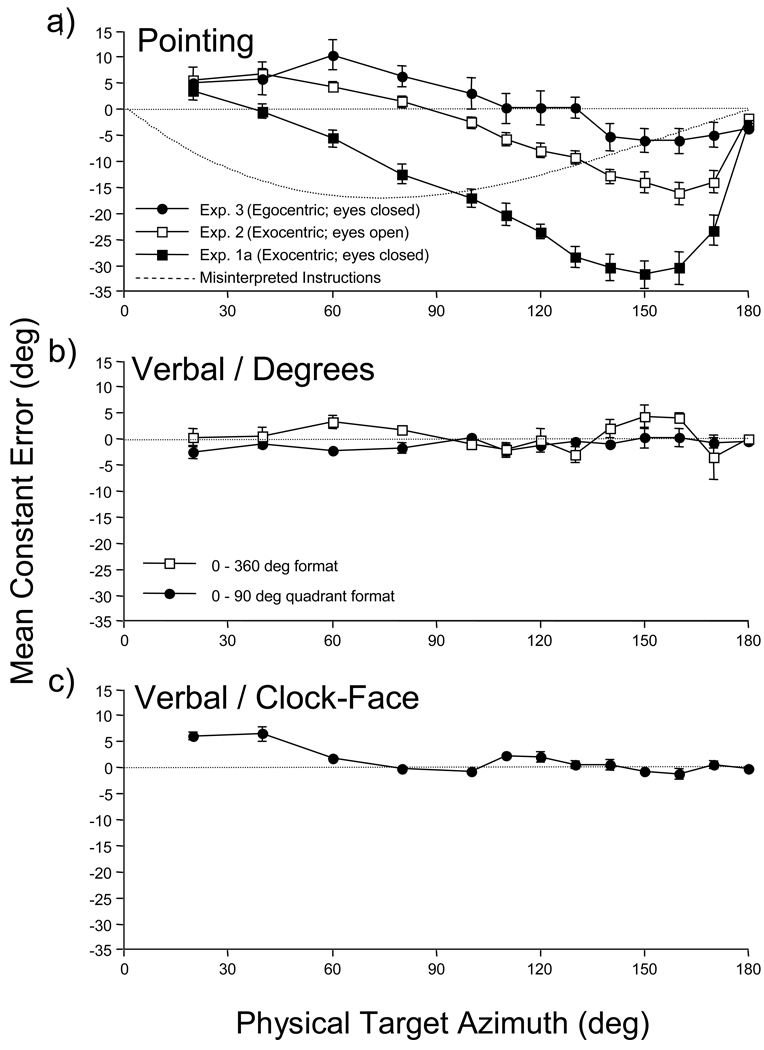
Figure 2.
Mean constant errors (bias) for the various response measures in Experiments 1a, 2 and 3. Responses are collapsed over side (left vs. right) for Experiments 1a and 2. The dotted horizontal line on each panel denotes accurate performance. Negative errors are associated with responses that underestimated the target azimuth, i.e., were too close to the origin. Error bars show +/− one standard error of the mean. (a) Manual pointing responses for Experiments 1a, 2 and 3. Pointing in Experiments 1a and 3 was conducted without vision; Experiment 2 was conducted with full vision of the laboratory, target, and pointing apparatus. The dashed line shows the pattern of errors that would be expected if participants ignored the exocentric instruction to aim the pointer at the target, and instead set the pointer to reproduce the target azimuth defined relative to the center of the chair. (b) Verbal / Degree estimates in Experiment 1a. Responses using the 0 – 360 deg format and the 0 – 90 deg quadrant format are shown. (c) Verbal Clock-Face estimates in Experiment 1a.

