Abstract
It has been known for more than a decade that intracranial aneurysms can be successfully treated by deploying a porous meshed tube in the parent vessel of the aneurysm. Such devices are currently called flow diverters because they promote intraneurysmal flow stasis and thrombosis by diverting blood flow away from the aneurysm sac. The objective of this study was to use angiographic data to quantify and compare the performance of flow diverters of original design in successfully occluding an experimental aneurysm model. Three different configurations of a novel flow diverter with varying porosities and pore densities were implanted in thirty rabbit elastase-induced aneurysms. Temporal variations in angiographic contrast intensity within the aneurysms were fit to a mathematical model. Optimized model parameters were supplemented by the angiographic percentage aneurysm occlusion and an angiographic measure of device flexibility to derive composite scores of performance. Angiographic quantification further suggested a parameter, which could be employed to estimate long-term aneurysm occlusion probabilities immediately after treatment. Performance scores showed that the device with a porosity of 70% and pore density of 18 pores/mm2 performed better than devices with 65% porosity, 14 pores/mm2 and 70% porosity, 12 pores/mm2 with relative efficacies of 100%, 84%, and 76%, respectively. The pore density of flow diverters, rather than porosity, may thus be a critical factor modulating device efficacy. A value of the prognostic parameter of less than 30 predicted greater than 97% angiographic aneurysm occlusion over six months with a sensitivity of 73% and specificity of 82%.
Keywords: Intracranial aneurysm, mathematical modeling, lagged-normal distribution, convection, diffusion, washout coefficient, porosity, pore density, stent
I. INTRODUCTION
Intracranial aneurysms are abnormal focal dilations of the cerebral vasculature that may rupture and cause a hemorrhagic stroke. More than a decade ago, seminal experimental animal studies suggested that intracranial aneurysms could be successfully treated solely by the deployment of porous meshed tubes (stents) within the parent artery of the aneurysm [1-3]. These studies noted that the stents divert blood flow away from the aneurysm and into the parent vessel. The resultant reduction of intraaneurysmal flow activity could potentiate intraneurysmal thrombus formation and eventually lead to exclusion of the aneurysm from the circulation. Subsequent in vitro experiments provided evidence of the flow stasis induced inside aneurysms after stent deployment and attempted to quantify the relationship between device parameters (such as porosity or pore density) and alteration of intraaneurysmal flow [4]. Clinical evidence also exists supporting the notion of successfully treating intracranial aneurysms with stent deployment only [5, 6].
A flow diverter differs from a stent in that it has its porosity (ratio of metal-free surface area to total surface area) and pore density (number of pores per unit surface area) optimized to facilitate occlusion of aneurysms. Until recently, none of the devices tested and used were designed to act as flow diverters, but instead as scaffolds for coils or stenotic arteries, i.e., as stents. An appropriately designed flow diverter severely attenuates the flow exchange between the parent vessel and the aneurysm, resulting in the formation of intra-aneurysmal flow stasis zones which promote thrombosis, while at the same time maintaining patency of arterial side branches that may emanate from the treated vessel segment. Interest in flow diverters has gathered momentum over the past couple of years and a few such devices are currently being tested [7-9].
Attempts to quantify blood flow from analysis of the transport of angiographic contrast have commonly revolved around the measurement of the temporal variation of contrast intensity within specified regions of interest of the vasculature [10]. Quantification of these contrast intensity-time curves has involved fitting the curves with mathematical equations such as exponential, polynomial, log-normal, gamma-variate, or lagged-normal functions. As intracranial aneurysms are regions with distinct flow patterns and can be conveniently demarcated from the vasculature, such techniques have been used to quantify intraaneurysmal hemodynamics based on angiographic acquisitions. The intent of such quantification is to facilitate a prognosis of the endovascular treatment based on the degree of contrast stasis within the aneurysm. Gamma-variate, single- and double- exponential, polynomial, and lagged-normal models have been fit to temporal variations in angiographic contrast intensity within aneurysmal regions of interest [11-13]. Optimized model parameters obtained from curve-fitting were then employed to quantify treatments with stents or coils based on the changes in the contrast-intensity curves pre- and post-treatment.
We have developed an appropriately designed flow diverter with low porosity and high pore density for the treatment of intracranial aneurysms. Three different configurations of the device were evaluated in a rabbit aneurysm model. Alterations in the flow exchange between the parent vessel and the aneurysm due to the devices were quantified via angiographic contrast-intensity time curves (called aneurysmal washout curves here). The aneurysm occlusion rate and a device flexibility measure were calculated from angiographic images. Based on these quantities, a composite device performance score was constructed, which allowed for the comparison of the three device configurations and the selection of one configuration that produced the most consistent and stable aneurysm occlusion in vivo.
II. METHODS
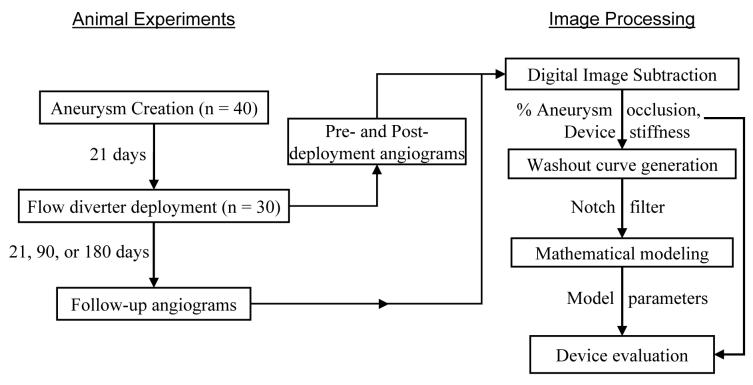
The flowchart in Fig. 1 provides an overall description of the methods used in this study. Elastase-induced aneurysms were created in 40 rabbits and, three weeks later, 30 of these were treated with 3 flow diverters (10 animals per device), while 10 aneurysms were used as controls. Animals were terminated at the scheduled follow-up times of 3 weeks (n=12, 3 animals per treatment group), 3 months (n=12, 3 animals per group), or 6 months (n=16, 4 animals per group) post-treatment. Three high-speed angiographic sequences were acquired during experiments on each animal; two of these sequences were acquired during the implant phase and one was acquired at follow-up. Angiographic sequences were logarithmically subtracted and aneurysmal washout curves recorded. Artifacts at the respiratory frequency of the animal were removed from the washout curves with a notch filter and the curves were subsequently fit to a mathematical model. Changes in optimized model parameters due to device implantation were then used as indices of device efficacy in conjunction with the angiographic percentage occlusion of aneurysms and a device stiffness measure.
Fig. 1.
Overview of methods.
A. Animal Experiments
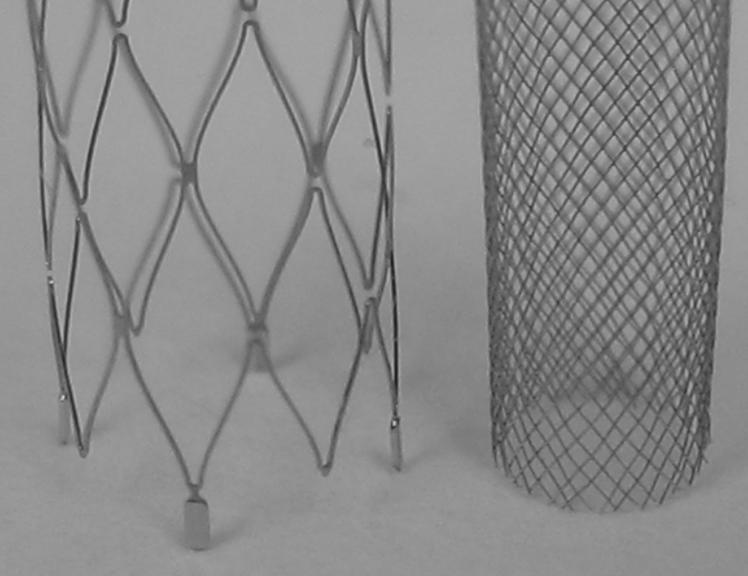
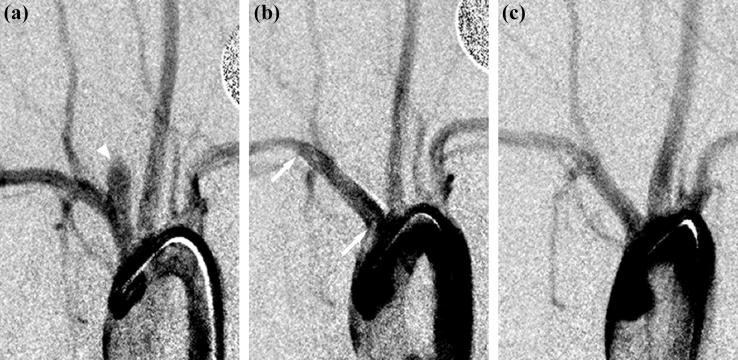
Animal experiments were approved by the Animal Care and Use Committee at our institution. Details for the creation of rabbit elastase-induced aneurysm models are described elsewhere [14]. Briefly, the right common carotid artery is ligated distally and a solution of elastase is incubated at the base of the artery for a period of ten to fifteen minutes. Distal occlusion combined with elastin degradation results in a saccular dilation at the base of the carotid artery; the innominate/subclavian artery then acts as the parent vessel for the aneurysmal sac. The flow diverters used in this study were self-expanding tubular meshes made out of cobalt-alloy; design characteristics of the three different configurations are given in Table I; an image of a flow diverter is shown in Fig. 2. Each device configuration was deployed in the innominate/subclavian artery of ten rabbits through a right transfemoral approach. Deployments were carried out such that the aneurysm necks were approximately situated along the middle of the length of the devices. Animals were then housed for 21 days, 3 months, or 6 months, after which angiographic follow-up was performed before sacrifice. Fig. 3 shows angiograms of one of the aneurysms before device implantation, immediately after device implantation and at follow-up.
Table I.
Design parameters of the 3 flow diverters used in the study.
| Device I | Device II | Device III | |
|---|---|---|---|
| Nominal device diameter | 4 mm | 4 mm | 4 mm |
| Porosity | 70% | 65% | 70% |
| Pore Density (pores/mm2) | 11.7 | 13.9 | 18.3 |
Fig. 2.
Image of one the flow diverter configurations used in the study (at right) in comparison with a commercial intracranial stent (Neuroform™, Boston Scientific). The diameter of the flow diverter is 3.7 mm.
Fig. 3.
Angiograms of an aneurysm (a) before device implantation, arrowhead shows aneurysmal sac; (b) immediately after device implantation (device II), arrows indicate proximal and distal edges of the flow diverter; (c) at follow-up (180 days). Angiographically, the aneurysm is completely occluded.
B. High-Speed Angiographic Acquisition
High-speed angiographic sequences were acquired at 30 frames per second over 20 seconds by injecting 5 cc of angiographic contrast at a rate of 2 cc/s with an injector. The distal tip of the angiography catheter was positioned in the ascending aorta so that the resulting retrograde injection would facilitate rapid mixing of the contrast with the blood and a homogenous contrast-blood mixture would reach the aneurysmal region. Each frame was 512×512 pixels with a spatial resolution of approximately 170 μm/pixel and a depth resolution of 8 bits. The start of contrast injection was delayed by 2 seconds after start of image acquisition to obtain mask images. Three such high-speed sequences were acquired for each animal — before device implantation, immediately after device implantation, and at follow-up — under identical imaging (image to source distance, C-arm orientation, acquisition mode) and injection (injection volume, injection rate, preset delay) parameters.
C. Digital Image Subtraction
All image processing described herein was done using Matlab® (The Mathworks, Natick, MA). In the rabbit elastase-induced aneurysm model, the innominate artery (parent artery of the aneurysm) is within the thoracic cavity and the aneurysm-parent vessel complex undergoes a displacement that is synchronous with the respiration of the animal. To subtract the angiographic sequences obtained in these animals, therefore, each mask image had to be subtracted from a contrast image acquired at the same point in the respiratory cycle of the rabbit.
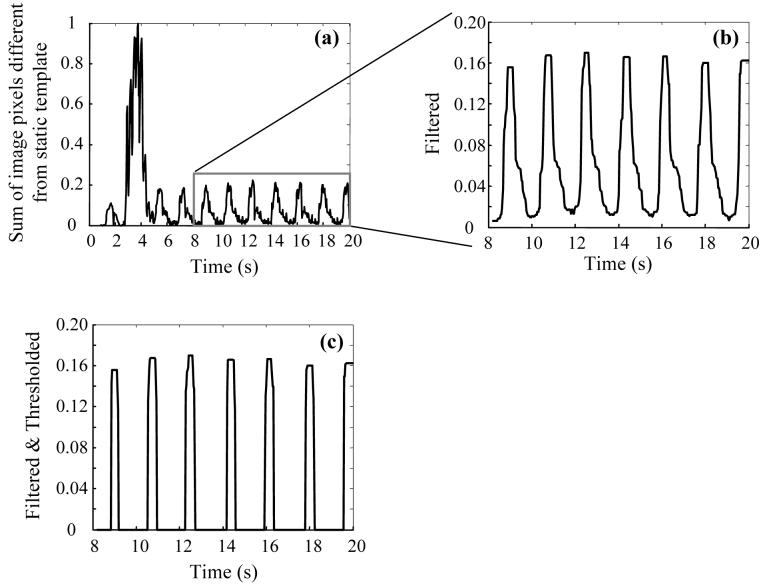
The respiratory rate of the animal was automatically calculated from the angiographic sequences by adapting an algorithm published previously for determining heart rates from electrocardiogram or photoplethysmogram traces [15]. In each angiographic sequence, the average of 15 images from the beginning of acquisition was used as a ‘static’ background template. In almost all cases, the bent edge of the injection catheter resting against the aortic arch and a calibration dime placed on the animal's chest moved synchronously with the respiration of the animal. By comparing the movement of these objects with the background template, a trace as shown in Fig. 4a was recorded where fluctuations corresponding to the respiratory rate of the animal are evident. A section of this trace was then filtered with a 15 point median filter (Fig. 4b) and thresholded at 6 times the standard deviation (Fig. 4c) to give spikes at approximately the maximal expiration points. The respiratory rate (frames per second) could be determined from the average distance between the centers of these spikes. A mask set of images comprising one respiratory cycle of the animal was chosen from the angiographic sequence before start of contrast injection. Subsequently acquired images were then grouped into respiratory periods and the images in the mask set were individually subtracted from the corresponding images in each set of contrast images.
Fig. 4.
Calculation of respiratory rate of the animal. a) sum of image pixels with values different than the static background template (see text), normalized; b) region enclosed by rectangle in panel (a) filtered, and c) thresholded.
D. Percentage Aneurysm Occlusion & Distance Metric
One image representing maximal contrast opacification of the aneurysm was selected from each of the 3 angiographic sequences acquired for each animal. The aneurysm was then manually delineated as a region of interest (ROI) in each image and the number of pixels in the ROI was used to calculate the angiographic percentage aneurysm occlusion at follow-up as
| (1) |
where, A1 was the aneurysm area (in pixels) before device implantation and A2 was the corresponding aneurysm area at follow-up.
Implantation of the flow diverter in the parent artery reduces the curvature of the artery. This change in curvature was quantified with the distance metric [16], given as the ratio of the arc length of the treated vessel segment to the straight line distance between the segment end points (chord length). The centerline of the innominate artery from its origin at the aortic arch to the origin of the vertebral artery was manually selected in images acquired before and immediately after device implantation. The change in curvature due to device implantation was then quantified as the percentage ratio of the distance metrics
| (2) |
where, s1 and l1 were the arc and chord lengths before device implantation and s2 and l2 were the arc and chord lengths after device implantation, respectively. Higher values of this percentage ratio imply less change in the curvature of the artery due to the device and therefore indicate higher longitudinal flexibility of the device.
E. Aneurysmal Washout Curves
The flow exchange between the aneurysm and the parent vessel in any angiographic sequence was measured by recording the aneurysmal washout curve, which was the temporal variation in the average grayscale intensity within the aneurysm as defined previously [11]. As the aneurysm in this model moves in phase with the respiration of the animal, the ROI had to be displaced in accordance with the location of the aneurysm. The position, from the top of the image, of the superior aspect of a segment of the parent vessel approximately 10 pixels wide and immediately distal to the aneurysm was used as a marker for ROI position. The tracking of the ROI does not, however, precisely match the location of the aneurysm throughout the angiographic sequence in all cases, resulting in fluctuations in the aneurysmal washout curves at the respiratory frequency. This frequency component was removed from the washout curves by a notch filter [17] with unity gain at the DC and Nyquist frequencies and a bandwidth of 0.2 or 0.3 Hz. The amplitude of the aneurysmal washout curves is indicative of the amount of angiographic contrast entering the aneurysm. Therefore, larger the reduction in this value after implantation of any given device, the better the device. The value of the washout curve amplitude (indicated by δ) obtained after device implantation as a percentage of the corresponding value before device implantation was used an index of device performance.
F. Mathematical Modeling
The point of significant rise in the filtered aneurysmal washout curves was selected as the average of 3 data points and set to the origin. The washout curve was then normalized based on its maximum value and fit with the following mathematical model in the least squares sense.
| (3) |
The two components of the model represent convective and diffusive processes; ρconv and ρdiff represent the amplitudes and τconv and τdiff represent the time constants of these two processes, respectively; σ and μ are related to the contrast injection profile. Further details on this model have been described previously [11, 18]. For any given device, the aneurysmal washout curves obtained before and after device implantation were fit with the mathematical model and the percentage ratios (post-implant to pre-implant) of the three important optimized parameters (ρdiff, τdiff, ρconv) were used as indices of device performance. The percent sign is used throughout the manuscript to denote a percentage ratio compared to the corresponding pre-implant values and superscripts of PRE, POST, or FU are used to denote the corresponding treatment phase (before device implantation, immediately after device implantation, or follow-up, respectively). For example, ρdiffPOST denotes the absolute value of this model parameter obtained immediately after device implantation, whereas ρdiffPOST % denotes the percentage ratio of the value obtained immediately after device implantation to that obtained before device implantation. The goodness of fit of the mathematical model to the data was evaluated by plotting the model-fits against the data points and calculating the Pearson correlation coefficient. Goodness of fit was also assessed by testing the difference between the model-fit and data for normality based on the Kolmogorov-Smirnov statistic (D statistic) [19]. Normality was assessed at 95% significance so that when the D value was below the critical value of 0.886 (for sample size > 30) the sample was considered to be normally distributed.
G. Device Evaluation
Design characteristics of the three devices are listed in Table I as mentioned previously. The three flow diverters were compared based on the various quantities accumulated from the data as described in the preceding pages. Statistical significance of the differences between diverters was compared by analysis of variance or Student's t tests. Table II lists the indices of device performance, the source of the indices, and the trend (high or low) of each index that indicates a better device. Changes from before device implantation to immediately after device implantation as well as changes from before device implantation to follow-up were evaluated for the 4 indices relating to the washout curve analysis. For a given index, the average value of the index for each device was normalized by the maximum of the three devices to obtain a grade of the effectiveness of each device compared to the best, where the best device received a grade of 1. If lower values of the index implied a better device (washout curve amplitude, convective component amplitude), inverse of the quantities were graded. The sum total of these grades was used as the final composite performance score.
Table II.
Indices of device performance and the corresponding trend that indicates a better device.
| Performance index | Favorable trend |
|---|---|
| Percentage angiographic aneurysm occlusion (AFU %) | High |
| Percentage arc-to-chord ratio (dmPOST %) | High |
| Percentage washout curve amplitude (δPOST % and δFU %) | Low |
| Percentage diffusive component amplitude (ρdiffPOST % and ρdiffFU %) | High |
| Percentage diffusive component time constant (τdiffPOST % and τdiffFU %) | High |
| Percentage convective component amplitude (ρconvPOST % and ρconvFU %) | Low |
H. Predicting Treatment Outcome
Apart from quantifying flow diverter performance, the methodology used here could provide an estimate of whether the treated aneurysm will occlude at follow-up. An index, called the washout coefficient (W) was constructed based on the ability of any given device to reduce the amount of dye entering the treated aneurysm and to drive the aneurysm-parent vessel flow exchange toward a diffusion-dominant mechanism. This index was therefore defined as the (decimal) multiple of the three parameters δ %, ρdiff % and τdiff %. The percentage angiographic occlusion of the aneurysms at follow-up (AFU%) was used as the gold standard for the prognostic test. The test threshold was chosen to maximize the sensitivity and specificity based on the receiver operating characteristic curve for the data. Statistical significance was assessed by Fisher's exact test for the contingency table.
III. RESULTS
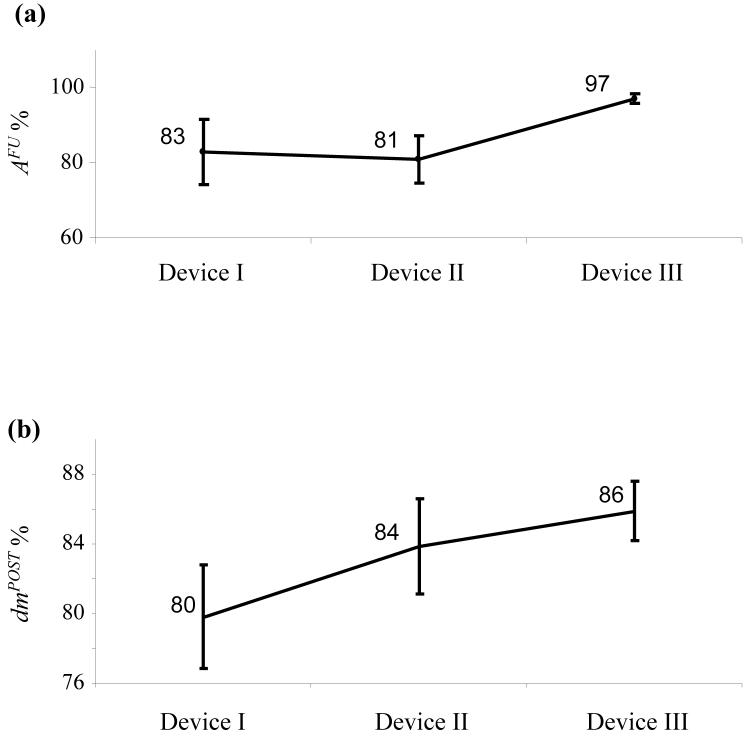
The average (±standard error of mean, SE) neck, width, and height of the 40 aneurysms were 4.1±0.2, 3.7±0.1, and 7.9±0.3 mm, respectively; the average aspect ratio (height-to-neck ratio) of the 40 aneurysms was 2.1±0.1. The neck (p = 0.5), width (p = 0.9), or height (p = 0.3) of the aneurysms were not significantly different between the four groups. The average pre-device deployment parent vessel diameter in the region of the aneurysms was 3.1±0.1 mm; there was no significant difference (p = 0.2, nonparametric ANOVA) between the parent vessel diameters across the treated groups. The devices were easily flow navigated through the aortic arch/innominate artery junction and deployed across the aneurysms. There were no cases of device migration or fracture. All of the side-branches covered by the device struts remained patent at all follow-up time points. Sample angiograms from one case before device deployment, immediately after deployment of device II, and follow-up at 180 days are shown in Fig. 3. The aneurysm can be noted to be completely occluded in this case. The percentage angiographic aneurysm occlusion for each device over all follow-up time points combined is shown in Fig. 5a. In one animal, a segment of the parent artery near the aneurysm had a fusiform dilation slightly more than the open device diameter. The flow was seen to go around the device and into the aneurysm so this case was excluded from the analysis as noted in the sample sizes in the legend. Device III consistently showed high occlusion rates from 21 days through 180 days. Intra- (given device at different follow-up times) or inter- (different devices at given follow-up time point) device differences in angiographic aneurysm occlusion rates were not statistically significant (p > 0.13). The average (±SE) angiographic occlusion rate of control aneurysms was 4.7±1%. Occlusion rates with all 3 devices were significantly higher than controls (p < 10−4). Average changes in the arc-to-chord ratios of the treated vessel segments are shown in Fig. 5b. Inter-device differences were not significant (p = 0.26).
Fig. 5.
(a) Mean percentage occlusion of the aneurysm measured by angiography acquired at follow-up for the 3 flow diverters. (b) Mean values of arc-to-chord ratios of vessel segments after implantation of a device as a percentage of the corresponding values before device implantation. Number of cases, device I (n=10), device II (n=10), device III (n=9). Error bars represent standard error of the mean.
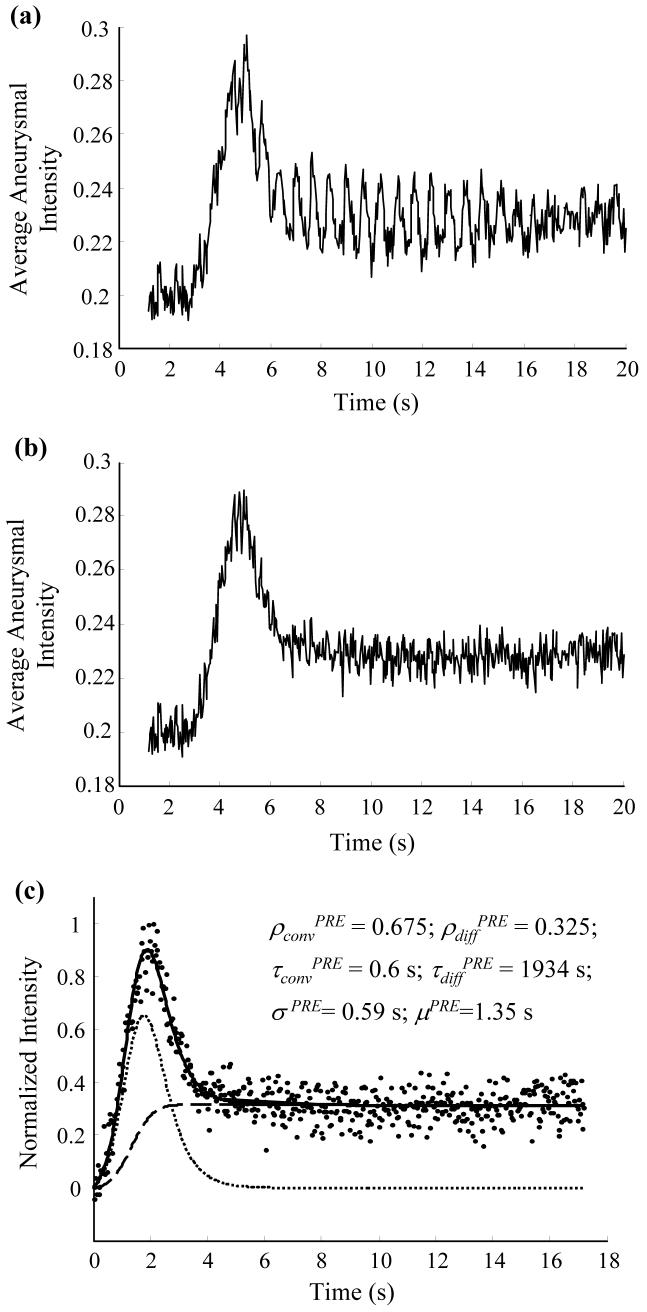
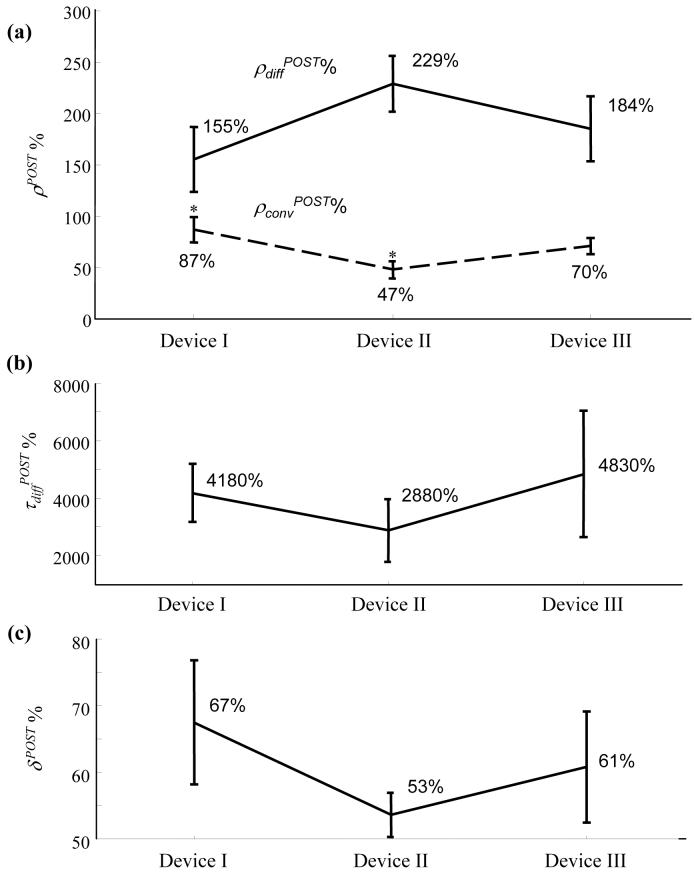
Fig. 6a shows the raw aneurysmal washout curve obtained from one case and Fig. 6b shows the filtered curve after removing the respiratory frequency. Fig. 6c shows the fit of the mathematical model to the filtered curve after normalization. Changes in the three important optimized model parameters (ρconv %, ρdiff %, and τdiff %) and the washout curve amplitudes (δ %) due to device implantation for all the cases are shown in Fig. 7. As noted in the legend, 2 cases were excluded from the washout analysis because the catheter tip was inadvertently placed near the entrance to the innominate artery (resulting in antegrade injection) during the pre-deployment angiograms only, precluding a comparison of pre- to post- changes in intraaneurysmal contrast transport. Values of ρdiff % were not significantly different among the 3 devices (p = 0.22). The ρconv % value for device II was significantly lower than that for device I (p = 0.02), but not significantly lower than that for device III (p = 0.07). The ρconv % values for devices I and III were not significantly different (p = 0.3). Inter-device differences in τdiff % and δ % were not significant (p = 0.63 and 0.48, respectively).
Fig. 6.
Aneurysmal washout curves. (a) Raw washout curve; fluctuations can be observed at the respiratory period of the animal (∼0.67 s). (b) Washout curve after notch filter at the respiratory frequency (∼1.5 Hz). (c) Mathematical model fit to the normalized washout curve; optimized model parameters are listed; washout curve (dots); model-fit (solid line); convective (dotted line) and diffusive (dashed line) components of model are superposed for visualization.
Fig. 7.
Indices of device efficacy obtained from the analysis of aneurysmal washout curves. (a) Mean (standard error) percentage ratios of amplitudes of the convective (ρconv, dashed line) and diffusive (ρdiff, solid line) components immediately after device implantation as a percentage of the corresponding values before device implantation. * The ρconvPOST% value for device II was significantly lower than that for device I (p = 0.016). (b) & (c) Corresponding mean (standard error) values for the diffusive time constant and washout curve amplitude, respectively. Number of samples; device I (n=9), device II (n=10), device III (n=8).
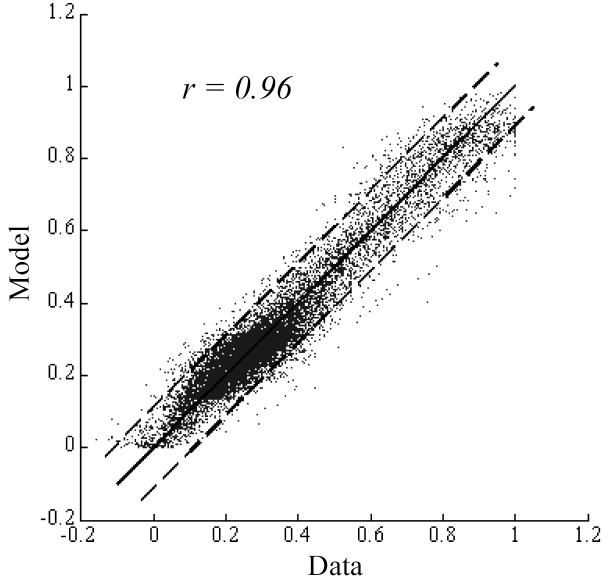
Comparisons of model parameters and washout curve amplitude were also made to quantify changes that occurred over the follow-up period by evaluating the percentage ratios of parameters obtained at follow-up to the corresponding values before device implantation (graphs not shown, see Table III). Fig. 8 shows the goodness of fit of the mathematical model to the washout curve data obtained before device implantation by plotting the model-fits against the data points. The Pearson correlation coefficient for the washout curves obtained immediately after device implantation and at follow-up time were 0.88 and 0.80, respectively. When considered individually, the error between the model-fit and washout curve could be considered to be normally distributed at the 95% significance level in 78% (52 of 67) of the cases based on the Kolmogorov-Smirnov test. In 11 of the 15 remaining cases where the Kolmogorov-Smirnov statistic suggested that the data-model difference could not be considered to be random, the Pearson correlation coefficient was >=0.9.
Table III.
Composite score of device performance. Highlighted cells (value of 1) indicate the device that had the best performance for the given index.
| Results group |
Performance index | Device I |
Device II |
Device III |
|---|---|---|---|---|
| Angiography | Percentage angiographic aneurysm occlusion | 0.86 | 0.83 | 1.00 |
| Percentage arc-to-chord ratio | 0.93 | 0.98 | 1.00 | |
|
| ||||
| Washout analysis |
Percentage washout curve amplitude | 0.79 | 1.00 | 0.88 |
| Percentage diffusive component amplitude | 0.68 | 1.00 | 0.81 | |
| PRE-to- POST |
Percentage diffusive component time constant | 0.86 | 0.60 | 1.00 |
| Percentage convective component amplitude | 0.55 | 1.00 | 0.67 | |
|
| ||||
| Washout analysis |
Percentage washout curve amplitude | 0.25 | 0.29 | 1.00 |
| Percentage diffusive component amplitude | 0.60 | 0.48 | 1.00 | |
| PRE-to- FU |
Percentage diffusive component time constant | 0.93 | 1.00 | 0.55 |
| Percentage convective component amplitude | 0.35 | 0.34 | 1.00 | |
|
| ||||
| Composite score | 6.79 | 7.51 | 8.91 | |
| Relative percent effectiveness | 76% | 84% | 100% | |
Fig. 8.
Goodness of fit of the mathematical model to the washout curves obtained before device implantation assessed by plotting all the data points against the corresponding model-fits. Washout curve data versus model-fits (dots); line of identity (solid line); 95% confidence intervals (dashed lines).
Table III lists the indices of device performance and the grades assigned to each device. Highlighted cells indicate the best performing device for the particular index. As can be noted, device III had the best composite score based on these indices. The performance of the other 2 devices may be expressed relative to the performance of device III. The overall results thus suggest that device III was the best performing device, that device II was about 84% as effective as device III, and that device I was about 76% as effective as device III in treating this set of in vivo aneurysms.
The average washout coefficient value for cases with ≥ 97% aneurysm occlusion at follow-up (21±5) was significantly lower than that for cases with < 97% aneurysm occlusion (51±10); Welch-corrected t test p value = 0.02. Based on the receiver operating characteristic, a threshold value of W = 30 gave the maximum sensitivity and specificity for the prognostic test. Sensitivity and the specificity of the test were 73% and 82%, respectively; Fisher's exact test two-sided p value = 0.03.
IV. DISCUSSION
The concept of successful intracranial aneurysm treatment by flow diversion was proffered more than fifteen years ago [1-3], but clinical implementation of this method is still in its incipient stages. Clinical reports of aneurysm flow diversion have been sparse and based on stents acting as flow diverters; there are currently no commercially available flow diverters for the treatment of intracranial aneurysms. The prognosis of an endovascular treatment for an aneurysm is currently based on a qualitative estimate of the increase in intraaneurysmal residence time of blood as visualized by angiographic contrast stasis within the aneurysm. If any such increase in intraaneurysmal flow stasis could be effectively quantified via the imaging method already in employ, a more reliable prognosis could be made. Previous reports on flow quantification via dye-dilution techniques have suggested that fitting an appropriate mathematical equation to temporally recorded dye-dilution curves can effectively quantify the behavior of the dye and, by inference, of flow [20]. In this study, appropriately designed flow diverters were implanted across experimental aneurysms and the resulting alterations in aneurysm-parent vessel flow exchange were quantified via mathematical modeling of intraneurysmal contrast-dilution curves. Successful and stable aneurysm occlusion was effected by the devices over the study period of six months. The histological results of this study have been presented elsewhere [21].
It may be noted that because only changes in the behavior of intraaneurysmal contrast intensity were modeled, and no conclusions on absolute hemodynamic parameters were drawn, this method of angiographic quantification of device efficacy could be used in any clinical setting involving treatment of aneurysms by flow diversion. Aneurysmal washout curves were normalized and only changes in the model parameters from pre- to post-treatment were used as indices of treatment efficacy. The prerequisite for this method is that injection (catheter position, amount of contrast injected, time for injection) and imaging (source-to-image distance, patient position, C-arm orientation) parameters be kept constant for pre- and post-treatment angiographic acquisition. High-speed acquisitions (more than 10 frames per second) also improve the validity of the model-fit [11]. These parameters can easily be controlled in current clinical angiographic suites. Such angiographic quantification of device performance also requires that contrast enters the aneurysm after device deployment. Clinically, however, if no dye enters the aneurysm after treatment, the prognosis of the treatment is considered to be extremely good. Quantification of device efficacy may not be necessary in these situations. Certain studies have suggested that, especially in intracranial aneurysms, the transport of contrast does not follow the transport of blood. Due to its higher density, contrast is said to settle out of the blood in the gravity direction within aneurysm sacs [22, 23]. This notion has not been borne out by experiments conducted to investigate the mixing of angiographic contrast with blood under conditions similar to most cerebral angiographic acquisitions [24]. The conclusions drawn in this report based on angiographic information may thus be considered to reflect changes in intraaneurysmal blood flow patterns.
The lagged-normal equation was introduced in the literature four decades ago as an appropriate tool for the quantification of dye-dilution curves in the arterial system [20]. Acquisition of angiographic data with high sampling rates imposes a capacity limit (apart from considerations of higher radiation dosage) on the time period for which images may be acquired. Therefore in low flow chambers like aneurysms the dye may not completely wash out of the region of interest at the end of the acquisition period. The contrast intensity curve then has residual non-zero amplitude at the end of the sampling period. In the case of aneurysms, this residual amplitude is caused by slow washout of dye possibly due to intraaneurysmal flow zones that exchange dye by mechanisms that approach the process of diffusion in terms of the time. As the lagged-normal distribution does not allow for a nonzero residual at the end of the modeling time period, a second component (diffusive component) was added to account for the different characteristic of aneurysmal washout curves. The average diffusive time constant (approximately 800 seconds) optimized from the washout curves verifies that this model component represents the process of diffusion. Based on this value of the time constant, the time taken for 95% of the dye to wash out of the aneurysm is about 2400 seconds (−log(0.05)×800). The diffusion coefficient for liquids ranges from 10−8 to 10−10 m2/s [25]. The diffusion length for this process is then about 1.5 mm ((10−9 × 2400)0.5), which is of the same order of any diffusive exchange zone existing within aneurysms. The composite mathematical model used here faithfully captured the trend of all measured aneurysmal washout curves. The goodness of fit of the model was good to excellent in most cases. In cases where the spread of the error in the data with respect to the model was high (low Pearson correlation coefficient), the Kolmogorov-Smirnov test showed that the data points were randomly distributed about the model. Conversely, in cases where the Kolmogorov-Smirnov test suggested a non-random distribution of the error in the fit, the Pearson correlation coefficient was high implying a small spread.
The extent to which a coronary stent reduces the curvature of the implanted artery has been found to be a predictor of major adverse cardiac events [26]. More sophisticated measures of vessel tortuosity have been defined [16, 27], but the distance metric (arc-to-chord ratio) may be sufficient for quantifying changes in the single curvature of the rabbit innominate artery. The maximal change in tortuosity that can be withstood by the neurovasculature is not known, but some intracranial stent implantations suggest that, depending on the parent artery, significant alterations in curvature can be safely induced. Estimated percent variations in the distance metric caused by two stents (Wallstent [11] and Express [6]) implanted in the vertebrobasilar region without any complications were approximately 75% and 89%. The changes induced by all three flow diverters in the rabbit innominate artery were within this range (Fig. 5b).
Generating a composite performance score allowed for consolidation of the various angiographic indices into a single metric. Based on this score, the device with the highest pore density (Device III) was seen to perform the best in successfully and stably occluding these in vivo aneurysms in light of the fact that the porosities of Devices I and III were the same. Although only three different pore densities were evaluated here, the composite performance scores show a strong linear correlation to the corresponding pore density values (coefficient of determination ≈ 1). Presumably, the finer meshes implied by higher pore densities further stratify the flow exchange (flow movement perpendicular to the mesh) between the parent vessel and the aneurysm, leading to delayed washout of blood and increased probability of intraaneurysmal thrombosis. The prognostic test based on the washout coefficient only predicts treatment success at the longest follow-up time in this study (6 months) because results were grouped according to aneurysm occlusion rates. The sensitivity and specificity of the current test are not high enough to guide clinical decisions and whether or not the test can be employed to predict treatment success of any given aneurysm by flow diversion will have to be evaluated by assessing it over larger clinical data sets. Largescale and comprehensive computational fluid dynamics programs assessing the influence of flow diverters in treating varied aneurysm geometries [28] can also significantly contribute to the development of such predictive tests. Such tests are intrinsically valuable in that the quantification (and the test) could be performed immediately after implantation of a flow diverter, thereby allowing the physician to consider prognostic strategies while the patient is still on the operating table.
Acknowledgments
Sources of Funding: The study was supported by a National Institutes of Health grant (NS045753-01A1) and Siemens Medical Solutions.
REFERENCES
- 1.Wakhloo AK, Schellhammer F, de Vries J, Haberstroh J, Schumacher M. Self-expanding and balloon-expandable stents in the treatment of carotid aneurysms: an experimental study in a canine model. AJNR Am. J. Neuroradiol. 1994;15:493–502. [PMC free article] [PubMed] [Google Scholar]
- 2.Geremia G, Haklin M, Brennecke L. Embolization of experimentally created aneurysms with intravascular stent devices. AJNR Am. J. Neuroradiol. 1994;15:1223–1231. [PMC free article] [PubMed] [Google Scholar]
- 3.Turjman F, Acevedo G, Moll T, Duquesnel J, Eloy R, Sindou M. Treatment of experimental carotid aneurysms by endoprosthesis implantation: preliminary report. Neurol. Res. 1993;15:181–184. doi: 10.1080/01616412.1993.11740132. [DOI] [PubMed] [Google Scholar]
- 4.Lieber BB, Stancampiano AP, Wakhloo AK. Alteration of hemodynamics in aneurysm models by stenting: influence of stent porosity. Ann. Biomed. Eng. 1997 May-Jun;25(no. 3):460–469. doi: 10.1007/BF02684187. [DOI] [PubMed] [Google Scholar]
- 5.Vanninen R, Manninen H, Ronkainen A. Broad-based intracranial aneurysms: thrombosis induced by stent placement. AJNR Am. J. Neuroradiol. 2003;24:263–266. [PMC free article] [PubMed] [Google Scholar]
- 6.Zenteno MA, Murillo-Bonilla LM, Guinto G, Gomez CR, Martinez SR, Higuera-Calleja J, Lee A, Gomez-Llata S. Sole stenting bypass for the treatment of vertebral artery aneurysms: technical case report. Neurosurgery. 2005 Jul;57(Suppl. 1):E208. doi: 10.1227/01.neu.0000163683.64511.24. [DOI] [PubMed] [Google Scholar]
- 7.Kallmes DF, Ding YH, Dai D, Kadirvel R, Lewis DA, Cloft HJ. A new endoluminal, flow-disrupting device for treatment of saccular aneurysms. Stroke. 2007 Aug;38(no. 8):2346–2352. doi: 10.1161/STROKEAHA.106.479576. [DOI] [PubMed] [Google Scholar]
- 8.Ionita CN, Paciorek AM, Hoffmann KR, Bednarek DR, Yamamoto J, Kolega J, Levy EI, Hopkins LN, Rudin S, Mocco J. Asymmetric vascular stent: Feasibility study of a new low-porosity patch-containing stent. Stroke. 2008 Jul;39(no. 7):2105–2113. doi: 10.1161/STROKEAHA.107.503862. [DOI] [PMC free article] [PubMed] [Google Scholar]
- 9.Ahlhelm F, Roth C, Kaufmann R, Schulte-Altedorneburg G, Romeike BF, Reith W. Treatment of wide-necked intracranial aneurysms with a novel self-expanding two-zonal endovascular stent device. Neuroradiology. 2007 Dec;49(no.12):1023–1028. doi: 10.1007/s00234-007-0281-6. [DOI] [PubMed] [Google Scholar]
- 10.Lieber BB, Sadasivan C, Gounis MJ, Seong J, Miskolczi L, Wakhloo AK. Functional angiography. Crit. Rev. Biomed. Eng. 2005;33(no. 1):1–102. doi: 10.1615/critrevbiomedeng.v33.i1.10. [DOI] [PubMed] [Google Scholar]
- 11.Sadasivan C, Lieber BB, Gounis MJ, Lopes DK, Hopkins LN. Angiographic quantification of contrast medium washout from cerebral aneurysms after stent placement. AJNR Am. J. Neuroradiol. 2002;23:1214–1221. [PMC free article] [PubMed] [Google Scholar]
- 12.Asakura F, Tenjin H, Sugawa N, Kimura S, Oki F. Evaluation of intra-aneurysmal blood flow by digital subtraction angiography: blood flow change after coil embolization. Surg. Neurol. 2003 Apr;59(no. 4):310–319. doi: 10.1016/s0090-3019(02)01045-5. [DOI] [PubMed] [Google Scholar]
- 13.Rudin S, Wang Z, Kyprianou I, Hoffmann KR, Wu Y, Meng H, Guterman LR, Nemes B, Bednarek DR, Dmochowski J, Hopkins LN. Measurement of flow modification in phantom aneurysm model: Comparison of coils and a longitudinally and axially asymmetric stent--Initial findings. Radiology. 2004 Apr;231(no. 1):272–276. doi: 10.1148/radiol.2311021741. [DOI] [PubMed] [Google Scholar]
- 14.Altes TA, Cloft HJ, Short JG, DeGast A, Do HM, Helm GA, Kallmes DF. Creation of saccular aneurysms in the rabbit: a model suitable for testing endovascular devices. AJR Am. J. Roentgenol. 2000;174:349–354. doi: 10.2214/ajr.174.2.1740349. [DOI] [PubMed] [Google Scholar]
- 15.Yu C, Liu Z, McKenna T, Reisner AT, Reifman J. A method for automatic identification of reliable heart rates calculated from ECG and PPG waveforms. J Am. Med. Inform. Assoc. 2006 May-Jun;13(no. 3):309–320. doi: 10.1197/jamia.M1925. [DOI] [PMC free article] [PubMed] [Google Scholar]
- 16.Bullitt E, Muller KE, Jung I, Lin W, Aylward S. Analyzing attributes of vessel populations. Med. Image Anal. 2005 Feb;9(no. 1):39–49. doi: 10.1016/j.media.2004.06.024. [DOI] [PMC free article] [PubMed] [Google Scholar]
- 17.Yimman S, Hinjit W, Sriboonsong S, Puangpool M, Dejhan K. IIR notch filter design with modified pole-zero placement algorithm. Proc. 3rd IEEE Int. Symp. Signal Processing and Information Technology. 2003:822–825. [Google Scholar]
- 18.Sadasivan C, Lieber BB, Cesar L, Miskolczi L, Seong J, Wakhloo AK. Angiographic assessment of the performance of flow divertors to treat cerebral aneurysms. Proc. 28th Annu. Int. Conf. IEEE Engineering in Medicine and Biology Society. 2006:3210–3213. doi: 10.1109/IEMBS.2006.260043. [DOI] [PubMed] [Google Scholar]
- 19.Lilliefors HW. On the Kolmogorov-Smirnov test for normality with mean and variance unknown. J. Am. Stat. Assoc. 1967 Jun;62(no. 318):399–402. [Google Scholar]
- 20.Bassingthwaighte JB, Ackerman FH, Wood EH. Applications of the lagged normal density curve as a model for arterial dilution curves. Circ. Res. 1966;18:398–415. doi: 10.1161/01.res.18.4.398. [DOI] [PMC free article] [PubMed] [Google Scholar]
- 21.Sadasivan C, Cesar L, Seong J, Rakian A, Hao Q, Tio FO, Wakhloo AK, Lieber BB. An original flow diversion device for the treatment of intracranial aneurysms: evaluation in the rabbit elastase-induced model. Stroke. doi: 10.1161/STROKEAHA.108.533760. to be published. [DOI] [PMC free article] [PubMed] [Google Scholar]
- 22.Wang Z, Ionita C, Rudin S, Hoffmann KR, Paxton AB, Bednarek DR. Angiographic analysis of blood flow modification in cerebral aneurysm models with a new asymmetric stent. Proc.of SPIE. 2004;5369:307–318. doi: 10.1117/12.535347. [DOI] [PMC free article] [PubMed] [Google Scholar]
- 23.Wang ZJ, Hoffmann KR, Wang Z, Rudin S, Guterman LR, Meng H. Contrast settling in cerebral aneurysm angiography. Phys. Med. Biol. 2005 Jul;50(no. 13):3171–3181. doi: 10.1088/0031-9155/50/13/014. [DOI] [PubMed] [Google Scholar]
- 24.Sadasivan C, Cesar L, Lieber BB. Mixing of angiographic contrast with blood during injections in the cerebral circulation. Proc. Summer Bioengineering Conference. 2008 [Google Scholar]
- 25.Perry RH, Green DW, Maloney JO. Perry's Chemical Engineers' Handbook. 7th ed. McGraw-Hill; New York, NY: 1997. p. 5.48. [Google Scholar]
- 26.Gyöngyösi M, Yang P, Khorsand A, Glogar D. Longitudinal straightening effect of stents is an additional predictor for major adverse cardiac events. J. Am. Coll. Cardiol. 2000 May;35(no. 6):1580–1589. doi: 10.1016/s0735-1097(00)00570-2. [DOI] [PubMed] [Google Scholar]
- 27.Hart WE, Goldbaum M, Cote B, Kube P, Nelson MR. Measurement and classification of retinal vascular tortuosity. Int. J. Med. Informatics. 1999 Feb-Mar;53(no. 2-3):239–252. doi: 10.1016/s1386-5056(98)00163-4. [DOI] [PubMed] [Google Scholar]
- 28.Radaelli AG, Augsburger L, Cebral JR, Ohta M, Rüfenacht DA, Balossino R, Benndorf G, Hose DR, Marzo A, Metcalfe R, Mortier P, Mut F, Reymond P, Socci L, Verhegghe B, Frangi AF. Reproducibility of haemodynamical simulations in a subject-specific stented aneurysm model--A report on the Virtual Intracranial Stenting Challenge 2007. J. Biomech. 2008 Jul;41(no. 10):2069–2081. doi: 10.1016/j.jbiomech.2008.04.035. [DOI] [PubMed] [Google Scholar]


