

Abstract
Williams Syndrome (WS) is a rare neurodevelopmental disorder, which stems from a genetic deletion on chromosome 7 that causes a profound weakness in visuospatial cognition. Our current study explores how orientation perception may contribute to the visuospatial deficits in WS. In Experiment 1, we found that WS individuals and normal 3-4 year olds had similar orientation discrimination thresholds and had similar prevalence of mirror-reversal errors for diagonal targets (±45 deg). In Experiment 2, we asked whether this immaturity in orientation discrimination would also be reflected in a task requiring integration of oriented elements. We found that sensitivities of WS individuals for detecting orientation-defined contours were higher than sensitivities of normal 3-4 year olds, and were not significantly different from sensitivities of normal adults. Together, these results suggest that orientation discrimination and orientation integration have different maturational trajectories in normal development and different susceptibilities to damage in WS, which may reflect largely separate visuospatial mechanisms.
Keywords: Williams Syndrome, development, perceptual organization, orientation perception, dorsal visual pathway, ventral visual pathway, grouping, contour integration
1. INTRODUCTION
Orientation perception is a fundamental property of the visual system, which may limit several aspects of visuospatial functions. In order to identify objects correctly, one must be able to detect and integrate orientation information. For example, the letters N and Z have similar configurations, but have orthogonal orientations. Failure to discriminate among horizontals, verticals, right obliques and left obliques would result in the perception of novel symbols or wrong letters. Moreover, combination of orientation information is necessary for formation of contours and objects. When local orientations are aligned (i.e. collinear), global contours (Field, Hayes & Hess, 1993) are more easily detected.
Although much is known about the mechanisms involved in detecting and discriminating oriented elements, little is known how information from individual oriented elements is integrated into contours, particularly in development. Understanding the characteristics of orientation processing in immature and abnormal systems may elucidate the developmental mechanisms underlying visuospatial processing and their role in higher-level functions such as spatial cognition and object recognition. Thus, we examined the relationship between orientation discrimination and integration of orientation information in typically developing children and in individuals with Williams Syndrome (WS), a genetic disorder resulting in severe visuospatial impairments (Bellugi, Lichtenberger, Mills, Galaburda & Korenberg, 1999).
1.1 Williams Syndrome
WS is a developmental disorder associated with a microdeletion of about 20 genes on chromosomal region 7q11.23 (Lenhoff, Wang, Greenberg & Bellugi, 1997). WS occurs in 1 out of 7,500 live births (Stromme, et al, 2002). It causes mild to moderate mental retardation (mean IQ of 60), but is typically associated with relative strength in language despite severe weakness in visuospatial tasks (Bellugi, et al., 1999).
1.1.1 Orientation discrimination
The study of orientation discrimination in people with WS is particularly relevant because one of the hallmarks of their spatial deficit is severely impaired representation of orientation, at least as measured so far. Using the Benton judgment of line orientation task (JLOT), early studies showed that many WS participants failed even the pretest, which requires two consecutive correct answers out of 5 relatively easy items (Wang, Doherty, Rourke & Bellugi, 1995). By contrast, these same early studies showed that WS performance in the Benton face recognition task is very close to normal adult performance (Bellugi et al., 1999, Wang et al., 1995), even though it requires recognition of the same face over different orientations. This suggests that representation of orientation in WS may be relatively normal for their chronological age under some circumstances (e.g. face recognition) and not others (e.g. line orientation discrimination).
Recent evidence suggests that floor performance of WS individuals in JLOT may be due to the complexity of the task. The Benton JLOT requires that a person discriminate the orientations of two different lines, and match them to their identity in a set of 11 choices. Although people with WS fail even the pretest of this task, simpler tasks of line orientation have shown that judgments in WS adults were comparable to those of typically developing children (Farran, 2006). In Farran’s study, thresholds were measured by adjusting the number of possible choices (2-10 lines instead of 11 in the standard JLOT) or percent correct was measured in a same-different task. The results showed that the precision of tilt discrimination (e.g. discriminating between lines tilted 0 and 2 deg) is similar in WS adults and normally developing children matched for mental age (who were on average 5-6 years old). This suggests that orientation tuning in people with WS is not completely absent, nor is it qualitatively different from a normal system (as suggested by Scerif & Karmiloff-Smith, 2005), but rather, that it functionally delayed or arrested at the level of a 5-6 year-old normally developing child. This is consistent with the fact that sensitivity to orientation differences is a foundational visual skill, which is present in young infants (e.g. Slater et al, 1988) and a range of species, including even lower vertebrate species such as the goldfish (Volkmann, et al., 1974).
The precision of tilt discrimination is one aspect of orientation representation. But another aspect that could be subject to abnormality in people with WS is the accuracy in the direction of tilt (i.e. discriminating lines tilted left or tilted right). WS individuals often make mirror-reversal errors in block construction (Hoffman et al. 2003), a task in which observers copy a global target model from individual blocks. When copying the global pattern, a WS participant must select individual blocks that are replicas of the ones used in the target model. They often make confusions such as selecting a diagonally split block whose split runs from upper left to lower right to stand in for one whose split runs from upper right to lower left. Young normally developing children also make such errors frequently in the block task. As a whole, these studies suggest that the WS pattern of selecting mirror image blocks in the block copy task might reflect developmental delay or arrest in this aspect of orientation representation.
1.1.2 Orientation integration
If people with WS and young normally developing children have difficulty representing orientation (and especially mirror-images), one might expect that these problems would show up in tasks requiring the integration of oriented elements, as well as simple discrimination tasks. Indeed, Kovacs et al. (2001) found that children with WS perform quite poorly in tasks requiring the integration of oriented elements (Kovacs, Lucas, Feher, Racsmany and Pleh, 2001). In their task, observers were asked to detect collinear contours embedded among randomly oriented noise elements, and thresholds were measured by changing the relative density between the contour and noise elements. Their WS participants could not at the same level as typical adults. The failure to use orientation for integration tasks such as this is consistent with the idea that people with WS have a deficit in global processing (e.g., Bellugi, et al, 1999). However, the general hypothesis of a global processing deficit has been challenged. For example, WS individuals perform much like normal adults in tasks that require using grouping cues to accelerate visual search (Pani, Mervis & Robinson, 1999), and segment textures (Farran & Wilmut, 2007), They also perceive visual illusions to the same extent as normal adults, suggesting that their perceptual integration of elements may be normal (Palomares, Ogbonna, Landau, & Egeth, in press).
In the current study, we examined orientation perception in WS from two different perspectives: discrimination of oriented elements, and integration of these elements into a global whole. Because people with WS appear to have some deficit in the perception and representation of oriented lines, but have strong mechanisms of visual-spatial integration (at least in some circumstances), it is possible that these two functions may be separable in this population. Moreover, because there are hints that the visual-spatial deficit in WS has remarkable parallels with the profile observed in young normally developing children around age 4 (Landau & Hoffman, 2007), it is possible that two separate profiles may be observed in normal children of this age. If separate profiles for orientation discrimination and integration of oriented elements are observed in both people with WS and young normally developing children, this would suggest two separate mechanisms with different developmental trajectories.
Therefore, In Experiment 1, we asked how people with WS and normally developing children aged 3-4, 5-6, and 7-9 years perceive and discrimination fine orientation differences (i.e. precision of tilt), and whether they make mirror-image reversal errors (i.e. direction of tilt). In Experiment 2, we asked how participants integrate oriented elements, specifically, how they detect an orientation-defined contour embedded among randomly oriented noise elements.
The locus of orientation processing is thought to take place principally in early visual cortex, such as V1 (e.g., Nauhaus, Benucci, Carandini & Ringach, 2008), an area shown to be disproportionately smaller in WS individuals relative to normal controls (Bellugi, et al., 1999; Chiang, et al, 2007). If orientation discrimination and orientation integration were largely limited by the same mechanisms in V1, then we would expect that they would have the similar vulnerabilities in atypical development and similar normal developmental trajectories. Alternatively, if different profiles emerge for the two tasks, then this would suggest the possibility that these different tasks engage different areas of the brain, which develop on different timetables and are differentially susceptible to neurological damage in Williams Syndrome.
Indeed, we found that orientation discrimination became adult-like after the age of 6 years in typically developing children, and was at the level of 3-4 year old children in our group of WS individuals, whose mean chronological age was 18 years. We also found that orientation integration became adult-like after the age of 4 years -- earlier than discrimination, and was at the level of typical adults in WS individuals. These results indicate that orientation discrimination and integration are likely mediated by largely separate mechanisms beyond early visual cortex. The immaturity of orientation discrimination in WS might be due to abnormalities in the dorsal visual pathway (see Section 4.1), cortical areas found to be vulnerable to damage in WS (e.g., Bellugi, et al, 1999; Meyer-Lindenberg, et al., 2004).
2. EXPERIMENT 1: DISCRIMINATION OF ORIENTED GRATINGS
Performances of WS individuals in the Benton line discrimination task (Bellugi et al., 1999, Wang et al., 1995) and block construction tasks (Hoffman, Landau & Pagani, 2003) indicate that WS individuals may have deficits in orientation selectivity. In Experiment 1, we measured orientation discrimination thresholds to gratings in WS individuals, normal children and adults. The Benton line discrimination task requires matching of two target lines from a set of 11 lines, and may require substantial attentional resources to select one line from a crowded display. The current task is much simpler, requiring only a match of one target grating to one of four gratings.
2.1 Methods
2.1.1 Participants
Fifty-nine people participated in this experiment. These included eleven WS individuals (mean age = 18 years; 7 months, minimum age = 11 years; 10 months, maximum age = 24 years; 5 months), twelve normally developing 3-4 year olds (mean age = 3 years; 11 months), twelve normally developing 5-6 year olds (mean age = 5 years 9 months), twelve normally developing 7-9 year olds (mean age = 8 years; 10 months) and twelve normal adults (mean age = 19 years, 1 month). One other WS individual was recruited to participate in this experiment. However, her data were not included in the analyses because of a response bias. In this case, she never chose gratings farthest from the target (i.e., the first and fourth gratings. See Fig. 2). A geneticist positively diagnosed all WS observers with a fluorescent in situ hybridization test for the WS genetic marker.
Figure 2.
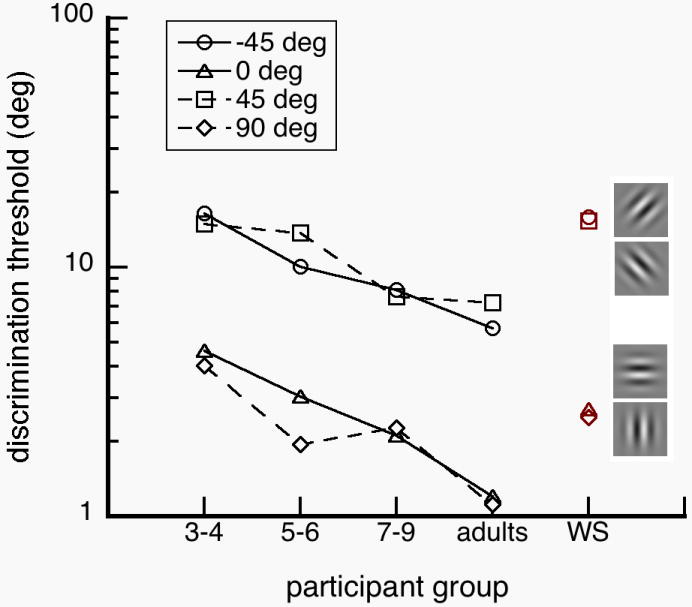
Threshold (geometric mean) as a function of participant group. Thresholds are higher at oblique targets across all participant groups. Thresholds of WS individuals and normal children were comparable, suggesting that orientation discrimination in WS is functionally immature.
All of our WS participants were given the Differential Abilities Scales (DAS) block construction subtest (Elliot, 1990) to measure their visuoconstruction abilities. WS individuals typically show poor performance in this task (Hoffman et al., 2003). Indeed, the mean of the DAS block construction scores for 11 WS observers was 107 (range of 92 to 126), which fell below the 7th percentile for chronological age. These scores correspond to those of normal 6-7 year olds at the 50th percentile. Ten of our WS observers were given the Kaufman Brief Intelligence Tests version 2 (KBIT2; Kaufman & Kaufman, 2004), an intelligence test that measures both vocabulary (verbal) and non-verbal analytical skills (matrices). The WS group had mean raw scores of 55 (range of 35 to77) for verbal and 23 for matrices (range of 15 to 32) components of the KBIT2. The KBIT2 verbal scores fell below the 18th percentile for chronological age, while the matrices scores fell below the 32nd percentile. These correspond to scores of normal 9-10 year olds (verbal) and 7-8 year olds (matrices) at the 50th percentile (Fig. 6). The mean full IQ of the WS group was 68 (range of 40 to 88), in the same range as other studies (Mervis, Robinson, Bertrand, Morris, Klein-Tasman & Armstrong, 2000)
Figure 6.

Data summary. Relative to chronological age and other measures of mental age, the WS equivalent age is lower for orientation discrimination. The WS equivalent age for orientation integration falls within the range of their chronological age. Rays indicate the chronological age for normal children at which performance was adult-like: Orientation discrimination matures later than orientation integration.
2.1.2 Stimuli, Design and Procedure
This experiment was carried out on an Apple iMac G3 computer attached to a 19” NEC monitor using MATLAB software with the VideoToolbox (Pelli, 1997) and Psychophysics Toolbox extensions (Brainard, 1997). One target grating and four choice gratings were presented inside gray boxes on a black background (Fig. 1). Gratings had 2 c/deg sinusoidal profiles with circularly symmetric Gaussian envelopes. The size of the gratings was 1 deg (1/e radius). Gratings had a Michelson contrast of 80%. The gray boxes were 2.5 × 2.5 deg in size, and had luminance set to the middle of the monitor range, about 18 cd/m2. The target grating was presented 2.5 deg above the center of the monitor. The choice gratings were horizontally aligned 3 deg apart presented 2.5 deg below the center of the monitor. Participants matched the target with one of the four choices by pointing. To ensure observer vigilance and fixation, the experimenter often reminded participants of the task (e.g. “Look at these stripes. [point to target] This is your target. Which one of these stripes is tilted like the target? [point to choices]”). The experimenter moved the mouse and clicked on the observer’s answer. On 25% of randomly chosen correct trials, the computer played a verbal recording of “Good job,” or “Excellent” as feedback. No feedback was given on incorrect trials.
Figure 1.
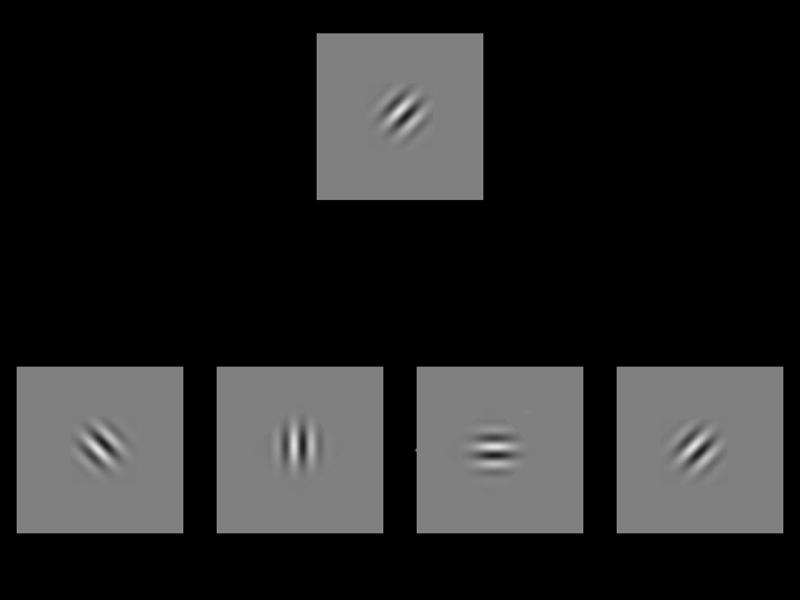
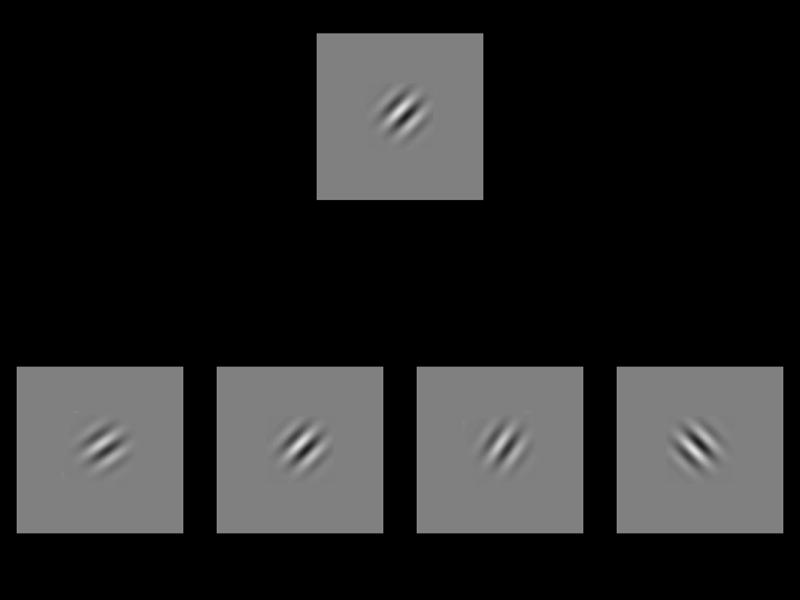
Stimuli for a +45 deg target in the orientation discrimination experiment. a) Example of an easy trial. From left to right, the choice orientations were −45, 0, 90 and +45 deg. Two of the choices were ±45 deg from the target angle. b) Example of a hard trial. From left to right, the choice orientations were +60, +45, +30 and −45 deg. Two of the choices were ±15 deg from the target angle.
Participants sat 40 cm away from the screen. The stimuli remained on the screen until response, and observers were allowed to freely make eye movements. Orientation discrimination thresholds were measured with an adaptive staircase method, in which the average accuracy of the task was kept constant while the difficulty of the individual trials changes to converge to a threshold. A subsequent trial increases in difficulty as the participant makes more correct choices, and decreases with incorrect choices. The difficulty of the trial was determined by the angle similarity of the distractor gratings to the target grating. This procedure isolates the orientation of the distractor gratings at which observers make mistakes, which is an estimate of orientation threshold. Higher orientation thresholds correspond to poorer ability to discriminate orientation. With our staircase procedure, the orientation discrimination threshold is the angle difference between the distractor and target gratings that would obtain 68% correct.
There were four blocked adaptive staircases corresponding to four different target orientations (-45, 0, 45, 90 deg). The number of trials for each staircase was fixed to be 20 for WS individuals and 3-4 year old children, 25 for 5-6 and 7-9 year old children, and either 35 or 45 for normal adults1. There were five practice trials before the experimental trials.
The four choice gratings consisted of a target grating, an orthogonally oriented grating (i.e., 90 deg from the target grating), and two distractor gratings tilted left and right by an angle relative to the target (Fig. 1). The positions of the correct match, orthogonal grating and distractor gratings were randomly selected on every trial. On the first trial of each staircase, the tilts of the distractor gratings were ±60 deg relative to the angle of the target grating. After a correct trial, the subsequent trial was made more difficult by reducing the distractor angle (i.e. orientation difference between the target and distractor gratings) by 50%. If a distractor grating was chosen, the subsequent trial was made easier by increasing the distractor angle by 20 deg2. If the orthogonal grating was chosen, the angle of the distractor gratings would be unchanged.
Figure 1a shows an example of a trial with a +45 deg target with a match grating (fourth grating from the left), orthogonal grating (first grating from left) and distractor gratings with angles of 0 deg and +90 deg (second and third choice gratings from the left). The angles of the distractor gratings correspond to ±45 deg relative to the angle of the target. If the observer chose the correct answer, the subsequent trial would have distractor gratings oriented +22.5 deg and +67.5 deg, which are ±22.5 from the target angle. If the observer chose an incorrect answer by selecting a distractor grating instead, the subsequent trial would have distractor gratings oriented −20 deg and +110 deg, which are 65 from the target angle. If the observer chose an incorrect answer by choosing the orthogonal grating, the distractor angles would not change on the subsequent trial.
Figure 1b shows an example of a more difficult trial. Here, the distractor gratings (first and third grating from the left) had angles ±15 deg from +45 deg, the target angle. For this trial, the match grating is in the second position, while the orthogonal grating is in the fourth.
We measured orientation discrimination thresholds to determine our observers’ precision in judging orientation. Generally, the orientation difference between the target and distractor gratings progressively decreases until the observer makes an error from choosing a distractor grating, after which the orientation difference increases. This is a staircase reversal. The orientation threshold was the average of the last three orientation differences at which observers made errors that resulted in a staircase reversal.
The errors from choosing an orthogonal grating were not included in the threshold calculation. However, we noted the proportion of errors in which the orthogonal grating was chosen, [p (chose orthogonal) | p (error)].
2.2 Results and Discussion
2.2.1 Thresholds (Precision of Tilt)
Our results suggest that WS individuals and normal children were less precise than normal adults in judging orientation. For example, WS individuals and typically developing 3-4 year old children may confuse a distractor that is tilted 30 deg or 60 deg for a 45 deg target, while a typical adult would choose distractors with more similar angles of 39 deg or 51 deg. However, target orientation affected WS individuals, normal children and normal adults similarly in their ability to discriminate orientation (Fig. 3). We performed a 5 (participant group) × 4 (target orientation) ANOVA on log thresholds. We found significant main effects of participant group, F(4, 54)=12.230; p<0.001 and target orientation, F(3, 162)=131.105; p<0.001, but no significant interaction between them, F(12, 162)=1.037; p=0.418. Tukey post hoc analyses show that WS individuals and normal children have higher orientation thresholds than normal adults: At 0 deg target orientation, WS individuals (p=0.046), normal 3-4 year olds (p=0.048) and 5-6 year olds (p=0.012) had significantly higher thresholds than normal adults. Normal 3-4 year olds also had higher thresholds than normal 7-9 year olds. At 45 deg, WS individuals (p=0.021) and normal 3-4 year olds (p=0.025) had higher thresholds than normal adults as well as higher thresholds than normal 7-9 year olds (WS, p=0.037 and normal 3-4 year olds, p=0.044). At 90 deg, normal 3-4 year olds had higher thresholds than normal adults (p=0.002). At -45 deg, WS individuals (p<0.001) and normal 3-4 year olds (p<0.001) had higher thresholds than normal adults. These results show that WS individuals and children under the age of 6 had similar imprecisions in judging orientation.
Figure 3.
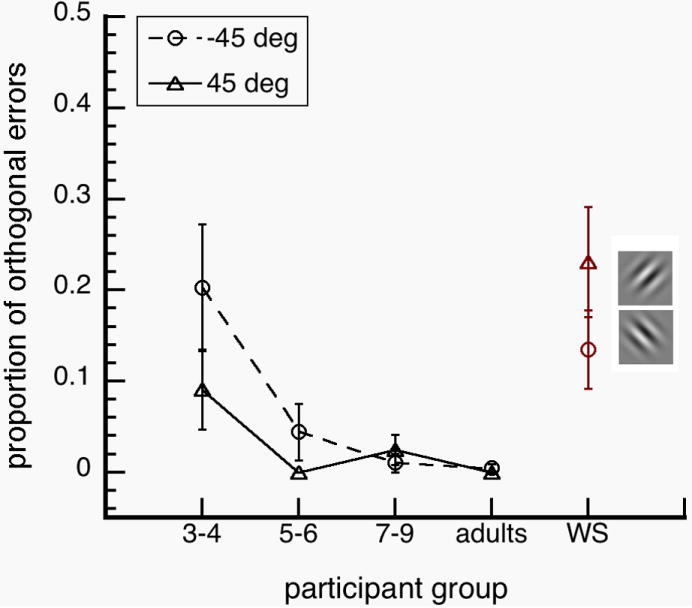
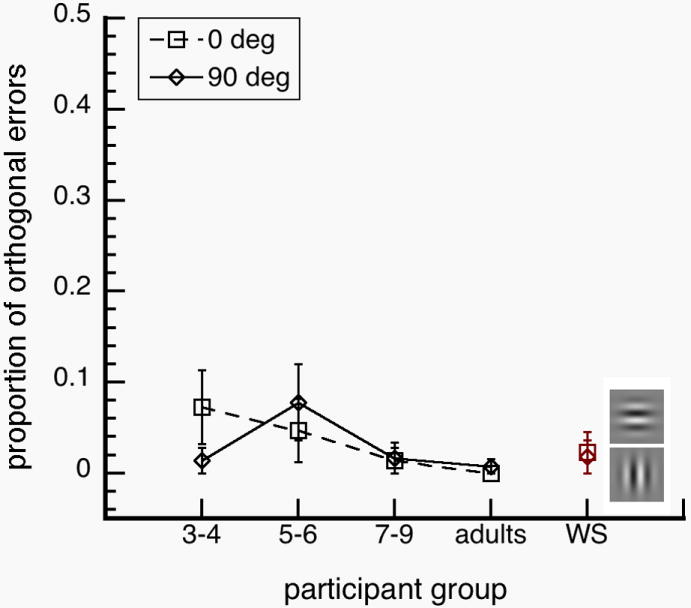
Proportion of orthogonal errors as a function of participant group. Orthogonal errors, [p (chose orthogonal) | p (error)], were significantly higher for WS individuals and normal 3-4 year olds for (a) oblique targets (left), but not for (b) non-oblique targets. Error bars represent ±1 SEM.
We tested for the oblique effect in orientation perception, which is a well-known anisotropy in visual perception that results in higher contrast sensitivity and orientation acuity for non-diagonal stimuli (i.e. horizontals and verticals) than for diagonal stimuli (e.g., ±45 deg; Appelle, 1972). We compared thresholds for discriminating diagonal and non-diagonal gratings by averaging thresholds at 45 and -45 deg (diagonal) together and thresholds at 0 and 90 deg (non-diagonal) together. Across all participants, thresholds for discriminating diagonal gratings were higher than discriminating non-diagonal gratings, t(59)=15.590; p<0.001. Dividing the thresholds for diagonal gratings by the thresholds for non-diagonal gratings gives us a ratio that indexes the oblique effect. The geometric means of the oblique effect ranged from 3 to 6. However, we found that all participant groups were subject to the oblique effect to the same degree, F(4,54)=1.092; p=0.370, that is, there was no effect of group. We also found that thresholds comparing 0 deg versus 90 deg, F(4, 54)=0.618; p=0.654, or 45 deg versus -45 deg, F(4,54)=1.450; p=0.230, were not significantly different among groups.
In order to see whether WS orientation discrimination abilities were associated with standard measures of verbal and non-verbal abilities, we also carried out all possible correlations between WS orientation thresholds and DAS block construction raw scores, KBIT2 (verbal and matrices) raw scores as well as chronological age. Raw orientation discrimination thresholds did not correlate with DAS block construction scores (p-values>0.05). Orientation thresholds did not correlate with KBIT2 verbal (p-values>0.15) and matrices (p-values>0.05) raw scores. None of the correlations with chronological age was significant (p-values>0.15). These data suggest that mental or chronological age do not account for the variance found in our orientation thresholds. However, these non-significant correlations must be taken with caution since we only have small sample of WS individuals.
We also found that our orientation thresholds within all participants correlated with each other (n=59): Thresholds at 0 deg correlated with thresholds at 45 deg (r=+0.367; p=0.004), 90 deg (r=+0.507; p<0.001) and −45 deg (r=+0.286; p=0.028). Thresholds at 45 deg correlated with thresholds at 90 deg (r=+0.241; p=0.066) and -45 deg (r=+0.675; p<0.001). Thresholds at 90 deg correlated with thresholds at -45 deg (r=+0.293; 0.024). These results suggest that participants who had high orientation thresholds at one target orientation tended to have high thresholds at all other target orientations.
2.2.2 Orthogonal Errors (Direction of Tilt)
We analyzed the proportion of errors, [p (chose orthogonal) | p (error)], in which participants chose the grating orthogonal to the target (i.e. 90 deg angle difference). The frequency of participants who made orthogonal errors in any of the target orientations were: 10 out of 11 WS individuals, 1 out of 12 normal adults, 4 out of 12 normal 8-9 year olds, 5 out of 12 normal 5-6 year olds and 7 out of 12 normal 3-4 year olds. A 5 (participant group) × 4 (target orientation) ANOVA on proportion of orthogonal errors showed main effects of participant group, F(4, 54)=4.945; p=0.002, and target orientation, F(3, 162)=4.616; p=0.004, and an interaction between participant group and orientation, F(12, 162)=4.543; p<0.001.
Tukey post hoc analyses showed WS individuals and normal 3-4 year olds had similar occurrences of orthogonal errors in judging orientation. There were no significant differences across groups at 0 and 90 deg target orientation (p-values>0.20). At 45 deg, the instances of orthogonal errors were higher in WS individuals than in normal 3-4 year olds (p=0.036), 5-6 year olds (p<0.001), 7-9 year olds (p=0.001) and normal adults (p<0.001). At -45 deg, the instances of orthogonal errors were higher in normal 3-4 year olds than in normal 5-6 year olds (p=0.046), 7-9 year olds (p<0.009) and normal adults (p=0.006). We performed t-tests on orthogonal errors at 45 and -45 deg. The instances of orthogonal errors between 45 and -45 deg were not significantly different in WS individuals, t(10)=1.318; p=0.217, but were significantly different in 3-4 year olds, t(11)=2.280; p=0.044. It is unclear why normal 3-4 year olds have different results at 45 and -45 deg, which may be noise in the data. In any case, these results suggest that WS individuals, like normal 3-4 year olds, have difficulties distinguishing between left-right mirror images (Fig. 3).
In Experiment 1, we investigated how WS individuals, normal children and adults discriminate orientation of a single grating. WS individuals and children under the age of 6 years had higher orientation discrimination thresholds than normal adults (Fig. 2). WS individuals and normal 3-4 year olds had higher proportions of mirror-image reversal errors than normal adults (Fig. 3). We also found that orientation discrimination thresholds were not adult-like until after the 6 years of age. Together, our results show that WS orientation perception is functionally delayed or arrested at the level of normal 3-4 year olds. In the next experiment, we investigated how our observers integrated orientation information from multiple gratings.
3. EXPERIMENT 2: DETECTION OF ORIENTATION-DEFINED CONTOUR
Visual context affects how we perceive characteristics of a target element. For example, the presence of collinear elements improves grating visibility in human observers (Polat & Sagi, 1993) and orientation tuning of cat V1 cells (Gilbert et al., 1996). In Experiment 1, we found that WS individuals were functionally immature in judging orientation. In Experiment 2, we examined whether they would have a similar immaturity in detecting a contour based on collinear orientation. We would expect that orientation discrimination and orientation integration would have similar functional immaturity in WS if they were largely limited by the same mechanisms.
3.1 Methods
3.1.1 Participants
Fifty-six people participated in this experiment. These included ten WS individuals (mean age = 18 years; 4 months, minimum age = 11 years; 10 months, maximum age = 24 years; 5 months), ten normally developing 3-4 year olds (mean age = 4 years; 0 months), twelve normally developing 5-6 year olds (mean age = 5 years 9 months), twelve normally developing 7-9 year olds (mean age = 8 years; 11 months) and twelve normal adults (mean age = 19 years, 9 months). Of these observers, 28 participated in Experiment 1. These included all ten WS individuals, three normal 3-4 year olds, nine normal 5-6 year olds and six normal 7-9 year olds. A new group of normal adults participated in this experiment.
3.1.2 Stimuli, Design and Procedure
This experiment utilized the same software and computer setup as Experiment 1. The stimuli were two fields of gratings (sample fields are shown in Fig. 5), one field left and the other right of the center of the monitor. One field contained a target contour made up of “collinear” gratings among randomly oriented distractor gratings, while the other field contained only randomly oriented distractor gratings. The fields of gratings were created in an 8 × 8 grid. Randomly oriented distractor gratings were placed in each cell with a random positional jitter (within ±10 pixels). The target contour had either a vertical or a horizontal global axis, which was created by six gratings without positional jitter (Fig. 4a-b). The detectability of the target contours was modulated by changing the orientation deviation, which is the orientation of the target gratings relative to the global axis of the contour. The orientation deviation alternated between the target gratings (i.e., tilted right-left-right-left-right-left). The maximum orientation deviation was 45 deg (Fig 4b). As the orientation deviation becomes larger, the visibility of the contour is reduced. Each grating had a sinusoidal profile with a spatial frequency of 2 c/deg and a Gaussian envelope size of 0.50 deg. The separations between gratings (i.e. size of the cells) were 1.0 or 2.5 deg.
Figure 5.
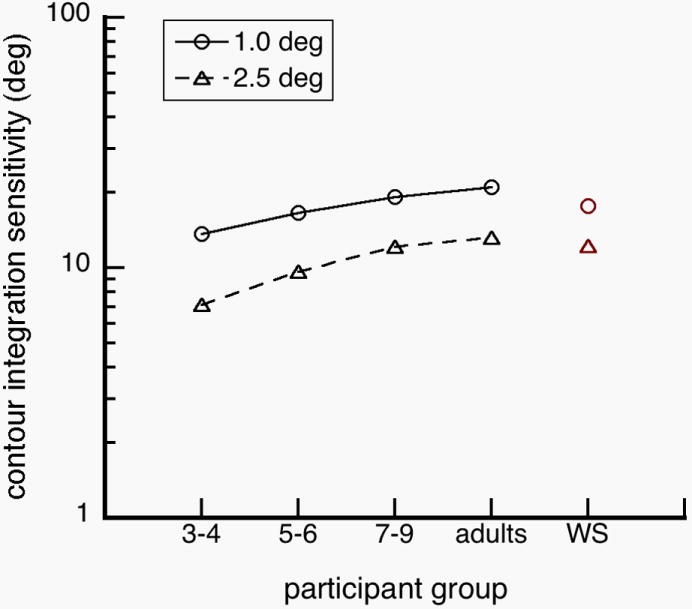
Contour detection sensitivity as a function of participant group. Sensitivity of WS is like those of normal 7-9 year olds and normal adults, suggesting that orientation integration in WS is functionally mature.
Figure 4.

Sample of contour integration stimuli. Participants detected a contour made up of “collinear” gratings in a field of randomly oriented gratings. (a) horizontal contour with 0 deg orientation deviation. (b) horizontal contour with 45 deg orientation deviation. (c) field of noise gratings with no contour. Shape and position of the target contour and the position of noise gratings are the same in panels a and b.
Observers were instructed to detect a contour embedded among random gratings as accurately and as quickly as possible3. Specifically, we asked observers to find a “snake in the grass”, which could sometimes be straight (Fig. 4a) or squiggly (Fig. 4b). By adding more orientation deviation, a contour becomes squigglier and thus harder to detect. Our procedure isolates the orientation deviation of the element gratings at which observers make mistakes, which is an estimate of contour integration sensitivity. Lower contour integration sensitivity corresponds to poorer ability to detect a contour. Observers pointed to which side of the screen, left or right, had a target contour “snake”. (See Fig 4b-c for an example of what a hard trial might look like.) The experimenter noted the observers’ choice by typing “1” for left and “2” for right using the number pad on the keyboard. The stimuli remained on the screen until response, and observers were allowed to freely make eye movements. On 25% of randomly chosen correct trials, the computer played a verbal recording of “Good job,” or “Excellent” as feedback. No feedback was given on incorrect trials. To ensure that the observers understood the task, five practice trials were presented before the experimental trials. There were two experimental blocks, one for each inter-element separation.
Contour detection sensitivity4 was measured using an adaptive staircase method as in Experiment 1, in which the local orientation deviation progressively increases until the observer makes an error, after which the deviation decreases. The difficulty of the trials was adjusted so that the average accuracy was 75% correct. For each experimental block, the initial local orientation deviation (at Trial 1) was 0 deg from the global contour axis (Fig 5a). After a correct trial, the subsequent trial was made more difficult by increasing the orientation deviation by 2.5 deg. After an incorrect trial, the subsequent trial was made easier by decreasing the deviation by 50%. For example if an observer chose the correct answer in a trial with a 5 deg orientation deviation, the subsequent trial would have a deviation of 7.5 deg. Alternatively, an incorrect trial would result in deviation of 2.5 deg in the subsequent trial. The detection sensitivity was the average of the last three orientation deviations at which observers made errors. The number of trials was 25 for WS individuals and normal children, and 455 for normal adults. Observers sat 40 cm away from the monitor.
3.2 Results and Discussion
Our results show that orientation sensitivity increases with maturation, and decreases with inter-element separation (Fig. 5). That is, adults were able to detect contours with more squiggle than 3-4 year old children. Moreover, contours with more squiggle were more detectable when individual elements were closer together.
Notably, our data show that sensitivities to global information were not significantly different between WS individuals and normal adults, in contrast with the idea that configural processing in WS is impaired (Bihrle, Bellugi, Delis & Marks, 1989, Deruelle, Mancini, Livet, Casse-Perrot & de Schonen, 1999). These results are distinctly different from the results of Experiment 1, in which orientation discrimination in WS mostly resembled orientation discrimination in normal 3-4 year olds. The results from Experiment 2 showed that contour detection sensitivities of WS were more similar to sensitivities of normal 7-9 year olds and adults, and were significantly higher than sensitivities of normal 3-4 year olds. We performed a 5 (participant group) × 2 (inter-element separation) ANOVA on log sensitivities (Fig. 5). We found a significant main effects of participant group, F(4, 51)=6.332; p<0.001 and inter-element distance, F(1, 51)=65.609; p<0.001, but no significant interaction between them, F(4, 51)=0.346; p=0.846. Tukey post-hoc analyses were conducted. We found that sensitivities of 3-4 year old children were significantly different than the sensitivities of the other participants (p-values<0.01). Comparisons among other participant groups were non-significant (p-values>0.10).
To determine if contour detection is associated with scores on standardized tests, we also performed independent pair-wise correlations between log contour detection sensitivities and DAS block construction scores, KBIT2 scores and chronological age. Notably, DAS block construction scores did not correlate with contour detection thresholds at either inter-element separations (p-values>0.30), suggesting that the type of integration over collinear elements is not associated with cognitive requirements in block construction tasks. KBIT2 verbal scores or chronological age did not correlate with contour detection sensitivities at either inter-element separation (p-values>0.15), suggesting that verbal abilities and physical age do not contribute to integration of collinear elements. However, KBIT2 matrices scores correlated significantly with contour detection sensitivities at 2.5 deg inter-element separation (n=10; r=+0.668; p=0.035), but not at 1.0 deg separation (n=10; r=+0.118; p=0.745). This suggests that orientation integration of distant elements might be related to non-verbal abilities. Moreover, contour detection sensitivities at 1.0 deg separation correlated with contour detection sensitivities at 2.5 deg separation (n=56, r=+0.425; p<0.001), suggesting that participants who had high sensitivities at one inter-element separation tended to have high sensitivities at the other inter-element separation.
Since a subset of the participants from Experiment 1 also participated in Experiment 2 (n=28), we also performed correlations between log contour detection sensitivities and log orientation discrimination thresholds from Experiment 1. We found that contour detection sensitivities at both inter-element separations did not correlate with orientation discrimination thresholds obtained in Experiment 1 at any target orientation (p-values>0.05), suggesting that the limiting mechanisms underlying these two tasks might be independent.
4. GENERAL DISCUSSION
WS individuals have been reported to have severely weak representation of orientation information (Bellugi et al., 1999; Farran, 2006; Wang et al., 1995). To test the extent of this weakness, we investigated how WS individuals, normal children and normal adults discriminated the orientation of a single grating and how they integrated orientation information across multiple gratings. We found that WS individuals and normal 3-4 year olds had similar orientation discrimination thresholds (Fig 2). We also found that WS individuals and normal 3-4 year olds had mirror-reversal errors for diagonal targets (±45 deg), which did not occur in normal adults (Fig 3). However, we found that WS individuals had higher contour detection sensitivities than normal 3-4 year olds, and the WS sensitivities were not significantly different from sensitivities of normal adults (Fig 5). Together, these results suggest that orientation discrimination in WS is impaired due to delayed or arrested functions at the level of normal 3-4 year olds, while integration of neighboring orientation information is functionally mature at the level of normal adults (Fig. 6).
We also found that orientation discrimination and orientation integration have different developmental trajectories. Whereas orientation discrimination thresholds were adult-like after the age of 6 years (Fig. 2), contour integration of oriented elements was adult-like after the age of 4 years (Fig. 5). These results suggest that orientation discrimination and orientation integration have different developmental characteristics, and might be limited by largely independent processes.
The developmental difference between orientation discrimination and integration further suggests that orientation perception engages mechanisms beyond those in V1. The different developmental characteristics of orientation discrimination and orientation integration for nearby elements may stem from separate feedback mechanisms from higher cortical areas in the dorsal and ventral steams, respectively. Neuroimaging (Kitada, Kito, Saito, Kochiyama, Matsumura, Sadato & Lederman, 2006) and electrophysiological data (Song, Peng, Lu, Liu, Li, Liu, Qu & Ding, 2007) from normal adults suggests that parietal areas may be involved in orientation discrimination in addition to occipital areas. In contrast, contour integration is mediated by activity within long-range horizontal connections in V1 (Chisum & Fitzpatrick, 2004) that cascades to ventral visual areas such as the LOC (Altmann et al., 2003, Murray, Kersten, Olshausen, Schrater & Woods, 2002) via feedforward and feedback mechanisms (Grossberg, Mingolla & Ross, 1997).
4.1 The Dorsal Stream Vulnerability Hypothesis
One possibility that could explain the difference between orientation discrimination and integration of oriented elements in WS is the Dorsal Stream Vulnerability Hypothesis (e.g., Atkinson, et al, 1997; 2003), which proposes that the visuospatial weaknesses found in WS are related to dorsal stream functions. Dorsal visual areas mediate a broad range of tasks such as spatial localization, motion processing, attentional selectivity (e.g., Ungerleider & Haxby, 1994), and visuomotor coordination (Goodale & Milner, 1992; Dilks, Hoffman & Landau, 2008). WS individuals show deficits in many of these functions, such as detection of form from motion (Braddick, Atkinson & Wattam-Bell, 2003; Reiss, Hoffman & Landau, 2005). Furthermore, WS individuals have been shown to have abnormalities in parietal areas, which have been found to be undersized (Bellugi et al., 1999), have lower volume of grey matter (Thompson, Lee, Dutton, Geaga, Hayashi, Eckert, Bellugi, Galaburda, Korenberg, Mills, Toga & Reiss, 2005; Boddaert, et al., 2006), and show lower fMRI activation than typical controls for spatial integration tasks (Meyer-Lindenberg, Kohn, Mervis, Kippenhan, Olsen, Morris & Berman, 2004; Mobbs, et al., 2007). Conversely, WS anomalies in ventral visual areas primarily have not been found (Sarpal, et al., 2008).
4.2 Abnormal versus immature orientation discrimination
Contrary to the suggestions of earlier studies (Bellugi, et al., 1999), orientation discrimination is not qualitatively different among WS individuals, relative to normally developing individuals. Rather, it is functionally delayed or arrested at the level of 3-4 year old normally developing children. Although WS people have poorer ability to discriminate orientation than normal adults, their orientation discrimination abilities are well-above floor values and exhibit a pattern observed in normally developing children who are 3-4 years old: This pattern includes the oblique effect and mirror-image reversals.
4.2.1 Orientation Precision and the Oblique Effect
The ability to discriminate orientation is present at birth (Slater, Morison & Somers, 1988), but orientation selectivity is coarse initially and becomes more precise after 3 months of age, reaching mature levels by 5-6 years old (Lewis, Kingdon, Ellemberg & Maurer, 2007). Since orientation discrimination may also involve parietal areas (Song, et al, 2007; Kitada, et al., 2007), the broader orientation tuning in young children may be caused by immaturity in these areas, which mature later than sensory areas such as V1 (Gogtay, et al., 2004). Moreover, the orientation imprecision in WS individuals may be due to abnormalities in parietal areas (Meyer-Lindenberg, et al, 2004).
However, the presence of the oblique effect in WS individuals suggests that orientation mechanisms in V1 are functionally normal. The oblique effect (Appelle, 1972) is present early in typically developing children (Fig. 3; Gwiazda, Scheiman & Held, 1984) and remains in adults (Timney & Muir, 1976). FMRI BOLD responses in V1 (Furmanski & Engel, 2000) and VEPs in occipital areas (Maffei & Campbell, 1970) were also greater for gratings with horizontal and vertical orientations than for gratings with a diagonal orientation. Evidence from single-cell recordings suggests that this oblique effect may arise from the relatively larger number of neurons that represent cardinal axes (i.e. vertical and horizontal) than neurons that represent diagonals (Celebrini, Thorpe, Trotter & Imbert, 1993; Kennedy & Orban, 1979; Mansfield, 1974).
4.2.2 Mirror-image reversals
We found that young children and WS people are more likely to make mirror-image reversal errors than normal adults (Fig. 3). These kinds of orientation errors are found in 2 month olds (Essock & Siqueland, 1981), and represent children’s poor ability in discriminating between mirror-images (Aaron & Malatesha, 1974). However, difficulty in distinguishing mirror images seem to be present even in adults as reaction times are slower in normal adults for discrimination of mirror images than non-mirror images (Corballis & MacLaren, 1984). This means that the visual systems of normal children and adults struggle to differentiate mirror-images, as do the visual system of WS people.
McCloskey, Valtonen & Sherman (2006) described three individuals with developmental deficits that are specific to orientation representation. In these cases, all had normal IQ and two (A.H. and T.M.) had no evident neurological damage as measured by several neuroimaging techniques. In these individuals, mirror-image reversal errors often occurred across the vertical axis (e.g. -45 deg versus +45 deg), and across the main axis of the object (e.g. a diagonally oriented toothbrush facing up versus facing down). This pattern of errors is consistent with errors found in WS individuals and in normal children (Fig. 3), suggesting that these orientation perception deficits may stem from developmental delay or arrest of normal visual functions. These findings are also consistent with the proposal that orientation representation exists in a coordinate system, in which precision of tilt is calculated separately from the direction of tilt (McCloskey et al., 2006). Perceptual errors in the direction of tilt may occur when observers switch among different coordinate frames (e.g. retinocentric to allocentric frames).
4.3 Effect of distance on contour integration
Detection of collinear gratings is a task used to explore how observers integrate orientation information across space. The collinearity and proximity of oriented elements modulate the strength of contour perception observed in psychophysical behavior (Field et al., 1993). We found that contour integration is functionally adult-like in children over the age of 4 years and adult-like in WS people (Fig. 5). Contrary to our findings, Kovacs and colleagues reported that contour integration matures relatively late into adolescence (Kovacs, 2000), and is impaired in WS people (Kovacs, et al., 2001).
However, the difference between our study and that of Kovacs is likely caused by the choice of dependent measures. In our task, we varied orientation collinearity of the grating elements, whereas in Kovacs’ task, the relative separation between the contour and noise gratings was varied. In Experiment 2, additional planned comparisons found that sensitivities of 3-4 year old children were significantly different from those of adults at the farther inter-element separation, but not reliably different at the nearer separation. These results support the main findings of Palomares et al. (2008), that collinear grouping at different inter-element separations may yield different maturational functions. In that study, visuospatial integration over distant elements has not reached mature levels by 7-9 year olds, while integration over near elements is adult-like by 3-4 years old. Although the data from Kovacs seem to contradict ours, there may be a simple explanation -- that the development of visual integration is highly dependent on inter-element distance. We propose that integration of far elements might have a more protracted development in typical children and have more sensitivity to damage in WS than integration of nearby elements (Palomares, et al., 2008). More generally, different types of grouping cues (i.e., proximity, collinearity, closure, similarity) might result in different developmental trajectories. Farran (2005) has previously shown that perceptual grouping in WS is dependent on grouping cues, and it may be a similar case in normal development.
5. CONCLUSIONS
We evaluated how orientation discrimination and integration might be related in normal and abnormal development. On the one hand, we found that orientation discrimination reached normal maturity around the age of 7-9 years, and is functionally delayed in WS. On the other hand, we found that orientation integration is adult-like in children around the age of 5-6 years and in WS people. These results show that orientation discrimination and orientation integration have different developmental profiles, suggesting that largely independent processes might limit them.
Acknowledgments
We thank the Williams Syndrome Association, our participants and their families, Abha Gupta, Gitana Chunyo and Whitney Street for help in recruiting and running participants. An NIH fellowship (F31-NS047979) to MP, NSF (0117744), March of Dimes (04-4601-87), and NIH (RO1-NS050876) grants to BL funded this research.
Footnotes
The number of trials was chosen based on an a priori assumption that WS individuals and normal children were worse than normal adults on this task, which would necessitate more trials for normal adults. That is, WS individuals and normal children would reach threshold quicker, with fewer trials than normal adults. Due to experimenter error, different numbers of trials were used in the normal adult group: 8 normal adults had 35 trials and 4 normal adults had 45 trials. Thresholds were not affected by this difference in trial number, as thresholds can be determined within 20 trials.
The staircase scheme, a proportional decrement of 50% for a correct answer and a constant increment of 20 deg for an incorrect answer, was chosen to minimize the number of trials for reliable threshold in children and WS individuals. Though atypical for a staircase procedure, the obtained thresholds for typical children and adults were comparable to those of previous studies (e.g. Lewis, et al., 2007).
Although neither reaction time nor percent correct was our dependent variable, we instructed our observers to be as quick and as accurate as possible. This instruction prevented our observers (particularly, typical adults) to serially scan the stimulus array to logically find 6 elements that alternated left and right, and encouraged detection based on the “Gestalt” of the contour.
To be faithful to psychophysical terminology, we called the dependent variable contour detection sensitivity instead of threshold because higher orientation deviations from the main target contour axes corresponded to better performance. In contradistinction, lower threshold values usually correspond to better performance. In general, sensitivity has a reciprocal relationship to threshold (sensitivity≈1/threshold).
As in Experiment 1, the number of trials was chosen based on an a priori assumption that normal adults are much better than WS individuals and normal children on this task (i.e., WS individuals and normal children would reach threshold with less trials than normal adults). However, our results show that WS individuals and normal adults have similar contour detection sensitivities. Reliable sensitivities for normal adults could have been calculated with fewer trials (about 30 trials).
Data from this manuscript were presented at the 2007 Vision Sciences Society Conference in Sarasota, FL.
Publisher's Disclaimer: This is a PDF file of an unedited manuscript that has been accepted for publication. As a service to our customers we are providing this early version of the manuscript. The manuscript will undergo copyediting, typesetting, and review of the resulting proof before it is published in its final citable form. Please note that during the production process errors may be discovered which could affect the content, and all legal disclaimers that apply to the journal pertain.
References
- Aaron PG, Malatesha RN. Discrimination of mirror image stimuli in children. Neuropsychologia. 1974;12(4):549–551. doi: 10.1016/0028-3932(74)90086-4. [DOI] [PubMed] [Google Scholar]
- Altmann CF, Bulthoff HH, Kourtzi Z. Perceptual organization of local elements into global shapes in the human visual cortex. Curr Biol. 2003;13(4):342–349. doi: 10.1016/s0960-9822(03)00052-6. [DOI] [PubMed] [Google Scholar]
- Appelle S. Perception and discrimination as a function of stimulus orientation: the “oblique effect” in man and animals. Psychol Bull. 1972;78(4):266–278. doi: 10.1037/h0033117. [DOI] [PubMed] [Google Scholar]
- Atkinson J, Braddick O, Anker S, Curran W, Andrew R, Wattam-Bell J, Braddick F. Neurobiological models of visuospatial cognition in children with Williams syndrome: measures of dorsal-stream and frontal function. Dev Neuropsychol. 2003;23(12):139–172. doi: 10.1080/87565641.2003.9651890. [DOI] [PubMed] [Google Scholar]
- Bellugi U, Lichtenberger L, Mills D, Galaburda A, Korenberg JR. Bridging cognition, the brain and molecular genetics: evidence from Williams syndrome. Trends Neurosci. 1999;22(5):197–207. doi: 10.1016/s0166-2236(99)01397-1. [DOI] [PubMed] [Google Scholar]
- Bihrle AM, Bellugi U, Delis D, Marks S. Seeing either the forest or the trees: dissociation in visuospatial processing. Brain Cogn. 1989;11(1):37–49. doi: 10.1016/0278-2626(89)90003-1. [DOI] [PubMed] [Google Scholar]
- Brainard DH. The Psychophysics Toolbox. Spat Vis. 1997;10(4):433–436. [PubMed] [Google Scholar]
- Celebrini S, Thorpe S, Trotter Y, Imbert M. Dynamics of orientation coding in area V1 of the awake primate. Vis Neurosci. 1993;10(5):811–825. doi: 10.1017/s0952523800006052. [DOI] [PubMed] [Google Scholar]
- Chiang MC, Reiss AL, Lee AD, Bellugi U, Galaburda AM, Korenberg JR, Mills DL, Toga AW, Thompson PM. 3D pattern of brain abnormalities in Williams syndrome visualized using tensor-based morphometry. Neuroimage. 2007;36(4):1096–1109. doi: 10.1016/j.neuroimage.2007.04.024. [DOI] [PMC free article] [PubMed] [Google Scholar]
- Chisum HJ, Fitzpatrick D. The contribution of vertical and horizontal connections to the receptive field center and surround in V1. Neural Netw. 2004;17(56):681–693. doi: 10.1016/j.neunet.2004.05.002. [DOI] [PubMed] [Google Scholar]
- Corballis MC, McLaren R. Winding one’s ps and qs: mental rotation and mirror-image discrimination. J Exp Psychol Hum Percept Perform. 1984;10(2):318–327. doi: 10.1037//0096-1523.10.2.318. [DOI] [PubMed] [Google Scholar]
- Deruelle C, Mancini J, Livet MO, Casse-Perrot C, de Schonen S. Configural and local processing of faces in children with Williams syndrome. Brain Cogn. 1999;41(3):276–298. doi: 10.1006/brcg.1999.1127. [DOI] [PubMed] [Google Scholar]
- Dilks DD, Reiss JE, Hoffman JE, Landau B. Representation of Orientation: Williams syndrome and Normal Development. In preparation 2006 [Google Scholar]
- Elliot CD. Differential Abilities Scale. San Diego: Harcourt, Brace, Jovanovich; 1990. [Google Scholar]
- Essock EA, Siqueland ER. Discrimination of orientation by human infants. Perception. 1981;10(3):245–253. doi: 10.1068/p100245. [DOI] [PubMed] [Google Scholar]
- Farran EK. Orientation coding: a specific deficit in williams syndrome? Dev Neuropsychol. 2006;29(3):397–414. doi: 10.1207/s15326942dn2903_1. [DOI] [PubMed] [Google Scholar]
- Farran EK, Jarrold C. Evidence for unusual spatial location coding in Williams syndrome: an explanation for the local bias in visuo-spatial construction tasks? Brain Cogn. 2005;59(2):159–172. doi: 10.1016/j.bandc.2005.05.011. [DOI] [PubMed] [Google Scholar]
- Field DJ, Hayes A, Hess RF. Contour integration by the human visual system: evidence for a local “association field”. Vision Res. 1993;33(2):173–193. doi: 10.1016/0042-6989(93)90156-q. [DOI] [PubMed] [Google Scholar]
- Furmanski CS, Engel SA. An oblique effect in human primary visual cortex. Nat Neurosci. 2000;3(6):535–536. doi: 10.1038/75702. [DOI] [PubMed] [Google Scholar]
- Gerhardstein P, Kovacs I, Ditre J, Feher A. Detection of contour continuity and closure in three-month-olds. Vision Res. 2004;44(26):2981–2988. doi: 10.1016/j.visres.2004.06.023. [DOI] [PubMed] [Google Scholar]
- Gilbert CD, Das A, Ito M, Kapadia M, Westheimer G. Spatial integration and cortical dynamics. Proc Natl Acad Sci U S A. 1996;93(2):615–622. doi: 10.1073/pnas.93.2.615. [DOI] [PMC free article] [PubMed] [Google Scholar]
- Golarai G, Ghahremani DG, Whitfield-Gabrieli S, Reiss A, Eberhardt JL, Gabrieli JD, Grill-Spector K. Differential development of high-level visual cortex correlates with category-specific recognition memory. Nat Neurosci. 2007;10(4):512–522. doi: 10.1038/nn1865. [DOI] [PMC free article] [PubMed] [Google Scholar]
- Grice SJ, Haan MD, Halit H, Johnson MH, Csibra G, Grant J, Karmiloff-Smith A. ERP abnormalities of illusory contour perception in Williams syndrome. Neuroreport. 2003;14(14):1773–1777. doi: 10.1097/00001756-200310060-00003. [DOI] [PubMed] [Google Scholar]
- Grossberg S, Mingolla E, Ross WD. Visual brain and visual perception: how does the cortex do perceptual grouping? Trends Neurosci. 1997;20(3):106–111. doi: 10.1016/s0166-2236(96)01002-8. [DOI] [PubMed] [Google Scholar]
- Gwiazda J, Scheiman M, Held R. Anisotropic resolution in children’s vision. Vision Res. 1984;24(6):527–531. doi: 10.1016/0042-6989(84)90106-8. [DOI] [PubMed] [Google Scholar]
- Hess R, Field D. Integration of contours: new insights. Trends Cogn Sci. 1999;3(12):480–486. doi: 10.1016/s1364-6613(99)01410-2. [DOI] [PubMed] [Google Scholar]
- Hoffman JE, Landau B, Pagani B. Spatial breakdown in spatial construction: evidence from eye fixations in children with Williams syndrome. Cognit Psychol. 2003;46(3):260–301. doi: 10.1016/s0010-0285(02)00518-2. [DOI] [PubMed] [Google Scholar]
- Kennedy H, Orban GA. Preferences for horizontal or vertical orientation in cat visual cortical neurones [proceedings] J Physiol. 1979;296:61P–62P. [PubMed] [Google Scholar]
- Kitada R, Kito T, Saito DN, Kochiyama T, Matsumura M, Sadato N, Lederman SJ. Multisensory activation of the intraparietal area when classifying grating orientation: a functional magnetic resonance imaging study. J Neurosci. 2006;26(28):7491–7501. doi: 10.1523/JNEUROSCI.0822-06.2006. [DOI] [PMC free article] [PubMed] [Google Scholar]
- Kohler S, Kapur S, Moscovitch M, Winocur G, Houle S. Dissociation of pathways for object and spatial vision: a PET study in humans. Neuroreport. 1995;6(14):1865–1868. doi: 10.1097/00001756-199510020-00011. [DOI] [PubMed] [Google Scholar]
- Kovacs I. Human development of perceptual organization. Vision Res. 2000;40(1012):1301–1310. doi: 10.1016/s0042-6989(00)00055-9. [DOI] [PubMed] [Google Scholar]
- Kovacs I, Lukacs A, Feher A, Racsmany M, Pleh C. Vision Sciences Society. Vol. 1. Sarasota: Florida Journal of Vision; 2001. Contour integration deficit in Williams Syndrome children; p. 146a. [Google Scholar]
- Landau B, Hoffman JE. Parallels between spatial cognition and spatial language: Evidence from Williams syndrome. J Lang Mem. 2005;53(2):163–185. [Google Scholar]
- Lenhoff HM, Wang PP, Greenberg F, Bellugi U. Williams syndrome and the brain. Sci Am. 1997;277(6):68–73. doi: 10.1038/scientificamerican1297-68. [DOI] [PubMed] [Google Scholar]
- Lewis TL, Kingdon A, Ellemberg D, Maurer D. Orientation discrimination in 5-year-olds and adults tested with luminance-modulated and contrast-modulated gratings. J Vis. 2007;7(4):9. doi: 10.1167/7.4.9. [DOI] [PubMed] [Google Scholar]
- Maffei L, Campbell FW. Neurophysiological localization of the vertical and horizontal visual coordinates in man. Science. 1970;167(917):386–387. doi: 10.1126/science.167.3917.386. [DOI] [PubMed] [Google Scholar]
- Mansfield RJ. Neural basis of orientation perception in primate vision. Science. 1974;186(4169):1133–1135. doi: 10.1126/science.186.4169.1133. [DOI] [PubMed] [Google Scholar]
- McCloskey M, Valtonen J, Sherman JC. Representing orientation: a coordinate-system hypothesis and evidence from developmental deficits. Cognit Neuropsychol. 2006 doi: 10.1080/02643290500538356. [DOI] [PubMed] [Google Scholar]
- Mervis CB, Robinson BF, Bertrand J, Morris CA, Klein-Tasman BP, Armstrong SC. The Williams syndrome cognitive profile. Brain Cogn. 2000;44(3):604–628. doi: 10.1006/brcg.2000.1232. [DOI] [PubMed] [Google Scholar]
- Meyer-Lindenberg A, Kohn P, Mervis CB, Kippenhan JS, Olsen RK, Morris CA, Berman KF. Neural basis of genetically determined visuospatial construction deficit in Williams syndrome. Neuron. 2004;43(5):623–631. doi: 10.1016/j.neuron.2004.08.014. [DOI] [PubMed] [Google Scholar]
- Morrone MC, Burr DC. Evidence for the existence and development of visual inhibition in humans. Nature. 1986;321(6067):235–237. doi: 10.1038/321235a0. [DOI] [PubMed] [Google Scholar]
- Murray SO, Kersten D, Olshausen BA, Schrater P, Woods DL. Shape perception reduces activity in human primary visual cortex. Proc Natl Acad Sci U S A. 2002;99(23):15164–15169. doi: 10.1073/pnas.192579399. [DOI] [PMC free article] [PubMed] [Google Scholar]
- Nauhaus I, Benucci A, Carandini M, Ringach DL. Neuronal selectivity and local map structure in visual cortex. Neuron. 2008;57(5):673–679. doi: 10.1016/j.neuron.2008.01.020. [DOI] [PMC free article] [PubMed] [Google Scholar]
- Palomares M, Landau B, Egeth H. Visuospatial interpolation in typically developing children and in people with Williams Syndrome. 2008 doi: 10.1016/j.visres.2008.08.012. [DOI] [PMC free article] [PubMed] [Google Scholar]
- Palomares M, Ogbonna CO, Landau B, Egeth H. Normal susceptibility to visual illusions in abnormal development: evidence from Williams Syndrome. Perception. doi: 10.1068/p6044. in Press. [DOI] [PMC free article] [PubMed] [Google Scholar]
- Pani JR, Mervis CB, Robinson BF. Global spatial organization by individuals with Williams Syndrome. Psychol Sci. 1999;10(5):453–458. [Google Scholar]
- Pelli DG. The VideoToolbox software for visual psychophysics: transforming numbers into movies. Spat Vis. 1997;10(4):437–442. [PubMed] [Google Scholar]
- Polat U, Sagi D. Lateral interactions between spatial channels: suppression and facilitation revealed by lateral masking experiments. Vision Res. 1993;33(7):993–999. doi: 10.1016/0042-6989(93)90081-7. [DOI] [PubMed] [Google Scholar]
- Popple A, Polat U, Bonneh Y. Collinear effects on 3-Gabor alignment as a function of spacing, orientation and detectability. Spat Vis. 2001;14(2):139–150. doi: 10.1163/156856801300202904. [DOI] [PubMed] [Google Scholar]
- Rollenhagen JE, Olson CR. Mirror-image confusion in single neurons of the macaque inferotemporal cortex. Science. 2000;287(5457):1506–1508. doi: 10.1126/science.287.5457.1506. [DOI] [PubMed] [Google Scholar]
- Sarpal D, Buchsbaum BR, Kohn PD, Kippenhan JS, Mervis CB, Morris CA, Meyer-Lindenberg A, Berman KF. A Genetic Model for Understanding Higher Order Visual Processing: Functional Interactions of the Ventral Visual Stream in Williams Syndrome. Cereb Cortex. 2008 doi: 10.1093/cercor/bhn004. [DOI] [PMC free article] [PubMed] [Google Scholar]
- Scerif G, Karmiloff-Smith A. The dawn of cognitive genetics? Crucial developmental caveats. Trends Cogn Sci. 2005;9(3):126–135. doi: 10.1016/j.tics.2005.01.008. [DOI] [PubMed] [Google Scholar]
- Slater A, Mattock A, Brown E, Bremner JG. Form perception at birth: Cohen and Younger (1984) revisited. J Exp Child Psychol. 1991;51(3):395–406. doi: 10.1016/0022-0965(91)90084-6. [DOI] [PubMed] [Google Scholar]
- Slater A, Morison V, Somers M. Orientation discrimination and cortical function in the human newborn. Perception. 1988;17(5):597–602. doi: 10.1068/p170597. [DOI] [PubMed] [Google Scholar]
- Song Y, Peng D, Lu C, Liu C, Li X, Liu P, Qu Z, Ding Y. An event-related potential study on perceptual learning in grating orientation discrimination. Neuroreport. 2007;18(9):945–948. doi: 10.1097/WNR.0b013e3281527795. [DOI] [PubMed] [Google Scholar]
- Stromme P, Bjornstad PG, Ramstad K. Prevalence estimation of Williams syndrome. J Child Neurol. 2002;17(4):269–271. doi: 10.1177/088307380201700406. [DOI] [PubMed] [Google Scholar]
- Timney BN, Muir DW. Orientation anisotropy: incidence and magnitude in Caucasian and Chinese subjects. Science. 1976;193(4254):699–701. doi: 10.1126/science.948748. [DOI] [PubMed] [Google Scholar]
- Valyear KF, Culham JC, Sharif N, Westwood D, Goodale MA. A double dissociation between sensitivity to changes in object identity and object orientation in the ventral and dorsal visual streams: a human fMRI study. Neuropsychologia. 2006;44(2):218–228. doi: 10.1016/j.neuropsychologia.2005.05.004. [DOI] [PubMed] [Google Scholar]
- Volkmann FC, Zametkin AJ, Stoykovich CA. Visual discrimination of orientation by the goldfish (Carassius auratus) J Comp Physiol Psychol. 1974;86(5):875–882. doi: 10.1037/h0036420. [DOI] [PubMed] [Google Scholar]
- Wang PP, Doherty S, Rourke SB, Bellugi U. Unique profile of visuo-perceptual skills in a genetic syndrome. Brain Cogn. 1995;29(1):54–65. doi: 10.1006/brcg.1995.1267. [DOI] [PubMed] [Google Scholar]