

Abstract
Purpose: To examine whether the severity and spatial distribution of reductions in apparent diffusion coefficient (ADC) are associated with clinical outcomes in patients who become comatose after cardiac arrest.
Materials and Methods: This was an institutional review board–approved, HIPAA-compliant retrospective study of 80 comatose patients with cardiac arrest who underwent diffusion-weighted magnetic resonance imaging. The need to obtain informed consent was waived except when follow-up phone calls were required; in those cases, informed consent was obtained from the families. Mean patient age was 57 years ± 16 (standard deviation); 31 (39%) patients were women. ADC maps were semiautomatically segmented into the following regions: subcortical white matter; cerebellum; insula; frontal, occipital, parietal, and temporal lobes; caudate nucleus; putamen; and thalamus. Median ADCs were measured in these regions and in the whole brain and were compared (with a two-tailed Wilcoxon test) as a function of clinical outcome. Outcome was defined by both early eye opening in the 1st week after arrest (either spontaneously or in response to external stimuli) and 6-month modified Rankin scale score.
Results: Whole-brain median ADC was a significant predictor of poor outcome as measured by no eye opening (specificity, 100% [95% confidence interval {CI}: 86%, 100%]; sensitivity, 30% [95% CI: 18%, 45%]) or 6-month modified Rankin scale score greater than 3 (specificity, 100% [95% CI: 73%, 100%]; sensitivity, 41% [95% CI: 29%, 54%]), with patients with poor outcomes having significantly lower ADCs for both outcome measures (P ≤ .001). Differences in ADC between patients with good and those with poor outcomes varied according to brain region, involving predominantly the occipital and parietal lobes and the putamen, and were dependent on the timing of imaging.
Conclusion: Spatial and temporal differences in ADCs may provide insight into mechanisms of hypoxic-ischemic brain injury and, hence, recovery.
© RSNA, 2009
In comatose patients after cardiac arrest, prediction of meaningful neurologic recovery within the first several weeks can be challenging. Mortality rates with cardiac arrest range from 60% to 85%, and approximately 80% of survivors are initially comatose (1–3). Of those who survive, 50% are left with a permanent neurologic disability, and only 10% are able to resume their former lifestyle (1,2). Multiple methods have been assessed for prognostic value in this setting, including the clinical examination (3), electrophysiology with electroencephalography (4) and somatosensory evoked potentials (5), and plasma biomarkers indicative of neuronal cell death (6). Some groups (7) have looked at a combined approach with these modalities to improve the power of prognostication. However, prognostication can be achieved with very high specificity only for patients who rapidly awaken after their arrest and are destined for a good outcome (8) and for those who remain deeply comatose at 72 hours with minimal brainstem activity or absent cortical somatosensory evoked potentials and are destined for a poor outcome (9). Physicians are often left in a quandary trying to predict the neurologic prognosis for the majority of patients whose conditions do not fit into either the very good or very grim categories.
Neuroimaging is potentially useful in the prediction of neurologic recovery; however, literature to support the use of neuroimaging is quite sparse and is limited by small sample sizes and infrequent quantification of the findings. Computed tomographic (CT) findings are most often normal when CT is performed early after cardiac arrest (10), and patients who develop dramatic changes at CT typically do not pose diagnostic dilemmas, thus leaving CT as a technique of limited value in most cases. Magnetic resonance (MR) imaging remains a more promising technique because of its sensitivity at earlier time stages. Diffusion-weighted (DW) imaging appears particularly promising, as it is highly sensitive to early ischemic changes (11). Experimental animal models of global ischemia showed that changes in the apparent diffusion coefficient (ADC) were immediate (12) and varied over time and by tissue region (13). Furthermore, DW imaging abnormalities in patients with cardiac arrest have correlated with poor outcome in several small studies (≤12 patients) (14), and it appears that changes may occur in different brain regions on the basis of the timing of imaging after arrest (15) or the nature of the injury (eg, primary hypoxia followed by ischemia) (16).
The purpose of our study was to examine whether the severity and spatial distribution of reductions in ADC are associated with clinical outcomes in patients who become comatose after cardiac arrest.
MATERIALS AND METHODS
Patients
We retrospectively analyzed data acquired as part of a Massachusetts General Hospital Institutional Review Board–approved, Health Insurance Portability and Accountability Act–compliant, single-center prospective observational study of 500 patients with nontraumatic coma. Data were collected from 2000 to 2007. Within this patient cohort, 200 patients were comatose after cardiac arrest. The decision to perform additional testing, including neuroimaging, was at the discretion of the treating clinicians. A total of 80 patients (age range, 23–88 years; mean age, 57 years ± 16 [standard deviation]) consisting of 49 men (age range, 23–79 years; mean age, 57 years ± 16) and 31 women (age range, 23–88 years; mean age, 57 years ± 16) underwent MR imaging performed by using a 1.5-T imaging unit. Eight patients underwent two MR imaging examinations, and one underwent three. For these eight patients, we used only the initial studies for analysis. Fourteen patients underwent induced hypothermia treatment within 6 hours of cardiac arrest. The requirement to obtain informed consent was waived unless the patient survived the hospital admission and a follow-up phone call was required at 3 and/or 6 months; in these cases, informed consent was obtained from the families.
Imaging Studies
Patients underwent MR imaging performed by using 1.5-T imaging units (GE Medical Systems, Milwaukee, Wis). Owing to the retrospective nature of this study, the DW imaging protocol changed over time. Repetition time was typically 7500 msec (n = 48) or 5000 msec (n = 30), with one patient imaged by using a repetition time of 10 000 msec and another imaged by using a repetition time of 6300 msec. A minimum echo time, typically between 71 and 103 msec, was used. Axial images were acquired with section thicknesses ranging from 5 to 6 mm and a 1-mm intersection gap. A 128 × 128 acquisition matrix was used with 37 studies zero filled to 256 × 256, resulting in in-plane resolutions ranging from 0.86 × 0.86 mm2 to 1.9 × 1.9 mm2. Multisection axial DW images were acquired by sampling the full diffusion tensor by using either single-shot pulsed field gradient spin-echo echo-planar imaging sequences with post hoc eddy current correction (17) or a twice-refocused spin-echo echo-planar imaging sequence (18). The total number of gradients with diffusion weighting (b value = 1000 sec/mm2) ranged from six to 25, with one to three images with a b value of 0 sec/mm2.
Because DW imaging changes in comatose patients with cardiac arrest are often diffusely distributed and are limited to only qualitative evaluation and are therefore difficult to compare across subjects, we examined whether the severity of reduction in ADC can be used to objectively assess the extent of brain damage by using a quantitative and automated approach. ADC maps were calculated from the slope of the linear regression fit of the log of the DW images (b value = 1000 sec/mm2) and the images with a b value of 0 sec/mm2. The latter images were nonlinearly coregistered (19) to the ICBM-452 T1 5th Order Polynomial Warps Atlas (20). By using the International Consortium for Brain Mapping probabilistic atlases (21,22), masks were generated by using a threshold of 50% (Fig 1) for the following regions: subcortical white matter; cerebellum; insula; frontal, occipital, parietal, and temporal lobes; caudate nucleus; putamen; and thalamus. Median ADC was automatically measured in these regions, as well as in the entire brain, by using these masks. To minimize effects from cerebral spinal fluid, analysis was limited to ADCs of 1200 × 10−6 mm2/sec or less (23).
Figure 1a:
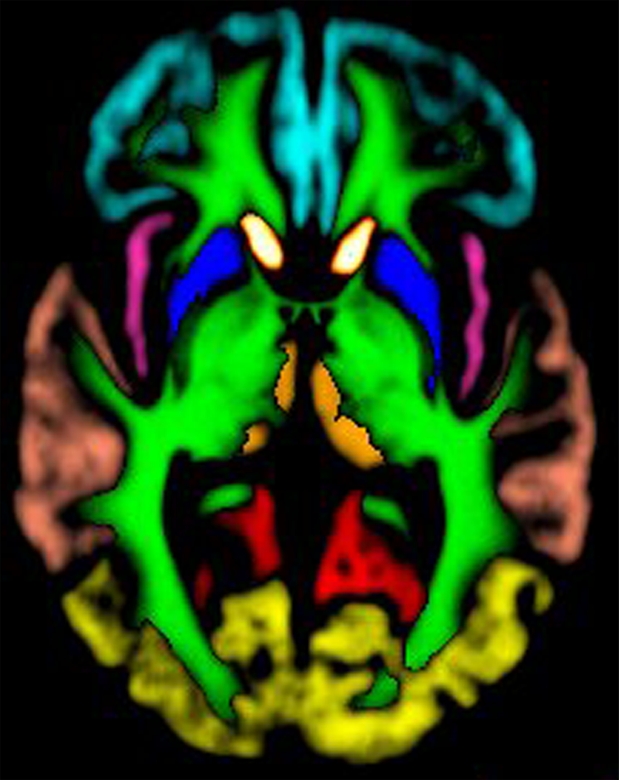
Images created from probabilistic atlas show different color codes that represent the probability that tissue found at a position belongs to a given tissue region (ie, white matter; caudate nucleus; putamen; thalamus; cerebellum; insula; frontal, occipital, parietal, and temporal lobes) in (a) axial, (b) sagittal, and (c) coronal views. For clarity, only tissue with a probability of classification of greater than 50% is shown. (Images generated by using Display; Montreal Neurological Institute, Montreal, Quebec, Canada.) (d, e) Coregistered axial (d) ADC and (e) DW imaging maps in 67-year-old woman imaged 3 days after cardiac arrest with a 6-month modified Rankin scale score of 6.
Figure 1b:
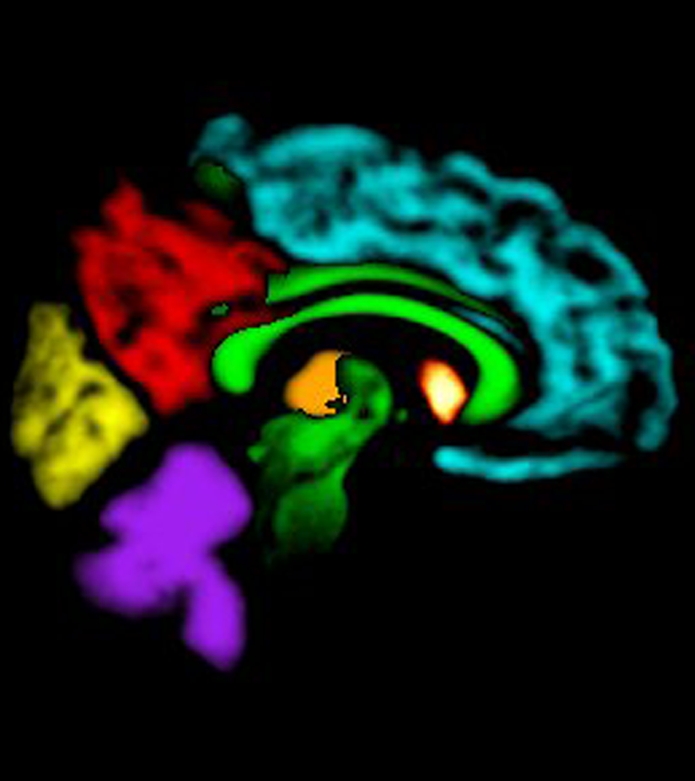
Images created from probabilistic atlas show different color codes that represent the probability that tissue found at a position belongs to a given tissue region (ie, white matter; caudate nucleus; putamen; thalamus; cerebellum; insula; frontal, occipital, parietal, and temporal lobes) in (a) axial, (b) sagittal, and (c) coronal views. For clarity, only tissue with a probability of classification of greater than 50% is shown. (Images generated by using Display; Montreal Neurological Institute, Montreal, Quebec, Canada.) (d, e) Coregistered axial (d) ADC and (e) DW imaging maps in 67-year-old woman imaged 3 days after cardiac arrest with a 6-month modified Rankin scale score of 6.
Figure 1c:
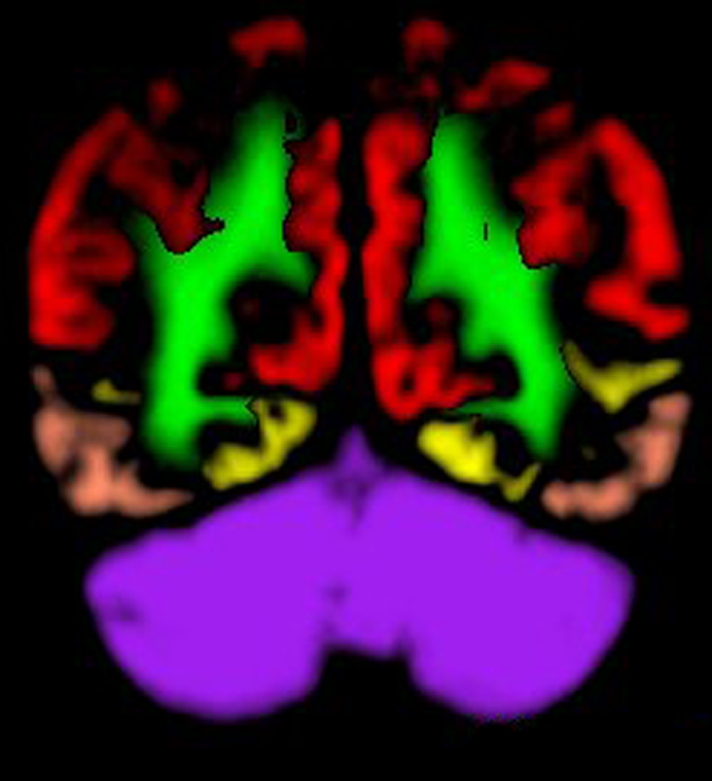
Images created from probabilistic atlas show different color codes that represent the probability that tissue found at a position belongs to a given tissue region (ie, white matter; caudate nucleus; putamen; thalamus; cerebellum; insula; frontal, occipital, parietal, and temporal lobes) in (a) axial, (b) sagittal, and (c) coronal views. For clarity, only tissue with a probability of classification of greater than 50% is shown. (Images generated by using Display; Montreal Neurological Institute, Montreal, Quebec, Canada.) (d, e) Coregistered axial (d) ADC and (e) DW imaging maps in 67-year-old woman imaged 3 days after cardiac arrest with a 6-month modified Rankin scale score of 6.
Figure 1d:

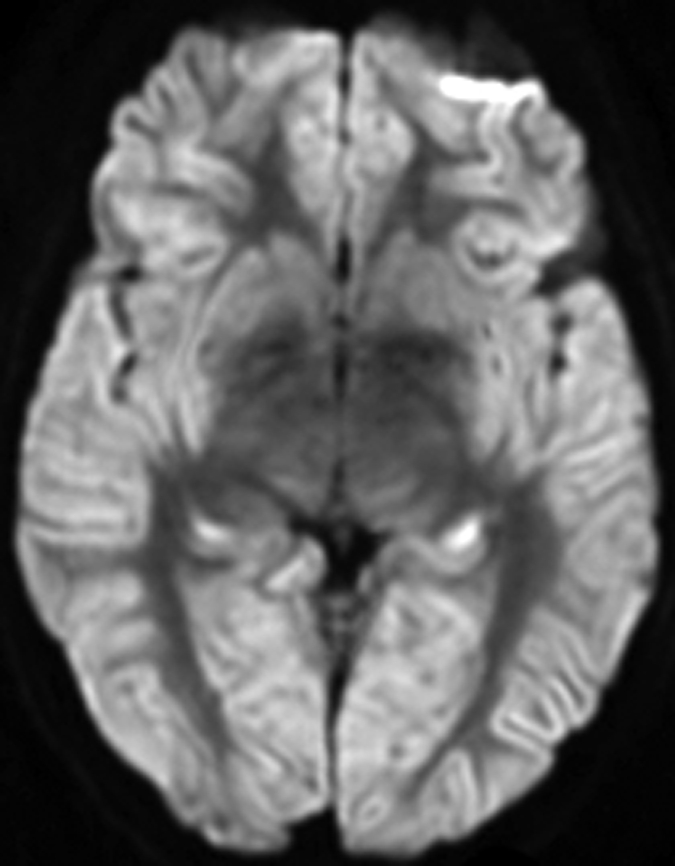
Images created from probabilistic atlas show different color codes that represent the probability that tissue found at a position belongs to a given tissue region (ie, white matter; caudate nucleus; putamen; thalamus; cerebellum; insula; frontal, occipital, parietal, and temporal lobes) in (a) axial, (b) sagittal, and (c) coronal views. For clarity, only tissue with a probability of classification of greater than 50% is shown. (Images generated by using Display; Montreal Neurological Institute, Montreal, Quebec, Canada.) (d, e) Coregistered axial (d) ADC and (e) DW imaging maps in 67-year-old woman imaged 3 days after cardiac arrest with a 6-month modified Rankin scale score of 6.
Figure 1e:
Images created from probabilistic atlas show different color codes that represent the probability that tissue found at a position belongs to a given tissue region (ie, white matter; caudate nucleus; putamen; thalamus; cerebellum; insula; frontal, occipital, parietal, and temporal lobes) in (a) axial, (b) sagittal, and (c) coronal views. For clarity, only tissue with a probability of classification of greater than 50% is shown. (Images generated by using Display; Montreal Neurological Institute, Montreal, Quebec, Canada.) (d, e) Coregistered axial (d) ADC and (e) DW imaging maps in 67-year-old woman imaged 3 days after cardiac arrest with a 6-month modified Rankin scale score of 6.
Statistical Analysis
Spatial differences among the regions were examined by using a one-way analysis of variance with a post-hoc Student-Newman-Keuls test (KaleidaGraph, version 4.0; Synergy Institute, Reading, Pa). Median ADC in the regions, as well as in the whole brain, was compared with clinical outcome defined by the modified Rankin scale score and eye opening. Patients underwent routine clinical evaluations, including neurologic assessments, on days 0, 1, 3, and 7 after cardiac arrest, and a modified Rankin scale score was obtained at 6 months in surviving patients. Because this was an observational study and the investigators were not involved in the decision to continue or withdraw care, many patients underwent withdrawal of life support and may not have had an opportunity to show recovery as measured on the modified Rankin scale. Thus, eye opening (spontaneous or in response to stimulation) within the 1st week was also used as a surrogate measure of potential good outcome. Differences between patients with eye opening and those with no eye opening were compared by using a two-tailed Wilcoxon rank-sum test (JMP, version 7.0, SAS Institute, Cary, NC). No eye opening is a potential sign of poor recovery in patients who undergo life support withdrawal (and who thus would die without the potential for demonstrating recovery at 6 months). We performed a similar analysis (with two-tailed Wilcoxon rank-sum tests) by using a modified Rankin scale score greater than 3 at 6 months to represent poor outcome and a modified Rankin scale score of 3 or less to represent good outcome.
The Fisher exact two-tailed test was used to test for significant differences between patients who were treated with induced hypothermia and those who were not (JMP, version 7.0). Subset analysis to examine differences between early and late imaging was performed for patients imaged at less than 3 days and those imaged at 3 or more days after cardiac arrest because the median time to the first MR imaging examination was 2 days (JMP, version 7.0). Backward stepwise logistic regression was performed to investigate the relationship between Glasgow Coma Scale score at admission (obtained on day 0 or day 1), age, sex, time to MR imaging, hypothermia therapy administration, and ADC with 6-month modified Rankin scale scores dichotomized as indicating poor (modified Rankin scale score > 3) or good (modified Rankin scale score ≤ 3) outcome (JMP, version 7.0). Sensitivity values were calculated for the case of no false-positive findings and the maximum number of true-positive findings. Ninety-five percent confidence intervals were calculated according to the efficient-score method (corrected for continuity) (24,25). The sensitivity of the univariate analysis was compared with that of the multivariate analysis by using a χ2 test (26) (R, version 2.1.0; R Foundation for Statistical Computing, Vienna, Austria). P < .05 was considered to indicate a significant difference for all analyses.
RESULTS
Patient Demographic Data
Table 1 shows demographic data for the patients who exhibited early eye opening (n = 30) and those who did not (n = 50). Of the 80 patients, 64 died between 1 and 22 days (median, 5 days) after cardiac arrest. There were significant differences (P < .001) in 6-month modified Rankin scale scores between patients with eye opening and patients without eye opening (Fig 2). Among the patients with eye opening, 17 opened their eyes on day 1 (57%), 10 on day 3 (33%), and three on day 7 (10%). Of these 30 patients, 15 died because of withdrawal of care, one experienced another unexpected cardiac arrest and subsequently died, and 14 survived (13 with 6-month modified Rankin scale scores ≤ 3). Of the patients who underwent induced hypothermia (n = 14), seven (50%) opened their eyes (six patients by day 1 and one patient by day 3), while five (36%) had a 6-month modified Rankin scale score of 3 or less, compared with 23 (35%) patients who showed eye opening and nine (14%) who had a 6-month modified Rankin scale score of 3 or less in the group that did not undergo hypothermia treatment (n = 66). There were no significant differences in terms of outcome between patients treated with hypothermia and those not treated with hypothermia; this was likely due to the small number of patients.
Table 1.
Imaging and Clinical Characteristics in Study Population

Note.—Unless otherwise stated, data are means ± standard deviations.
Data in parentheses are percentages.
Data are medians, with ranges in parentheses.
Figure 2:

Graph shows distribution of 6-month modified Rankin scale (mRS) scores for patients with early eye opening (n = 30) and patients without early eye opening (n = 50). The median value for both groups was 6; however, a significant difference (P < .001) between the groups is evident. Among the patients characterized as having a good outcome according to a modified Rankin scale score of 3 or less (n = 14), only one patient did not have eye opening within the 1st week after arrest.
Regional Analysis
The putamen exhibited significantly lower (P ≤ .001) median ADC (expressed as × 10−6 mm2/sec) (700 [interquartile range {IQR}, 570–770]), and the insula exhibited significantly higher (P ≤ .01) median ADC (860 [IQR, 750–920]), than the other regions in the brain (cerebellum: 770 [IQR, 690–810]; frontal lobe: 780 [IQR, 710–840]; occipital lobe: 760 [IQR, 600–820]; parietal lobe: 760 [IQR, 640–850]; temporal lobe: 820 [IQR, 760–890]; caudate nucleus: 770 [IQR, 700–840]; thalamus: 750 [IQR, 680–810]; and white matter: 730 [IQR, 680–800]). Median whole-brain ADC in patients with eye opening was significantly higher than that in patients without eye opening (Table 2). All regions, with the exception of the thalamus, exhibited significantly more severe ADC reductions in patients who did not experience eye opening. Patients with poor outcome at 6 months (modified Rankin scale score > 3) exhibited significantly lower ADCs in all regions (Table 3) with the exception of the thalamus, which showed marginally different ADC (P = .06). Among patients who experienced early eye opening, ADCs (expressed as × 10−6 mm2/sec) in the putamen (730 [IQR, 670–750]) were significantly lower (P = .02) in patients with poor outcome at 6 months (n = 17) than in patients with good outcome at 6 months (n = 13) (760 [IQR, 720–840]). For patients who underwent induced hypothermia, the caudate nucleus (P = .02) and the putamen (P = .03) had significantly higher ADCs, while the insula (P = .05) demonstrated a tendency toward a higher ADC.
Table 2.
Median Whole-Brain and Regional ADCs in Patients with and Those without Eye Opening

Note.—Data are ADCs (× 10−6 mm2/sec), with IQRs in parentheses.
Table 3.
Median Whole-Brain and Regional ADCs versus Outcome according to 6-month Modified Rankin Scale Score

Note.—Data are ADCs (× 10−6 mm2/sec), with IQRs in parentheses.
Early versus Late MR Imaging
There were significant differences in whole-brain ADCs between patients with and those without eye opening for studies performed less than 3 days and those performed 3 or more days after cardiac arrest (Table 4). For studies performed less than 3 days after the event, all regions except the cerebellum showed significant differences between eye-opening groups. For studies performed 3 or more days after the event, differences between patients with and those without eye opening in terms of ADCs for all regions were less pronounced compared with the early imaging group except in the occipital lobe. With outcome judged according to 6-month modified Rankin scale scores, whole-brain ADCs were significantly lower in patients with poor outcomes (modified Rankin scale score > 3) for late imaging studies but had a tendency to be lower in patients imaged early (P = .055). For studies performed less than 3 days after the event, the frontal, occipital, and parietal lobes, as well as the caudate nucleus and the putamen, exhibited significantly reduced ADCs. For studies performed 3 or more days after the event, differences between patients with good and those with poor modified Rankin scale scores became more pronounced for all regions except for the striatum, thalamus, and cerebellum.
Table 4.
P Values for Difference in Median ADCs between Patients with Good and Those with Poor Outcome Dichotomized by Whether MR Imaging Was Performed Early or Late

Note.—Early MR imaging (<3 days after cardiac arrest) was performed in 48 patients; late MR imaging (≥3 days after cardiac arrest) was performed in 32 patients. In parentheses are the numbers of patients in each group with good outcome (eye opening or modified Rankin scale score ≤ 3).
Patients who underwent induced hypothermia tended to undergo imaging at later time points (P < .001). There was no difference in ADCs between patients who underwent hypothermia (n = 11) and those who did not (n = 21) imaged 3 or more days after the event. However, for patients imaged less than 3 days after cardiac arrest, there remained a tendency for patients who underwent induced hypothermia (n = 3) to have larger ADCs in the caudate nucleus (P < .1), insula (P < .1), and putamen (P = .06) than patients who did not undergo hypothermia (n = 45). For the subset of patients with eye opening and early imaging (n = 15), no significant difference was found between those with good (n = 5) and poor (n = 10) outcomes according to the modified Rankin scale; this was likely due to the small sample size. For patients with eye opening and late imaging (n = 15), there were significant differences in ADCs in the whole brain (P = .04), white matter (P = .04), and putamen (P = .04) between patients with good (n = 8) and those with poor (n = 7) outcomes in terms of modified Rankin scale score.
Logistic Regression Analysis
In univariate analysis, considering whole-brain median ADC, age, sex, baseline Glasgow Coma Scale score, whether hypothermia was induced, and day of MR imaging, only whole-brain median ADC (P = .005) significantly predicted 6-month modified Rankin scale score, although hypothermia treatment (P = .06) and day of MR imaging (P = .05) had a tendency toward significance. ADC significantly correlated with modified Rankin scale score (Spearman ρ = −0.36, P < .001, Fig 3). No patients with severe (<665 × 10−6 mm2/sec) reductions in median whole-brain ADC experienced either eye opening or good outcome according to the modified Rankin scale at 6 months. Multiple logistic regression analysis incorporating all of the above parameters revealed that whole-brain ADC continued to be a significant factor (P = .004). When the different brain regions were included in the model with whole-brain ADC by using backward stepwise regression, only ADCs in the occipital (P = .006) and parietal (P = .009) lobes and in the putamen (P = .04) were significant. The resultant model had a specificity of 100% (95% confidence interval [CI]: 73%, 100%) and a sensitivity of 80% (95% CI: 68%, 89%) compared with the univariate model that incorporated only whole-brain ADC, which had the same specificity but a sensitivity of 41% (95% CI: 29%, 54%) (P < .001). For prediction of poor outcome by using eye opening and whole-brain ADC, specificity was 100% (95% CI: 86%, 100%) and sensitivity was 30% (95% CI: 18%, 45%).
Figure 3:

Scatterplot of ADC versus modified Rankin scale (mRS) score as a function of time of MR imaging (early, <3 days; late, ≥3 days) and whether or not the patient experienced eye opening. Patients with whole-brain ADCs less than 665 × 10−6 mm2/sec had poor outcomes, defined as no eye opening or a 6-month modified Rankin scale score of 6, regardless of the timing of the MR imaging study.
DISCUSSION
Our results demonstrate that ADC maps obtained during routine MR imaging may be valuable in assessing the state of brain damage and, hence, the potential for recovery in patients who are comatose after cardiac arrest. The degree of ADC reduction associated with poor outcome appears to depend on the region of tissue and the timing of imaging. We found that severe ADC depression within the first few days of global anoxic brain injury is highly specific for permanent injury. We found a strong association between the degree and location of ADC changes and different outcome measures, including eye opening and score on the modified Rankin scale, a well-validated scale of neurologic disability. At imaging performed within the first 3 days after cardiac arrest, ADC differences involved mostly the cortical regions and striatum, whereas in later studies, the changes were restricted to cortical regions and subcortical white matter. Changes in the cerebellum were more evident in patients undergoing later imaging.
We speculate that the lack of differences in the later time points in the striatum and thalamus could be due to pseudonormalization. Animal models have shown that with the restoratron of perfusion, brain tissue experiences rapid pseudonormalization (12), only to deteriorate again at subsequent time points (13). We hypothesize that a similar pattern may occur in patients resuscitated after cardiac arrest. The observed time course of brain damage that our results suggest—that is, initial ADC reduction in the striatum and thalamus, followed by the cortex and then the subcortical white matter—may be an indication of ongoing tissue damage as a result of secondary energy failure (27) and apoptotic processes (28). We suspect that the rate at which an individual patient reaches these stages will depend on the time to resuscitation, the etiology of the cardiac arrest (29), and the patient's comorbidities. A prospective study involving longer observational times for neurologic recovery and predefined imaging time points is clearly needed to better characterize the dynamics of brain damage in these patients. If a pattern representing a high likelihood of poor outcome could be determined, the early withdrawal of care from patients who would otherwise have a chance for recovery could be avoided. Alternatively, a pattern that demonstrates whether salvageable tissue still exists may be identified, and therefore a patient could undergo therapy such as neuroprotective treatment or at least continued supportive care. Complementary to determining whether therapy can be administered successfully, our findings also suggest that ADC may be helpful in monitoring the benefits of therapy, as shown by the higher measured ADCs in patients who underwent induced hypothermia, a finding consistent with findings in animal studies (30,31).
As a preliminary attempt to identify patterns with poor outcome, we related whole-brain median ADC to clinical outcome. In our cohort, no patients with severe (<665 × 10−6 mm2/sec) whole-brain median ADC reductions experienced either eye opening or good outcome according to the modified Rankin scale at 6 months. This suggests that marked whole-brain median ADC reductions may be a reflection of severe, irreversible brain damage. By relying on whole-brain metrics, calculating median ADC automatically becomes fairly straightforward when one is assessing the likelihood of recovery. By performing multivariate analysis, we were able to increase the sensitivity of MR imaging–based metrics (from 41% to 80%) without reducing specificity (100%). However, a comparison of these results with current clinical reference standards, such as somatosensory evoked potentials (3), should be performed, as well as validated against an independent cohort of patients.
Prior studies of MR imaging in cardiac arrest have been limited by small sample sizes and an absence of quantitative data. Wijdicks et al (14) evaluated 10 comatose survivors of cardiac arrest with DW imaging, limiting their study to only those patients who had preserved pupillary reflexes and normal somatosensory evoked potentials. Patients underwent MR imaging performed at variable time points within 15 days of cardiac arrest. Eight patients with diffuse signal intensity abnormalities had no recovery beyond a severely disabled state, whereas two patients with limited or no changes later awakened. Arbelaez et al (15) performed a retrospective analysis of 11 MR imaging studies in 10 patients with prolonged (>6 minutes) cardiac arrest. They separated their findings on the basis of the timing of the imaging examination after the arrest: acute (<24 hours), early subacute (24 hours to 13 days), late subacute (14–20 days), and chronic (>21 days). They suggested that there is an evolution in DW imaging signal intensity abnormalities from the basal ganglia and cerebellum (acute), to the cortex and basal ganglia (early subacute), to the white matter (late subacute). However, the number of patients in that study was small, and only one patient underwent imaging twice, making it difficult to know whether these changes were evolutionary or representative of individual patient characteristics. Chalela et al (16) retrospectively analyzed MR imaging studies in seven patients who underwent imaging within 7 days of cardiac arrest. They described a pattern of signal intensity abnormalities that primarily affected the white matter, consistent with a potential selective myelinolytic process triggered by anoxia followed by ischemia, such as with a respiratory arrest leading to a cardiac arrest (32). The study of Chalela et al also provided a quantitative analysis of ADC depression, but its value is limited because of the small number of patients studied.
The timing of MR imaging has also previously been found to be a potential confounding factor, as is consistent with our findings. Els et al (33) evaluated 12 patients with DW imaging within 36 hours of a cardiac arrest lasting 10–25 minutes. There was an attempt in eight of the 12 patients to quantify the degree of ADC depression. Patients who had short resuscitation times and limited DW imaging changes went on to make a good recovery, whereas the others progressed to a minimally conscious or persistent vegetative state. Others have cautioned that a normal MR imaging study this early can lead to falsely optimistic results and that changes consistent with a more severe injury may be seen on subsequent imaging studies (13,34–36).
Our study was limited by being a retrospective analysis with selection bias. We did not control whether a patient underwent MR imaging or what the timing of the MR imaging examination would be. MR imaging may not be appropriate for all comatose patients with cardiac arrest, such as those with ongoing hemodynamic instability, a poor long-term prognosis on the basis of other comorbidities, or a contraindication to MR imaging (eg, pacemaker or automatic implantable cardioverter-defibrillator). We could not dictate whether a patient was allowed to survive for a longer period of time to determine if he or she would recover; thus, many patients may have had a modified Rankin scale score of 6 because of withdrawal of life-sustaining therapy. For this reason, we also assessed the outcome measure of early eye opening as an indication of patients who may have been showing some recovery prior to withdrawal of care. This self-fulfilling prophecy is a common problem in many studies of patients with cardiac arrest. Investigators in future studies may wish to pursue a longer observation time or other potential outcome measures that may be used while the patient is still alive, such as eye opening or a positive change in the Glasgow Coma Scale score.
In summary, severe ADC reduction is a strong prognosticator of poor outcome in comatose patients with cardiac arrest and may therefore be a valuable tool for clinical assessment. The location and degree of ADC depression is associated with clinical outcome measures, both for imaging performed acutely and that performed subacutely after arrest. Future studies are needed to prospectively evaluate these findings and will hopefully prove MR imaging to be a highly sensitive and specific diagnostic tool in prognosticating recovery from coma after cardiac arrest.
ADVANCES IN KNOWLEDGE
Whole-brain median ADC was a significant predictor of poor outcome as measured by no eye opening in the 1st week after cardiac arrest or a modified Rankin score greater than 3, and patients with poor outcomes had significantly lower ADCs for both metrics.
ADC differences between patients with good and those with poor outcomes varied according to brain region and timing of imaging.
Multivariate analysis of ADCs in occipital and parietal lobes and putamen increased sensitivity in predicting poor outcome while maintaining high specificity compared with univariate models.
IMPLICATIONS FOR PATIENT CARE
Serial MR imaging may allow clinicians to stage the degree of recovery or injury in comatose patients with cardiac arrest, potentially improving the ability of clinicians to predict which patients have a chance for a good outcome.
Evaluating patients for severe whole-brain ADC reductions can be used for confirmatory testing, thereby potentially avoiding long and futile support of patients with a high likelihood of a poor outcome.
Acknowledgments
The authors acknowledge Mark Vangel, PhD, for manuscript review and statistical guidance.
Abbreviations
ADC = apparent diffusion coefficient
DW = diffusion weighted
IQR = interquartile range
Author contributions: Guarantors of integrity of entire study, O.W., D.M.G.; study concepts/study design or data acquisition or data analysis/interpretation, all authors; manuscript drafting or manuscript revision for important intellectual content, all authors; manuscript final version approval, all authors; literature research, O.W., A.B.S., D.M.G.; clinical studies, O.W., A.G.S., T.B., A.B.S., K.L.F., D.M.G.; statistical analysis, O.W., K.L.F., D.M.G.; and manuscript editing, all authors
Authors stated no financial relationship to disclose.
Funding: This research was supported in part by the National Institutes of Health (grants R01NS59775, R01NS38477, P50NS051343, R01NS051412, and NCRR [P41RR14075]).
References
- 1.Thel MC, O'Connor CM. Cardiopulmonary resuscitation: historical perspective to recent investigations. Am Heart J 1999;137:39–48. [DOI] [PubMed] [Google Scholar]
- 2.Pusswald G, Fertl E, Faltl M, Auff E. Neurological rehabilitation of severely disabled cardiac arrest survivors. II. Life situation of patients and families after treatment. Resuscitation 2000;47:241–248. [DOI] [PubMed] [Google Scholar]
- 3.Levy DE, Caronna JJ, Singer BH, Lapinski RH, Frydman H, Plum F. Predicting outcome from hypoxic-ischemic coma. JAMA 1985;253:1420–1426. [PubMed] [Google Scholar]
- 4.Edgren E, Hedstrand U, Nordin M, Rydin E, Ronquist G. Prediction of outcome after cardiac arrest. Crit Care Med 1987;15:820–825. [DOI] [PubMed] [Google Scholar]
- 5.Zandbergen EG, Hijdra A, Koelman JH, et al. Prediction of poor outcome within the first 3 days of postanoxic coma. Neurology 2006;66:62–68. [DOI] [PubMed] [Google Scholar]
- 6.Fogel W, Krieger D, Veith M, et al. Serum neuron-specific enolase as early predictor of outcome after cardiac arrest. Crit Care Med 1997;25:1133–1138. [DOI] [PubMed] [Google Scholar]
- 7.Prohl J, Rother J, Kluge S, et al. Prediction of short-term and long-term outcomes after cardiac arrest: a prospective multivariate approach combining biochemical, clinical, electrophysiological, and neuropsychological investigations. Crit Care Med 2007;35:1230–1237. [DOI] [PubMed] [Google Scholar]
- 8.Mullie A, Verstringe P, Buylaert W, et al. Predictive value of Glasgow coma score for awakening after out-of-hospital cardiac arrest. Cerebral Resuscitation Study Group of the Belgian Society for Intensive Care. Lancet 1988;1:137–140. [PubMed] [Google Scholar]
- 9.Wijdicks EF, Hijdra A, Young GB, Bassetti CL, Wiebe S. Practice parameter: prediction of outcome in comatose survivors after cardiopulmonary resuscitation (an evidence-based review): report of the Quality Standards Subcommittee of the American Academy of Neurology. Neurology 2006;67:203–210. [DOI] [PubMed] [Google Scholar]
- 10.Yanagawa Y, Un-no Y, Sakamoto T, Okada Y. Cerebral density on CT immediately after a successful resuscitation of cardiopulmonary arrest correlates with outcome. Resuscitation 2005;64:97–101. [DOI] [PubMed] [Google Scholar]
- 11.Hjort N, Christensen S, Solling C, et al. Ischemic injury detected by diffusion imaging 11 minutes after stroke. Ann Neurol 2005;58:462–465. [DOI] [PubMed] [Google Scholar]
- 12.Pierpaoli C, Alger JR, Righini A, et al. High temporal resolution diffusion MRI of global cerebral ischemia and reperfusion. J Cereb Blood Flow Metab 1996;16:892–905. [DOI] [PubMed] [Google Scholar]
- 13.Dijkhuizen RM, Knollema S, van der Worp HB, et al. Dynamics of cerebral tissue injury and perfusion after temporary hypoxia-ischemia in the rat: evidence for region-specific sensitivity and delayed damage. Stroke 1998;29:695–704. [DOI] [PubMed] [Google Scholar]
- 14.Wijdicks EF, Campeau NG, Miller GM. MR imaging in comatose survivors of cardiac resuscitation. AJNR Am J Neuroradiol 2001;22:1561–1565. [PMC free article] [PubMed] [Google Scholar]
- 15.Arbelaez A, Castillo M, Mukherji SK. Diffusion-weighted MR imaging of global cerebral anoxia. AJNR Am J Neuroradiol 1999;20:999–1007. [PMC free article] [PubMed] [Google Scholar]
- 16.Chalela JA, Wolf RL, Maldjian JA, Kasner SE. MRI identification of early white matter injury in anoxic-ischemic encephalopathy. Neurology 2001;56:481–485. [DOI] [PubMed] [Google Scholar]
- 17.Sorensen AG, Wu O, Copen WA, et al. Human acute cerebral ischemia: detection of changes in water diffusion anisotropy by using MR imaging. Radiology 1999;212:785–792. [DOI] [PubMed] [Google Scholar]
- 18.Reese TG, Heid O, Weisskoff RM, Wedeen VJ. Reduction of eddy-current-induced distortion in diffusion MRI using a twice-refocused spin echo. Magn Reson Med 2003;49:177–182. [DOI] [PubMed] [Google Scholar]
- 19.Collins DL, Neelin P, Peters TM, Evans AC. Automatic 3D intersubject registration of MR volumetric data in standardized Talairach space. J Comput Assist Tomogr 1994;18:192–205. [PubMed] [Google Scholar]
- 20.UCLA Laboratory of Neuro Imaging. ICBM-452 T1 5th order polynomial warps atlas. Los Angeles, Calif: UCLA Laboratory of Neuro Imaging, 2008.
- 21.UCLA Laboratory of Neuro Imaging. ICBM probabilistic atlases. Los Angeles, Calif: UCLA Laboratory of Neuro Imaging, 2008.
- 22.Mazziotta J, Toga A, Evans A, et al. A probabilistic atlas and reference system for the human brain: International Consortium for Brain Mapping (ICBM). Philos Trans R Soc Lond B Biol Sci 2001;356:1293–1322. [DOI] [PMC free article] [PubMed] [Google Scholar]
- 23.Pierpaoli C, Jezzard P, Basser PJ, Barnett A. Diffusion tensor MR imaging of the human brain. Radiology 1996;201:637–648. [DOI] [PubMed] [Google Scholar]
- 24.Lowry R. VassarStats: Web site for statistical computation. http://faculty.vassar.edu/lowry/VassarStats.html. Accessed January 14, 2009.
- 25.Newcombe RG. Two-sided confidence intervals for the single proportion: comparison of seven methods. Stat Med 1998;17:857–872. [DOI] [PubMed] [Google Scholar]
- 26.Beck JR, Shultz EK. The use of relative operating characteristic (ROC) curves in test performance evaluation. Arch Pathol Lab Med 1986;110:13–20. [PubMed] [Google Scholar]
- 27.Li F, Silva MD, Liu KF, et al. Secondary decline in apparent diffusion coefficient and neurological outcomes after a short period of focal brain ischemia in rats. Ann Neurol 2000;48:236–244. [PubMed] [Google Scholar]
- 28.Li F, Silva MD, Sotak CH, Fisher M. Temporal evolution of ischemic injury evaluated with diffusion-, perfusion-, and T2-weighted MRI. Neurology 2000;54:689–696. [DOI] [PubMed] [Google Scholar]
- 29.Singhal AB, Topcuoglu MA, Koroshetz WJ. Diffusion MRI in three types of anoxic encephalopathy. J Neurol Sci 2002;196:37–40. [DOI] [PubMed] [Google Scholar]
- 30.Yenari MA, Onley D, Hedehus M, et al. Diffusion- and perfusion-weighted magnetic resonance imaging of focal cerebral ischemia and cortical spreading depression under conditions of mild hypothermia. Brain Res 2000;885:208–219. [DOI] [PubMed] [Google Scholar]
- 31.Piepgras A, Elste V, Frietsch T, Schmiedek P, Reith W, Schilling L. Effect of moderate hypothermia on experimental severe subarachnoid hemorrhage, as evaluated by apparent diffusion coefficient changes. Neurosurgery 2001;48:1128–1134. [DOI] [PubMed] [Google Scholar]
- 32.Ginsberg MD, Hedley-Whyte ET, Richardson EP Jr. Hypoxic-ischemic leukoencephalopathy in man. Arch Neurol 1976;33:5–14. [DOI] [PubMed] [Google Scholar]
- 33.Els T, Kassubek J, Kubalek R, Klisch J. Diffusion-weighted MRI during early global cerebral hypoxia: a predictor for clinical outcome? Acta Neurol Scand 2004;110:361–367. [DOI] [PubMed] [Google Scholar]
- 34.Greer DM. MRI in anoxic brain injury. Neurocrit Care 2004;1:213–215. [DOI] [PubMed] [Google Scholar]
- 35.Hald JK, Brunberg JA, Dublin AB, Wootton-Gorges SL. Delayed diffusion-weighted MR abnormality in a patient with an extensive acute cerebral hypoxic injury. Acta Radiol 2003;44:343–346. [DOI] [PubMed] [Google Scholar]
- 36.Hossmann KA, Fischer M, Bockhorst K, Hoehn-Berlage M. NMR imaging of the apparent diffusion coefficient (ADC) for the evaluation of metabolic suppression and recovery after prolonged cerebral ischemia. J Cereb Blood Flow Metab 1994;14:723–731. [DOI] [PubMed] [Google Scholar]