Abstract
We describe a major advance in scanning ion conductance microscopy: a new hopping mode that allows non-contact imaging of the complex surfaces of live cells with resolution better than 20 nm. The effectiveness of this novel technique was demonstrated by imaging networks of cultured rat hippocampal neurons and mechanosensory stereocilia of mouse cochlear hair cells. The technique allows studying nanoscale phenomena on the surface of live cells under physiological conditions.
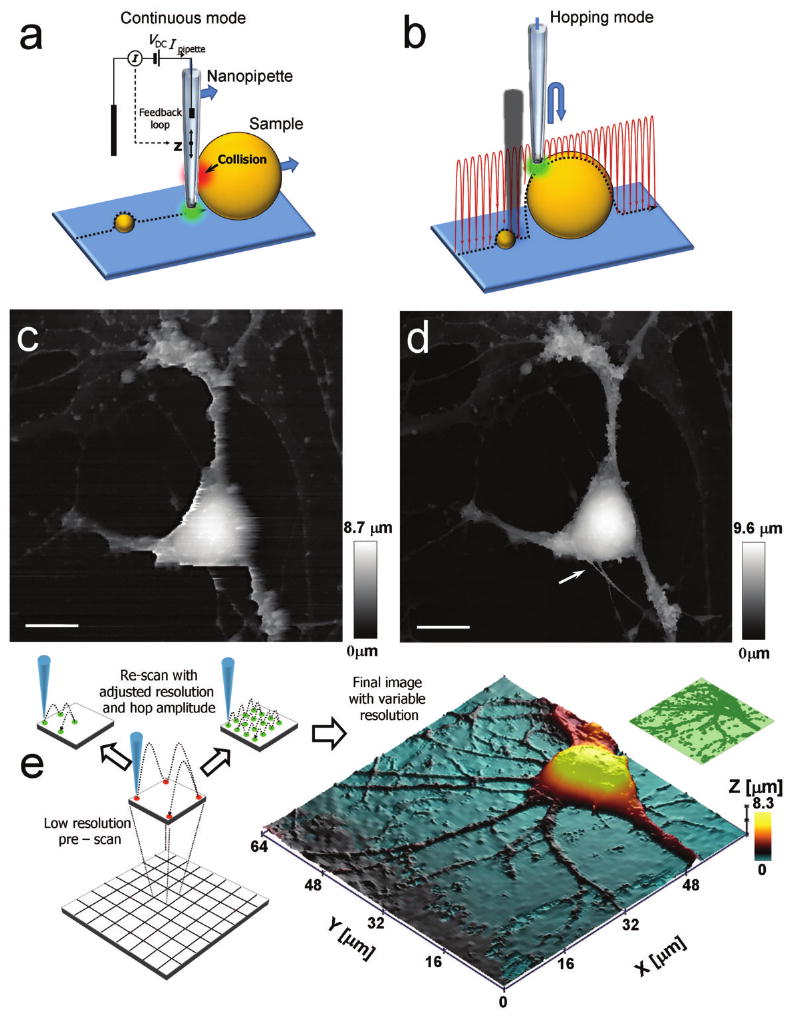
There is a great interest in developing methods to image live cells at nanoscale resolution. Scanning probe microscopy (SPM) is one approach to this problem and both atomic force microscopy (AFM) and scanning electrochemical microscopy (SECM) have been used to image live cells1,2. However, deformation of the soft and responsive cell by AFM cantilever, particularly when imaging eukaryotic cells, represents a substantial problem for AFM. SECM, in contrast, involves no physical contact with the sample but a true topographic imaging of the convoluted surface of living cells with nanoscale resolution has not been yet achieved. Scanning ion conductance microscopy (SICM)3 is another form of SPM, that allows imaging of the cell surface under physiological conditions without physical contact and with a resolution of 3-6 nm4,5. However, until now, SICM was restricted to imaging relatively flat surfaces, like all other SPM techniques. This is because when the probe encounters a vertical structure, it inevitably collides with the specimen (Fig. 1a). Here we report a novel mode of SICM that allows imaging of even the most convoluted surface structures at the nanoscale.
Figure 1.

Principles of adaptive hopping probe ion conductance microscopy (HPICM). (a) A typical problem for all continuous scanning probe techniques: a negative or very steep vertical slope causes the probe to collide with the sample. (b) The principle of HPICM: the pipette is withdrawn to a position that is well above the sample before approaching the surface. (c,d) Topographical images of the same fixed hippocampal neuron obtained first with hopping mode (d) and then with continuous left-to-right raster scan mode (c), using the same nanopipette. Both images took 30 min to acquire. An arrow in (d) points to the fine processes that have been damaged during raster scanning. Horizontal scale bars: 10 μm. Vertical bars indicate the height of the sample that is encoded in the grey scale. (e) Principles of adaptive HPCIM. The field of view is divided into equally-sized squares (bottom left). Before imaging each square, the roughness of the sample in this square is estimated at the corners (middle left). Very rough squares are imaged at high resolution, while smoother squares are imaged at low resolution (top left). The right panel is a three-dimensional topographical rendered image of a hippocampal pyramidal neuron that was acquired by the adaptive scanning algorithm within 15 min. Insert (top right) shows the resolution that was used for imaging this neuron (high resolution in dark green, low resolution in light green). Imaging of this sample without adaptive algorithm would take 45 minutes.
SICM is based on the phenomenon that the ion flow through a sharp fluid-filled nanopipette is partially occluded when the pipette approaches the surface of a cell3. In conventional SICM a nanopipette is mounted on a three-dimensional piezo and automatic feedback control moves the pipette up or down to keep the pipette current at a constant level (the set point), while the sample is scanned in X-Y directions. Thus, a pipette-sample separation, typically equal to the pipette's inner radius, is maintained during imaging. In our hopping probe ion conductance microscopy (HPICM), we no longer use continuous feedback. Instead, at each imaging point, the pipette approaches the sample from a starting position that is above any of the surface features (Fig. 1b). The reference current is measured while the pipette is well away from the surface. The pipette then approaches until the current is reduced by a predefined amount, usually 0.25-1%. The Z-position when the current achieves this reduction is recorded as the height of the sample at this imaging point. Typically, even at a 1% reduction of the current, the pipette is still at a distance of about one inner pipette radius from the surface. Therefore, the probe never touches the surface of the cell. The pipette is then withdrawn away from the surface and the sample moved laterally to determine the next imaging point. By continuously updating the reference current while the pipette is away from the surface, the method automatically adjusts for any slow drifts in the pipette current.
The benefits of HPICM are illustrated in Figure 1c,d, where the same sample was first imaged in the hopping mode (Fig. 1d) and then in the raster scan mode (Fig. 1c). This particular sample of fixed cultured hippocampal neurons lying flat was one of the few samples that were possible to image using both techniques. In contrast to HPICM, the raster scan SICM showed distortions in the cell body and axon and dendrites, and there are several lines in the image, where the automatic feedback was not able to maintain a constant probe-to-sample distance. At these lines, the fine processes that have been successfully visualized by HPICM (Fig. 1d, arrow) have been later destroyed during subsequent SICM imaging in Figure 1c.
In contrast to conventional raster scanning, HPICM has the additional advantage that the order of imaging pixels is not pre-determined. Therefore, the entire image was divided into equal-sized squares (Fig. 1e). Before imaging each square, the overall roughness (local height variation) of the sample was estimated by measuring the difference in heights at the corners of the square. If the sample within a square was rough, then the topography of this square was measured at high resolution. However, if the sample is relatively flat, the square was imaged with lower resolution (Fig. 1e, top). These adaptive changes of resolution significantly accelerate image acquisition without an apparent degradation of image quality. A further acceleration can be achieved by adjusting the amplitude of probe withdrawal within each square so that it is just above the pre-determined roughness of the sample within that square. The smaller the amplitude of withdrawal, the faster is the imaging speed. This adaptive imaging algorithm also addresses another common problem encountered by scanning probe techniques. In contrast to raster scan techniques, adaptive HPICM allows obtaining a rapid low resolution image of the sample to identify features of interest that will be subsequently imaged at high resolution.
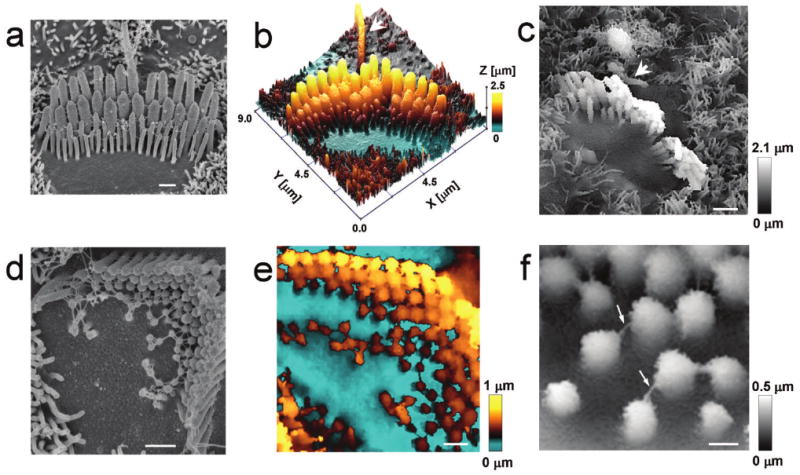
To determine the robustness of our technique, we imaged the mechanosensitive stereocilia of the auditory hair cells in the cultured organ of Corti explants. Several attempts have been made previously to image stereocilia with AFM6,7 or raster scan SICM (our unpublished data), but these studies never resolved even a gross structure of the stereocilia bundle. We used fixed specimens to compare images obtained with HPICM and a scanning electron microscope (SEM) (Fig. 2a-c and Supplementary Fig. 1 online). HPICM resolved stereocilia very well, including the shortest ones with a diameter of ∼100 nm or less (Fig. 2b,c and Supplementary Fig 1b,c online). A kinocilium (true cilium), present in these young postnatal auditory hair cells, was also visualised (Fig. 2c, arrowhead). To explore the resolution limits of HPICM, we imaged fine extracellular filaments (links) that interconnect stereocilia and are crucial for their mechanosensory function. These links could be as small as ∼8-10 nm in diameter8. In wild type hair cells, most of the links are inaccessible to the HPICM probe, because it approaches vertically to the bundle. Therefore, we used abnormally short, but still mechanosensitive, stereocilia of Shaker 2 mice9 (Fig. 2d-f). Our HPICM probe, with an inner diameter of ∼30 nm, was able to resolve these links that appeared as features of 16 ± 5 nm (n = 37) in diameter (Fig. 2f). A resolution better than the inner diameter of the probe is not surprising, because we reported previously a lateral resolution of 3-6 nm that was achieved with a 12.5 nm diameter SICM probe5. HPICM uses the same sensor as SICM and, therefore, shares the same physical principles that determine lateral and vertical resolution (see Supplementary Methods online for discussion on the resolution limitations). The apparent diameter of the same stereocilia links on SEM images was 22 ± 5 nm (n = 41). After subtraction of the platinum coat thickness (5 nm on both sides), we obtained an independent estimate of 12 ± 5 nm for the diameter of these links. The HPICM and SEM observations are therefore in excellent agreement, demonstrating the high resolution that is attainable.
Figure 2.

Visualisation of vertically protruding mechanosensitive stereocilia of the auditory hair cells. Images of the cultured organs of Corti from the same mouse were obtained with SEM (a,d) and HPICM (b,c,e,f). (a-c) Stereocilia of wild type inner hair cells. An arrowhead indicates a kinocilium (a true cilium) (d-f) Stereocilia of outer hair cells in young postnatal Shaker 2 mice with the extracellular filaments interconnecting stereocilia (arrows). In the HPICM images, the height of the sample is indicated by colour (b,e) or grey scale (c,f). All hair cells were approximately at the middle of the cochlea. Scale bars: a,d,e 500 nm; c 1 μm; f 200 nm.
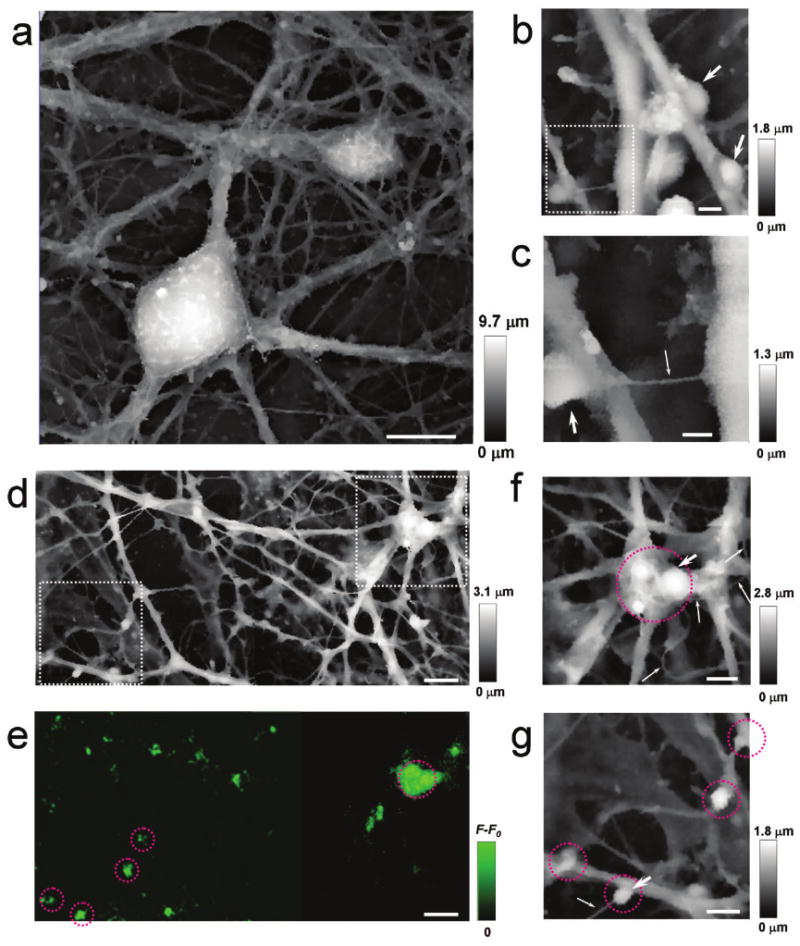
Movements of live cells impose additional requirements for rapid imaging. To test whether adaptive HPICM is fast enough to visualise live complex cellular structures, we examined live hippocampal neurons (Fig. 3a, Supplementary Fig. 2 online), which represent an unmet challenge for any scanning probe microscopy because of the complex three dimensional shapes that are formed by axons and dendrites. HPICM revealed structures that resembled synaptic boutons (Fig. 3b, c) as well as very fine (down to 50-60 nm in diameter) processes, tentatively identified as axons (Fig. 3b,c). We labelled this specimen with FM1-43, an activity-dependent marker of synaptic vesicles (see Supplementary Methods online), and recorded the topography and the FM1-43 fluorescence of the same sample. Whenever we observed a fluorescent signal, we were also able to identify varicosities in our images (Fig. 3d-g and Supplementary Fig. 3a-c online). The size and shape of these varicosities is consistent with the geometry expected of synaptic boutons. It is thus clear that the speed of adaptive HPICM is sufficient to generate a “snapshot” of axons, dendrites and boutons in these complex live networks in spite of relatively slow (on a time scale of tens of minutes) re-arrangement and migration of the cells that do occur in this preparation. Faster dynamics can be followed by imaging of a smaller area and/or decreasing the resolution. Further developments should improve the temporal resolution of HPICM (see Supplementary Methods online).
Figure 3.

HPICM images of live hippocampal neurons. (a) An image of a large area of the neural network. (b) Potential synaptic boutons (arrows). (c) A higher resolution image of the dotted region in (b) with another possible bouton. The process with a diameter of 50 nm, marked by a fine arrow in c, is likely to be an axon. HPICM (d) and fluorescence (e) images of the same neuronal network area that has been stained with a live marker of synaptic activity, FM1-43. (f) A high resolution image of the dotted area in the top right corner of (d). Potential synaptic boutons are circled in red or marked with a large arrow. Fine processes, probably axons, are marked by thin arrows. (g) A high resolution image of the dotted area in the bottom left-hand corner of (d). Scale bars: a 10 μm; b 1 μm; c 500 nm.; d & e 5 μm; f & g 2 μm.
HPICM is conceptually similar to “force mapping” in AFM10 or “picking mode” in SECM11. However, “force mapping” AFM still operates by detecting a deflection of a cantilever, which implies a mechanical force applied to a cell. External force is not acceptable in most physiologically relevant experiments with soft and often mechanosensitive live eukaryotic cells. The picking mode SECM does not involve physical interaction between the probe and sample, but the relatively large insulation of SECM nanoelectrode12 and its larger resistance, compared to SICM nanopipette of the same effective diameter, make a topographic nanoscale imaging of convoluted cell surfaces with SECM very challenging and yet unresolved task.
The ability of HPICM to image complex biological samples at a nanoscale resolution can be combined with fluorescent imaging13 and/or other functional tests, such as local activation of individual receptors (ion channels)14 or single-channel patch-clamp recordings15. Thus, our novel imaging technique should enable structure-function studies to be performed at the surface of complex living cells with nanometre precision.
Supplementary Material
Acknowledgments
This study was supported by the Biotechnology and Biological Sciences Research Council and Medical Research Council to YEK and (BB/D01817X/1) to GWJM and TGS and by the National Organization for Hearing Research Foundation, the Kentucky Science and Engineering Foundation (#KSEF-148-502-07-215), and NIDCD/NIH (DC008861) (to GIF).
Footnotes
Competing Interest Statement: The authors declare competing financial interests.
References
- 1.Dufrene YF. Nat Rev Microbiol. 2008;6:674–680. doi: 10.1038/nrmicro1948. [DOI] [PubMed] [Google Scholar]
- 2.Sun P, et al. Proc Natl Acad Sci U S A. 2008;105:443–448. doi: 10.1073/pnas.0711075105. [DOI] [PMC free article] [PubMed] [Google Scholar]
- 3.Hansma PK, Drake B, Marti O, Gould SA, Prater CB. Science. 1989;243:641–643. doi: 10.1126/science.2464851. [DOI] [PubMed] [Google Scholar]
- 4.Korchev YE, Bashford CL, Milovanovic M, Vodyanoy I, Lab MJ. Biophys J. 1997;73:653–658. doi: 10.1016/S0006-3495(97)78100-1. [DOI] [PMC free article] [PubMed] [Google Scholar]
- 5.Shevchuk AI, et al. Angew Chem Int Ed Engl. 2006;45:2212–2216. doi: 10.1002/anie.200503915. [DOI] [PubMed] [Google Scholar]
- 6.Langer MG, et al. Ultramicroscopy. 2000;82:269–278. doi: 10.1016/s0304-3991(99)00136-9. [DOI] [PubMed] [Google Scholar]
- 7.Langer MG, et al. Biophys J. 2001;80:2608–2621. doi: 10.1016/s0006-3495(01)76231-5. [DOI] [PMC free article] [PubMed] [Google Scholar]
- 8.Kachar B, Parakkal M, Kurc M, Zhao Y, Gillespie PG. Proc Natl Acad Sci U S A. 2000;97:13336–13341. doi: 10.1073/pnas.97.24.13336. [DOI] [PMC free article] [PubMed] [Google Scholar]
- 9.Stepanyan R, Belyantseva IA, Griffith AJ, Friedman TB, Frolenkov GI. J Physiol. 2006;576:801–808. doi: 10.1113/jphysiol.2006.118547. [DOI] [PMC free article] [PubMed] [Google Scholar]
- 10.van der Werf KO, et al. Appl Phys Lett. 1994;65:1195–1197. [Google Scholar]
- 11.Borgwarth K, Ebling DG, Heinze J. Berichte der Bunsen-Gesellschaft-Physical Chemistry Chemical Physics. 1994;98:1317–1321. [Google Scholar]
- 12.Sun P, Mirkin MV. Anal Chem. 2006;78:6526–6534. doi: 10.1021/ac060924q. [DOI] [PubMed] [Google Scholar]
- 13.Gorelik J, et al. Proc Natl Acad Sci U S A. 2002;99:16018–16023. doi: 10.1073/pnas.252458399. [DOI] [PMC free article] [PubMed] [Google Scholar]
- 14.Korchev YE, Negulyaev YA, Edwards CR, Vodyanoy I, Lab MJ. Nat Cell Biol. 2000;2:616–619. doi: 10.1038/35023563. [DOI] [PubMed] [Google Scholar]
- 15.Gorelik J. Biophys J. 2002;83:3296–3303. doi: 10.1016/S0006-3495(02)75330-7. [DOI] [PMC free article] [PubMed] [Google Scholar]
Associated Data
This section collects any data citations, data availability statements, or supplementary materials included in this article.


