Abstract
The goal of this research is to develop a 3D finite element (FE) model of a left ventricular assist device (LVAD) to predict stresses in the blood sac. The hyperelastic stress-strain curves for the segmented poly(ether polyurethane urea) blood sac were determined in both tension and compression using a servo-hydraulic testing system at various strain rates. Over the range of strain rates studied, the sac was not strain rate sensitive, however the material response was different for tension versus compression. The experimental tension and compression properties were used in a FE model that consisted of the pusher plate, blood sac and pump case. A quasi-static analysis was used to allow for nonlinearities due to contact and material deformation. The 3D FE model showed that blood sac stresses are not adversely affected by the location of the inlet and outlet ports of the device and that over the systolic ejection phase of the simulation the prediction of blood sac stresses from the full 3D model and an axisymmetric model are the same. Minimizing stresses in the blood sac will increase the longevity of the blood sac in vivo.
Introduction
Mechanical circulatory support is now commonplace in most hospitals performing open heart surgery. Three pulsatile LVAD systems have been in clinical trials for destination therapy and numerous axial and centrifugal pumps are in, or nearing, clinical trials. To date more than 7,000 pulsatile assist devices and several hundred continuous flow devices have been implanted for various indications1–3. There is still controversy surrounding the need for pulsatile flow4,5. There are several studies indicating morphologic and functional changes in the vascular system associated with continuous flow and reduced pulsatility. We expect there will be a need for pulsatile devices with improved performance well into the future.
There are three major problem areas in currently available circulatory support devices: infection, durability and thrombus formation. Incidence of infection is markedly reduced in completely implanted systems that do not employ percutaneous leads like the Penn State LionHeart®6 LVAD and AbioCor Total Artificial Heart (TAH) 7. Pulsatile devices such as the Penn State LionHeart® have demonstrated durability in excess of two years in vivo, and there is evidence (including unpublished in vitro durability LionHeart® data) that five year durability in these systems is achievable with current technologies8. Thrombus formation and subsequent embolization is still the major hurdle in mechanical circulatory support devices of all types9. With the need for smaller devices for women and smaller men, the challenge of preventing thrombus formation is exacerbated just as it is in small vascular grafts. Continuous flow devices such as axial flow or centrifugal pumps are an alternative for smaller patients requiring only a ventricular assist device. To date, however, these devices have failed to show a reduced rate of thrombus formation or embolization10. In addition, these devices do not appear to be readily usable as a total artificial heart due to the difficulty in cardiac output and balance control. A reduction in device thrombus formation on the microscopic and macroscopic level in the Penn State family of LVADs would be of benefit to patients. To this end we employ sophisticated computational fluid dynamic studies as well as experimental fluid dynamic studies to improve the blood flow patterns in the devices11,12.
The second most important problem with current pulsatile devices is device durability. A major component of this is related to the blood sac durability. Sac durability is a function of the material and the stresses imposed upon it. The goal of this work is to utilize FE modeling as a means to predict and minimize stresses in biomaterials, so that the durability of reduced-size devices is not adversely affected by pump scaling.
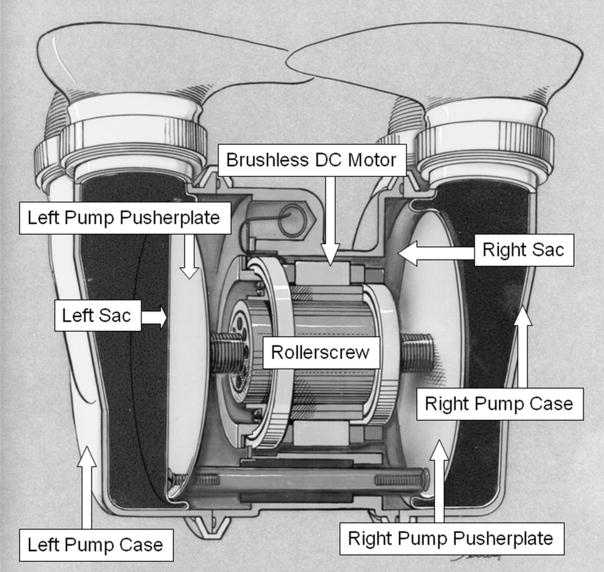
Because circulatory devices must beat for approximately 200 × 106 cycles during a 5 year lifetime, the materials employed in a pulsatile-type blood pump must have very good fatigue properties. Few materials are capable of such a workload and possess the necessary mechanical properties. For this reason, polyurethane materials have been the material of choice in these devices. Fortunately, polyurethane materials have reasonably good blood-compatibility, with a number of interesting surface chemistries available in this class of materials 13. The Penn State TAH and LionHeart® use a segmented poly(ether polyurethane urea) (SPEUU) seamless sac with a thickness ranging from approximately 0.38 to 0.64 mm (Figure 1).
Figure 1.
A cross-section of the Penn State total artificial heart showing the major components of the system and sac motion. The pulsatile blood pump consists of a small brushless DC motor driving a rollerscrew actuator. The rollerscrew shaft is coupled to a single pusherplate when configured as a LVAD, or to two pusherplates when configured as a total artificial heart. During ejection or systolic phase, the pusherplate compresses the blood sac that is mounted in a titanium pump case and blood flows out of the outlet port. During filling the pusherplate retracts and blood fills the pump under its own pressure.
Finite element modeling has been used to determine the mechanical environment in the blood sac and to determine the effects of various design parameters on the sac stresses during the systolic ejection phase of the pump14. Previous 2D axisymmetric modeling simulations show that regions of the blood sac near the pusher plate corner radius are under significant compression. However, material property data has previously been collected solely based on tensile tests. Additionally, previous modeling attempts are limited by assuming an axisymmetric model which did not include the inlet and outlet ports14 It is not known if the stress/strain distribution around the port areas is significantly different than the remainder of the sac. Therefore, a 3D FE model is presented to predict blood sac stresses, and compared against the 2D model. The goals of this study were to 1) document hyperelastic stress-strain data for physiological loading regimes of the SPEUU blood sac in tension and compression, 2) determine if the 3D model stresses vary considerably from the 2D model, and 3) determine if the stresses are greater near the location of the inlet and outlet ports. Successful completion of these goals will provide a FE model that can be used in the future to evaluate the effect of blood sac corner radius, convolution gap, blood sac taper, and pusherplate corner radius on sac stresses as well as to determine the scalability of the pump.
Methods
Mechanical Testing: Tensile tests
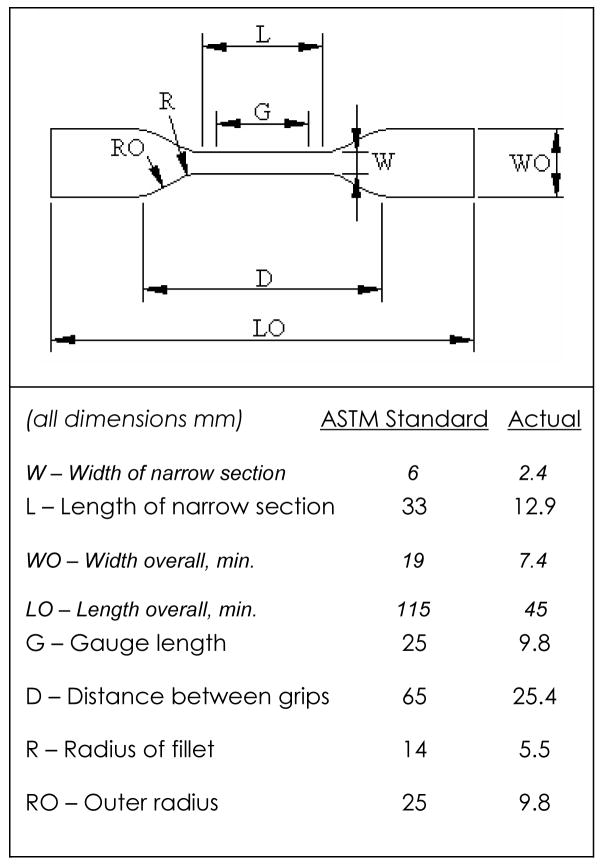
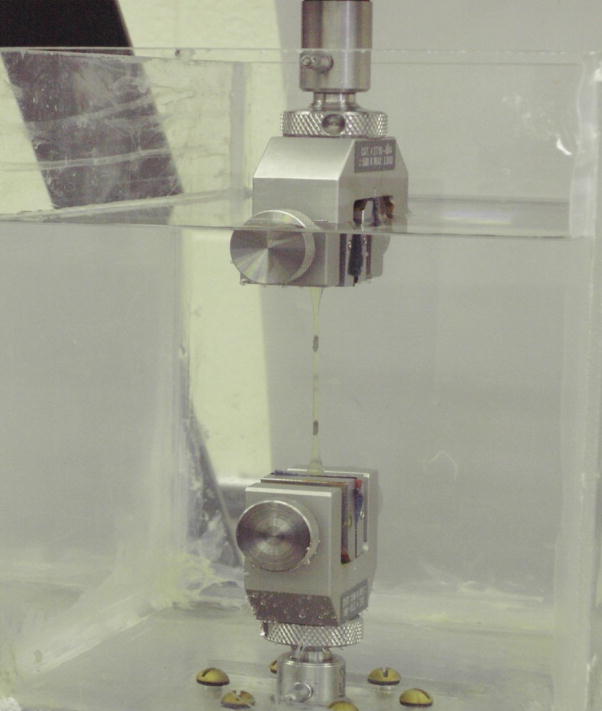
Tensile tests were conducted on 10 blood sacs according to ASTM D638-01 Standard Test Method for Tensile Properties of Plastics. Since ASTM D1708-02a recommends that all dimensions be directly scaled when using smaller specimens, dimensions were scaled by a factor of 45/115 (the ratio of overall length of blood sac samples to the overall length stated in D638 for Type IV specimen) (Figure 2). Digital calipers were used to measure the width and thickness of the narrow section of the samples with an accuracy of 10 μm. Prior to testing, the specimens were placed in a non-sterile phosphate buffered isotonic saline to simulate in vivo conditions (0.9% w/v concentration, pH=7.2) (Biosource International, Inc., Camarillo, Ca) for at least 40 hours prior to testing. The temperature of the solution was held at a constant 37° C using a water bath (Isotemp 210, Fisher Scientific). Marks used for measuring strain were placed 9.8 mm apart on the narrow section of the specimens using a black marker and machined template (Figure 3). A non-contacting Type 3 (PCI bus) video extensometer (Instron Corp, Canton, MA) measured specimen deformation. All tests were conducted on a hydraulic uniaxial testing system (Model #8872, Instron Corp., Canton, MA). Samples had a tare load of 0.1N applied prior to being pulled to failure at a strain rate of 70%/min or 500%/min. Load and displacement were recorded during the test.
Figure 2.
ASTM D638 Type IV specimen dimensions.
Figure 3.
Experimental set-up for testing SPEUU blood sac in tension.
Mechanical Testing: Compression tests
Similar to tensile tests, compression tests were conducted using a servo-hydraulic material testing system at 70%/min with 10 samples. For compression studies, 6 millimeter diameter cylindrical plugs were removed from blood sacs, presoaked in saline as noted above, and placed between 2 frictionless compression platens. A tare load of −0.1N (0.1 N compression) was applied on the cylindrical samples prior to loading. Cross-sectional area was used to calculate stresses and initial thickness was measured and used for calculating strains.
Mechanical Testing: Data Analysis
Each mechanical test data set was fit to a second order polynomial using a least squares regression. The coefficients of the polynomial were extracted and compared using an unpaired t-test between the different strain rate tests. Significance was set at 0.05.
Finite Element Modeling
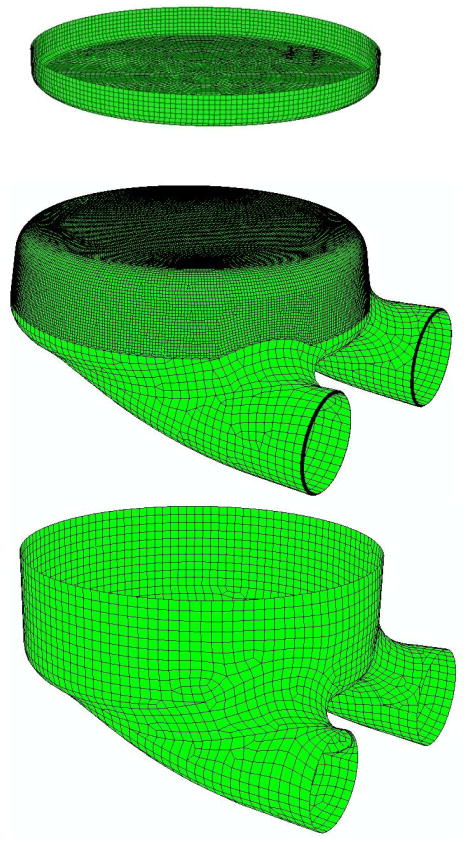
The commercial software package ABAQUS (HKS Inc., Pawtucket, RI) was used to solve a finite element (FE) model of the pusher plate, blood sac and pump case (Figure 4). The pusherplate and pump case were treated as rigid and constructed with planar elements. The blood sac was constructed of 8-noded continuum elements (Figure 4), with 10 elements through the thickness of the sac. The sac was treated as homogeneous, isotropic, and hyperelastic using tension and compression data gathered above on blood sacs. The mesh was refined 3 times to determine convergence. Convergence was judged by less than a 1% change in peak principal stress.
Figure 4.
Exploded view finite element model of the rigid pusher plate, the blood sac and the rigid pump case. Note the increase in element density in the rolling region of the blood sac.
The Mooney-Rivlin model was used for hyperelasticity. Uniaxial test data in both tension and compression was input into the finite element input file. The finite element code then curve-fit the data and produced the constants used in the equation. The form of the Mooney-Rivlin strain energy potential is
where U is the strain energy per unit of reference volume;C10, C01, and D1 are material Ī1 and Ī2 are the first and second deviatoric strain invariants defined as
where the deviatoric stretches ; J is the total volume ratio; J el is the elastic volume ratio, and λi are the principal stretches. The initial shear modulus and bulk modulus are given by .
For our test data, D1 =0.00, C10 =102.52 and C01 =132.75.
The simulation utilized a pump case without any taper, as previous 2D analysis confirmed that tapering the pump case dramatically increased stresses in the blood sac14. A radius of curvature of 4.76 mm (3/16th of an inch) was used for the blood sac and the thickness of the sac was 0.381 mm (0.015 inches). Based on a complex 3D geometry, a small number of non-hexahedral elements were necessary around regions of highly curved geometry (Figure 4). The pumpcase consisted for 23 3-noded elements and 3652 4-noded elements. The pusherplate consisted of 240 3-noded elements and 5330 4-noded elements. The blood sac consisted of 507097 hexahedral elements (8-noded) and 300 6-noded triangular prism elements. The 3D FE model was run in two steps, with contact between the pusher plate and blood sac being treated as frictionless as was contact between the blood sac and pump case. During the first non-linear quasi-static step, an internal pressure of 100 mm Hg was applied evenly to the inside of the blood sac. Displacements and rotations were constrained to zero for the pusher plate and the pump case during the first step which pressurized the blood sac. While maintaining a constant internal pressure of 100 mm Hg, the second step simulated the systolic ejection phase during which the pusher plate was displaced to compress the blood sac. During the second step, displacements of the rigid case were constrained to zero, and the pusherplate displacement was applied over 50 increments. No specific boundary conditions were applied to the blood sac during systolic ejection. The deformations of the blood sac were controlled by contact conditions with the case and pusherplate. A quasi-static analysis was used allowing for nonlinearities due to contact and material deformation. The model was run on a Sun Ultra 80 with 4 processors. The flow of blood in and out of the ports was not simulated.
Results
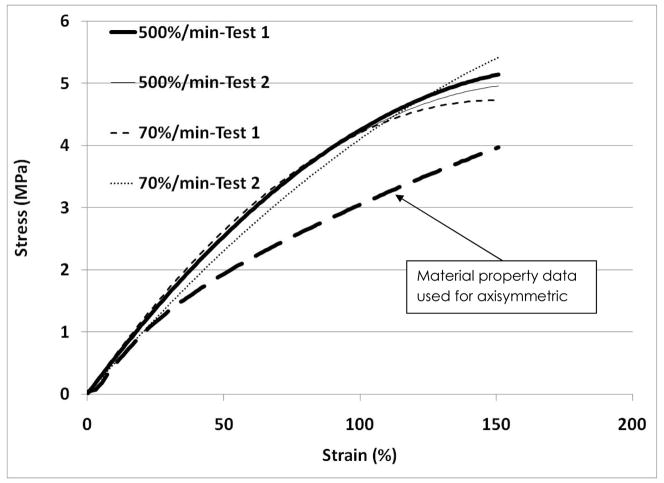
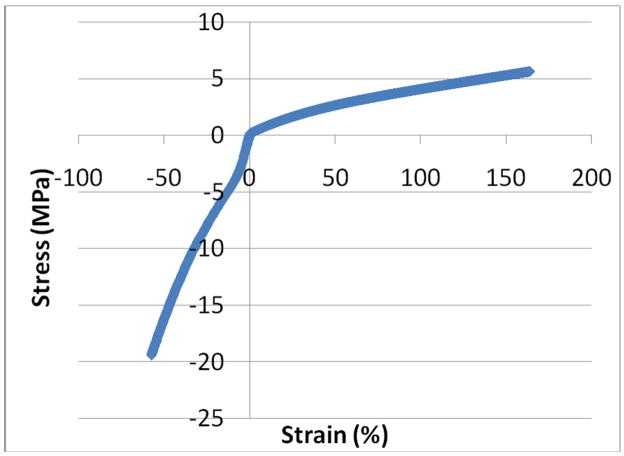
The tensile stress-strain data for the 70% strain/min tests are very similar to the data for the 500% strain/min tests suggesting that the SPEUU is not strain rate dependent over this range (Figure 5). The stress-strain curves exhibit similar shapes and values to the stress-strain curve published in a previous TAH study 14. All of the tensile tests were curve fit with a best-fit second order polynomial with an R2 of 0.97 or higher. An unpaired t-test comparing the coefficients for the best-fit polynomials for the two different strain rates showed no significant differences (p=0.78). The average best-fit polynomial for the 70%/min tests was −4E−05x2+0.039x+0.441 and −6E−05x2+0.041x+0.586 for the 500%/min tests. The behavior of the blood sac in compression was different than in tension for the tested strain rate and environmental conditions (Figure 6). The SPEUU blood sac was much more compliant in tension compared to compression.
Figure 5.
Representative stress-strain curves for 2 different samples tested at 70%/min and 2 different samples tested at 500%/min for the SPEUU blood sac. The original stress-strain data used in the previous axisymmetric model is plotted.
Figure 6.
Representative stress-strain curve for the SPEUU blood sac in tension and compression.
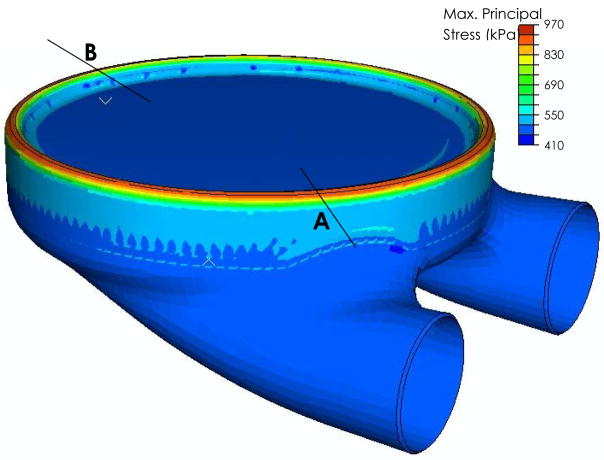
The finite element simulation converged with an average element size in the bending region of 750 μm by 750 μm, and 3mm by 3mm in the nonbending region (Figure 4). The largest stresses and strains in the blood sac were at 6.5 mm (0.256 inches) of compression (or pusher plate displacement). The stresses are continuous around the blood sac, without local increases present near the location of the ports. No differences in stresses or strains were noted for a cross-section through the port (location A on Figure 7) compared to a region away from the port (location B on Figure 7). The addition of the ports to the blood sac stress analysis does not appear to alter the maximum stresses or strains in the bending region of the sac.
Figure 7.
Maximum principal stresses in the blood sac at 0.256 inches of pusherplate displacement (6.5 mm).
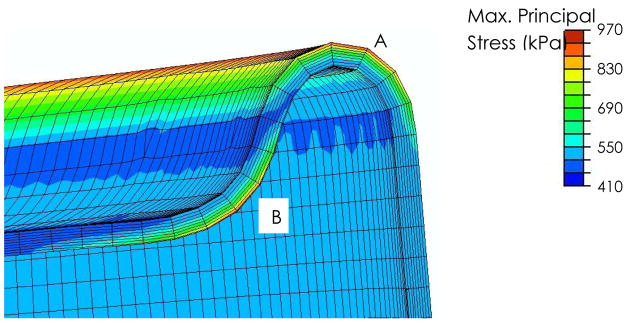
Principal stresses were similar in the rolling region of the blood sac, as well as the region of the blood sac bending around the pusherplate (Figure 8) with values of approximately 900kPa. In contrast, the corresponding areas of the blood sac under compression reached stresses of ~450 kPa
Figure 8.
A close-up view of the bending region of the blood sac where peak maximum principal stresses were found. Note that locations A and B have similar stress magnitudes. The sac stresses are usually slightly smaller in the region of the blood sac that bends around the pusher plate (location B), compared to the rolling region between the blood sac and the pump case (location A).
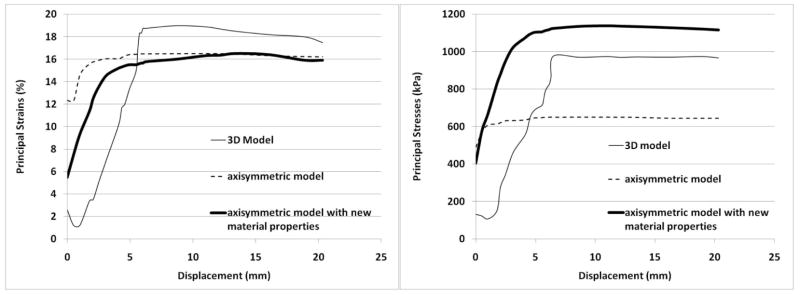
The maximum principal stress and maximum principal strains were documented throughout the ejection stroke (Figure 9). Two major differences were noted between the earlier axisymmetric model11 and the current 3D model. The first difference is the stress and strain values at the beginning of the ejection stroke. The previous axisymmetric model predicted strains of 12% and stresses of 460 kPa (70 psi) to be present after the first step which applies an internal pressure of 100 mm Hg (Figure 9). These values increased slightly to a plateau of 16% and 655 kPa (94 psi). In the 3D model strains of only 2.5%, and stresses of 132 kPa (19.2 psi) were noted at the beginning of the ejection stroke. These values are much smaller than previously predicted with the axisymmetric model. However, both the axisymmetric and 3D models predict that over much of the ejection stroke the peak principal strains are constant (Figure 9). The second difference between the models is that the 3D model predicts a slight decrease in peak principal stress and strain values immediately following the initiation of pusher plate displacement. This was not seen in the axisymmetric model (for the same pump case design and radius blood sac).
Figure 9.
A) Maximum principal strain in the blood sac. B) Maximum principal stress in the blood sac.
For a better comparison between the axisymmetric model and the 3D model, the old axisymmetric model was run with the new tension and compression hyperelastic material properties determined above. A comparison of the principal strains in the blood sac between the axisymmetric model and the 3D model showed agreement to within 3% over the entire ejection stroke. The principal stresses in the axisymmetric blood sac and the 3D blood sac were within 13% throughout the entire ejection stroke, and followed similar trends with an increasing stress through the first 30% of ejection, followed by a relative steady constant stress.
Discussion
The study successfully measured the hyperelastic stress-strain material response for physiological loading regimes of the segmented polyurethane urea blood sac in tension and compression. While the response was different in tension versus compression, no change in the tensile response was seen over the strain rates studied. Limited data is available for the material properties of the SPEUU. In a study on the effects of sterilization, Abraham et al., 1997 documented ultimate stresses and strains, which are much higher than the values seen in this simulation15. Furthermore, the authors document that both hysteresis and residual strain increased after sterilization15. Others have shown that strain rate (0–46%/s) is directly proportional to in vivo degradation of polyurethane specimens, however, strain magnitude had no effect on degradation16. There have been limited studies of long term mechanical cycling of SPEUU in vivo. Both Liu et al., 2000, and Babu et al. 2004, found an increase in molecular weight due to implantation, independent of location in flexing or non-flexing regions. Babu et al., also measured an increase in tensile strength, and decrease in elongation at break; Liu et. al., found similar changes but without statistical significance 17,18. Therefore, it may be expected that increasing stiffness due to blood exposure may lead to increased stresses. Little data is available that has effectively determined the fatigue behavior of segmented polyurethane urea in a biological environment. One study using the same ASTM test setup tested SPEUU to 5 million cycles at 60% strain in synthetic blood solution13. They noted initial stresses final stresses of about 1MPa. While these stress levels are close to what our FE modeling predicts, the strains are 3 times as large as our FE model shows. It can be estimated that the blood sac will experience 50 million cycles a year, hence, additional accelerated fatigue testing needs to be completed.
Previous compression testing of other polymers, such as polyurea, have shown that over strain rates of 9.6%/min to 54000000%/min there are significant variations in the stress-strain curves19. Thus, for our small range of rates studied, it is not surprising to find no significant differences in the response of the SPEUU blood sac. Additionally, it should be noted the tensile response of polyurea from Roland et al. 2007 and the SPEUU in the current study vary dramatically20. For comparable strain rates, at a strain of 120%, the polyurea reached stresses of 25 MPa, whereas the SPEUU reached only 4.5 MPa, clearly indicating differences between the two polymers. The compression data of Yi et al., 2006 on polyurethane and Sarva et al., 2007 on polyurea compares well with the current compression data on the SPEUU19,21. At 70% compressive strain, the current study documented a stress of approximately 20MPa in the SPEUU, whereas Yi et. al. and Sarva et al., documents ~14–15MPa. Overall the compression data on the SPEUU matches well with other polymers and previously published data whereas the tensile response of the SPEUU appears to be much more compliant.
A 3D model of the blood sac, pusherplate and pump case was created incorporating the material response in tension and compression. Despite the addition of the new material behavior incorporated into the 3D model, there is strong agreement in the peak principal strains between the axisymmetric and 3D model over the ejection stroke. While the axisymmetric model and the 3D model both use a hyperelastic formulation for the material property definition of the blood sac, the 3D model uses the values collected as described above for tension and compression, likely accounting for some difference in absolute values of stress. It is important to note that all of the stresses and strains measured are much smaller than the ultimate stress or strain for the SPEUU blood sac (tensile strength ~41,000 kPa and ultimate elongation ~850%). We can conclude from Figure 9 that maximum strains (~18%) in the blood sac are achieved at approximately 30% of total ejection, or 7mm. Since the pump ejects in about 250 milliseconds, the blood sac would likely be strained to 18% in 75 milliseconds, for a strain rate of 240%/second, which is quite different than the rates conducted. Due to mechanical limitations on the hydraulic testing system and data collection limitations on the video strain measurements, faster strain rates were not achievable in the current study. Future efforts are aimed at both fatigue studies and faster strain rate tests.
The 3D model shows comparable results to the simple axisymmetric 2D model indicating that in the current position, the ports do not appreciably increase the blood sac stresses or strains. Thus parametric work to evaluate the effect of blood sac corner radius, convolution gap, blood sac taper, and pusherplate corner radius on sac stresses as well as to determine the scalability of the pump may be carried out with an axisymmetric model versus the more complex, time consuming 3D model. Future directions include an eigenvalue buckling analysis on the sac to predict instability with analysis of buckling mode shapes. The current sac taper is 4.7°. Tapers of 2°, 4°, 6°, and 8° will be evaluated for their effect on sac stresses. Increasing the blood sac corner radius in previous designs did not reduce the peak strains significantly, but did reduce the strains in the early part of the systolic stroke14. We therefore plan to investigate a larger sac corner radius as the simulations have also shown that stresses in the sac region near the pusherplate corner radius are significant. We propose to assess an increase in the edge radius through the FE simulations. It is likely that key design features that do not have to do with inlet and outlet ports could be assessed with an axisymmetric model.
The usage of LVADs is increasing and more patients are surviving to the point of device wear out. Thus, increased durability of LVADs is necessary for more wide spread usage. If pulsatile devices are to be a part of the future of LVAD therapies, device durability must exceed five years with ten years being a goal. Careful design optimization using FE analysis is a vital part of accomplishing this goal. We have demonstrated that the SPEUU blood sac has distinct hyperelastic stress-strain curves in tension and compression and does not appear to be strain rate dependent over the range of strain rates studied. Furthermore, we have shown through 3D FE modeling that the current location of the inlet and outlet ports does not alter the blood sac stresses.
Acknowledgments
This research was supported by HIN grant R01 HL060276-08 New Methods for the Design of Small Blood Pumps.
Footnotes
Publisher's Disclaimer: This is a PDF file of an unedited manuscript that has been accepted for publication. As a service to our customers we are providing this early version of the manuscript. The manuscript will undergo copyediting, typesetting, and review of the resulting proof before it is published in its final citable form. Please note that during the production process errors may be discovered which could affect the content, and all legal disclaimers that apply to the journal pertain.
References
- 1.Heartmate LVAS Worldwide Registry, December 2002.
- 2.Thoratec VAD Worldwide Registry, December 2002.
- 3.WorldHeart Corporation Third Quarter 2002 Report November 11, 2002.
- 4.Murkin JM, Martzke JS, Buchan AM, Bentley C, Wong CJ. A randomized study of the influence of perfusion technique and pH management strategy in 316 patients undergoing coronary artery bypass surgery. II. Neurologic and cognitive outcomes. J Thorac Cardiovasc Surg. 1995;110(2):349–62. doi: 10.1016/S0022-5223(95)70230-X. [DOI] [PubMed] [Google Scholar]
- 5.Sezai A, Shiono M, Nakata K, et al. Effects of pulsatile CPB on interleukin-8 and endothelin-1 levels. Artif Organs. 2005;29(9):708–13. doi: 10.1111/j.1525-1594.2005.29112.x. [DOI] [PubMed] [Google Scholar]
- 6.Pae WE, Connell JM, Adelowo A, et al. Does total implantability reduce infection with the use of a left ventricular assist device? The LionHeart experience in Europe. Journal of Heart & Lung Transplantation. 2007;26(3):219–29. doi: 10.1016/j.healun.2006.12.007. [DOI] [PubMed] [Google Scholar]
- 7.Dowling RD, Gray LA, Jr, Etoch SW, et al. Initial experience with the AbioCor implantable replacement heart system. Journal of Thoracic & Cardiovascular Surgery. 2004;127(1):131–41. doi: 10.1016/j.jtcvs.2003.07.023. [DOI] [PubMed] [Google Scholar]
- 8.McCarthy PM, Portner PM, Tobler HG, Starnes VA, Ramasamy N, Oyer PE. Clinical experience with the Novacor ventricular assist system. Bridge to transplantation and the transition to permanent application. Journal of Thoracic & Cardiovascular Surgery. 1991;102(4):578–86. discussion 86–7. [PubMed] [Google Scholar]
- 9.Pasque MK, Rogers JG. Adverse events in the use of HeartMate vented electric and Novacor left ventricular assist devices: comparing apples and oranges. Journal of Thoracic & Cardiovascular Surgery. 2002;124(6):1063–7. doi: 10.1067/mtc.2002.123520. [DOI] [PubMed] [Google Scholar]
- 10.Stevenson LW, Kormos RL, Bourge RC, et al. Mechanical cardiac support 2000: current applications and future trial design. June 15–16, 2000 Bethesda, Maryland. Journal of the American College of Cardiology. 2001;37(1):340–70. doi: 10.1016/s0735-1097(00)01099-8. [DOI] [PubMed] [Google Scholar]
- 11.Medvitz RB, Kreider JW, Manning KB, Fontaine AA, Deutsch S, Paterson EG. Development and Validation of a Computational Fluid Dynamics Methodology for Simulation of Pulsatile Left Ventricular Assist Devices. ASAIO J. 2007;53(2):122–131. doi: 10.1097/MAT.0b013e31802f37dd. [DOI] [PubMed] [Google Scholar]
- 12.Hochareon P, Manning KB, Fontaine AA, Tarbell JM, Deutsch S. A fluid dynamic analysis of the 50cc Penn State Artificial Heart under physiological operating conditions using particle image velocimetry. ASME Journal of Biomechanical Engineering. 2004;126:585–593. doi: 10.1115/1.1798056. [DOI] [PubMed] [Google Scholar]
- 13.Hayahi K. Fatigue Properties of Segmented Polyether Polyurethanes for Cardiovascular Application. In: Yokobori AT, Kambic HE, editors. Biomaterials Mechanical Properties ASTM STP 1173. American Society for Testing Materials; Philadelphia: 1994. pp. 9–19. [Google Scholar]
- 14.Haut TL, Weiss B, Rosenberg G, Jacobs CR. Finite Element Analysis of Stresses Developed in Blood Sacs of a Pusherplate Blood Pump Computer Methods. Biomechanics and Bioengineering. 2003;6(1):7–15. doi: 10.1080/1025584031000078943. [DOI] [PubMed] [Google Scholar]
- 15.Abrahm GA, Fromtini PM, Cuadrado TR. Physical and Mechanical Behavior of Sterilized Biomedical Segmented Polyurethanes. J Appl Polym Sci. 1997;65:1193–1203. [Google Scholar]
- 16.Wiggins MJ, Anderson JM, Hiltner A. Effect of strain and strain rate on fatigue-accelerated biodegradation of polyurethane. J Biomed Mater Res. 2003;66A:463–475. doi: 10.1002/jbm.a.10584. [DOI] [PubMed] [Google Scholar]
- 17.Liu Q, Runt J, Felder G, Rosenberg G, Snyder AJ, Weiss WJ, Lewis J, Werley T. In vivo and in vitro stability of modified Poly(urethaneurea) blood sacs. Journal of Biomaterials Applications. 2000;14:349–366. doi: 10.1177/088532820001400403. [DOI] [PubMed] [Google Scholar]
- 18.Babu R, Gill R, Farrar D. Biostability of Thoralon Left Ventricular Assist Device Blood Pumping Sacs After Long Term Clinical Use. ASAIO Journal. 2004;50:479–484. doi: 10.1097/01.mat.0000136511.99220.8b. [DOI] [PubMed] [Google Scholar]
- 19.Sarva SS, Deschanel S, Boyce MC, Chen W. Stress-strain behavior of a polyurea and a polyurethane from low to high strain rates. Polymer. 2007:2208–13. [Google Scholar]
- 20.Roland CM, Twigg JN, Vu Y, Mott PH. High strain rate mechanical behavior of polyurea. Polymer. 2007;48:574–78. [Google Scholar]
- 21.Yi J, Boyce MC, Lee GF, Balizer E. Large deformation rate-dependent stress-strain behavior of polyurea and polyurethanes. Polymer. 2006;46:319–29. [Google Scholar]


