Abstract
Atomic Force Microscopy (AFM) in force spectroscopy mode has recently emerged as a technique of choice for studying mechanical interactions between the proteins of the core Soluble N-ethylmalmeimide-sensitive fusion protein Attachment protein REceptor (SNARE) complex. In these experiments, the rupture force, extension, spontaneous dissociation times and interaction energy for SNARE protein-protein interactions can be obtained at the single molecule level. These measurements, which are complementary to results and conclusions drawn from other techniques, improve our understanding of the role of the SNARE complex in exocytosis.
Keywords: SNARE complex, exocytosis, Atomic Force Microscope, single molecule, dynamic force spectroscopy, energy
Introduction
Since its invention in 1986,1 the Atomic Force Microscope (AFM) has been widely used in biological research. This microscope utilizes an ultra-sensitive micro-cantilever which can probe biological molecules, such as proteins and DNA, with the sub-nanometer vertical scale resolution.2, 3 Recently, AFM has emerged as the technique of choice for studying mechanical interactions between the proteins of the core Soluble N-ethylmalmeimide-sensitive fusion protein Attachment protein REceptor (SNARE) complex.4-6 In contrast to traditional bulk chemical reaction experiments, AFM probing can report on events at the single molecule level. Here, pairs of interacting proteins are brought together in order to interact and then taken back apart. The magnitude of the stretching force of the intermolecular bonds, within pico-Newton (pN) range, and the stretching length, within nanometer (nm) range, can be measured. In this chapter we focus our attention on a subset of work that used AFM techniques to study intermolecular SNARE protein interactions.4, 6, 7 We first discuss the AFM instrumentation in force spectroscopy mode, followed by a description of a directional protein deposition method. Various measurements achieved on SNARE proteins using these approaches are discussed.
Instrumentation
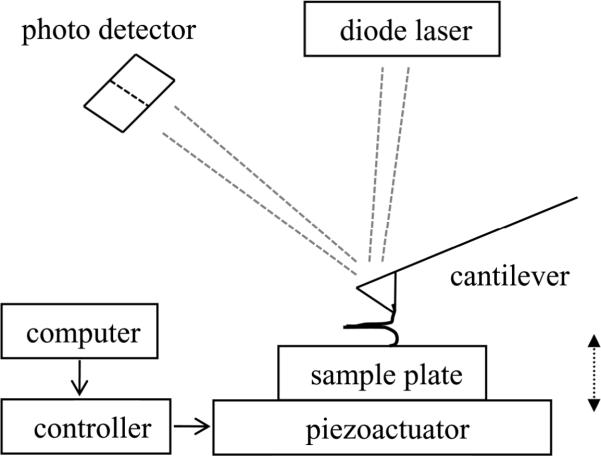
A basic AFM system consists of a base and a controller. The base includes a piezoelectric element with a sample plate located underneath a “head” which contains a built-in diode laser and a photo detector. The controller, directed by a computer, operates the equipment and performs analog-digital / digital-analog conversion. The AFM operates by dragging a probe tip across the sample. A laser beam is focused onto the back of the cantilever containing the integral tip (Fig 1). The reflected laser signal is collected by the photo detector. This optical lever design effectively amplifies the minute deflection of cantilever/tip resulting in a large excursion of the laser beam on the photo diode. The distance between the tip and the sample is controlled by the piezoactuator which expands or retracts depending on the voltage applied. AFM can operate in force spectroscopy mode. Here, by delivering a voltage ramp from the controller to the piezo element, the sample surface is brought into contact with the tip. If the contacting surfaces, the cantilever tip and the glass coverslip (or mica) attached to the sample plate, are functionalized with interacting proteins, then during the contact time, usually lasting ~ 0.5-3 s, a bond can be formed between a protein attached to the tip and an interacting protein attached to the substrate. When the tip is then retracted from the substrate, it bends due to intermolecular bonding force. The deflection signal of this bending is recorded as a function of the distance the piezoactuator moved.
Figure 1.
Schematic of experimental force spectroscopy setup. Recombinant proteins are attached to the cantilever tip and coverslip through a Ni2+-six histidine residue coordination. The piezo is used to first move the coverslip, attached to the sample plate at the top of the piezo, up towards (approach, arrow pointing up) the cantilever tip to establish contact and then down (retraction, arrow pointing down) to exert force on the intermolecular bond. The detection of cantilever deflection is achieved using a laser beam reflected off the back of the cantilever which is collected by a photo detector. This detector is interfaced with a computer via a controller, which also generates signals to control the movement of the piezoactuator.
The interaction force F is proportional to the deflection magnitude Δx of the tip, F=k*Δx, where k is the spring constant of the cantilever. Thus, the calibration of k and Δx is the key element in adequately measuring the force and distance/extension. There are a few methods to obtain the spring constant of the cantilever.8 Perhaps the most common method used is based on the detection of cantilever vibration due to thermal noise. According to the equipartition theorem, thermal energy 1/2kBT is equal to vibration energy 1/2k<x2> of the cantilever at a given temperature, where kB is the Boltzmann constant, T is absolute temperature and x is vibration amplitude, so that the spring constant is:
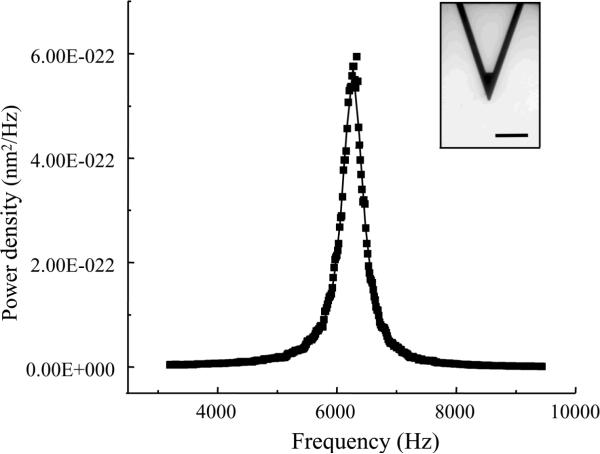
One way to obtain the average square amplitude of vibration is by using the Fourier transform. One can measure the amplitude in the frequency domain and then convert it into the time domain by Fourier transform. A typical power density spectrum of cantilever vibration is shown in Fig. 2. After integrating the peak, one can get <x2>, which can then be used to calculate the spring constant k of the cantilever. Most commonly used cantilevers have spring constants of ~0.01N/m, offering good force sensitivity; although stiffer cantilevers could be used. Calibration of the deflection magnitude Δx is actually linked to the calibration of the piezoactuator. This can be done by imaging a reference sample surface and then making appropriate adjustments to the equipment, usually via a computer-based interface. An alternate method is to use an interferometer to generate an interference pattern from the movement of the piezoactuator, and then define the relationship between the wavelength of light used and the displacement of the piezoactuator.9 Again, the adjustments to the equipment are done by the click of a computer mouse. Generally, interferometric calibration is much more accurate. At this juncture, it is worth mentioning that the experiments investigating interactions between proteins require working in an aqueous environment, thus a fluid cell is a necessary accessory for the microscope.
Figure 2.
A typical power density spectrum of a cantilever. A bright field image of a triangular (320 μm long) silicon nitride cantilever is shown in inset. Integration of power density over frequency gives the average square amplitude <x2> which can be used to calculate the spring constant k. Scale bar in inset, 100 μm.
Single molecule dynamic force spectroscopy
As alluded to earlier, the AFM makes it possible to study the interaction of proteins at the single molecule level when used in force spectroscopy mode. Here, an intermolecular bond between interacting proteins can be formed and broken repeatedly, while the force and extension required for rupturing this bond are recorded. Assuming that there is only one energy barrier to overcome during this process, then when an external force F is applied to the bond by the cantilever, the energy barrier EB will be lowered by the applied force to EB-F*xβ, where xβ is the barrier width (Fig 3). This can be used to obtain spontaneous dissociation times of protein-protein interactions. According to thermal dynamics,10, 11 the off-rate of a bond koff is related to the rupture force:
| (Eq. 1) |
Where kD is a coefficient which is related to the thermal frequency of the bond. Consequently, the spontaneous dissociation rate koff0 can be obtained by measuring rupture forces at different force loading rates, as given by chemical reaction rate theory. Here the applied force loading rate can be adjusted by varying the extension/retraction of the piezoelectric tube as dF/dt=k*v, where k is the spring constant of the cantilever and v is the movement speed of the sample plate. The relationship between the rupture force and the force loading rate can then be fitted to the equation:
| (Eq. 2) |
When the applied force is set to zero, then the spontaneous lifetime τ0 (1/koff0) of the bond can be obtained:
| (Eq. 3) |
Thus, when the forces needed to take apart interacting SNARE proteins are measured at various pulling speeds, the spontaneous lifetimes of the protein-protein interactions can be obtained. Indeed, this approach has been used for studying the interactions between SNARE proteins (see below).4
Figure 3.
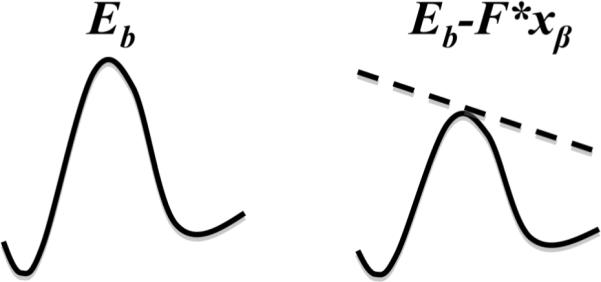
Energy landscape of a single activation barrier bond. When an external force F is applied, the energy barrier EB is lowered (dashed line); xβ is the barrier width.
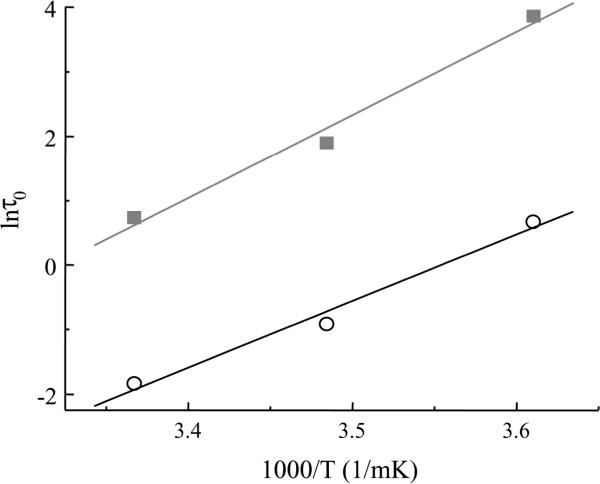
Besides being a powerful tool to study force and off-rate in single molecule interactions, dynamic force spectroscopy can also be used to obtain energetic information of a bond. Hence, from Eq. 1, the off-rate is a temperature dependent parameter. If one measures off-rates at different temperatures, then one can obtain the interaction energy by fitting the relationship between the off-rate and inverse temperature, referred to as the Arrhenius plot (see below; Fig 6). It is important to realize that here the interaction energy actually is the adhesion energy between interacting protein molecules. In dynamic force spectroscopy, the adhesion energy corresponds to the change in enthalpy (Δ) of the intermolecular interactions according to ΔH=ΔG+TΔS, where ΔG is the change in free energy and ΔS is the change in entropy. Taking into account that ΔG is negligible over the relatively narrow temperature range used in biological experiments12 studying exocytosis (i.e., from 277 K (+4°C) to ~307 K (34°), one can calculate all three energy parameters from a fit to Eq. 1.
Figure 6.
The natural logarithm of the mean lifetime τo of the bound system plotted as a function of inverse temperature. Enthalpy (ΔH) and entropy (ΔS) can be obtained for the Sx1ASb2 in the absence (open circles) or presence of SNAP25B (squares) from the slope and intercept, respectively. Modified form Liu et al. 6, 7
Sample preparation
In AFM single molecule probing experiments, the type of procedure used for depositing proteins on the tip and substrate is critical. A variety of methods have been used to attach proteins onto cantilevers and substrates, including covalent (e.g., Au-S) and non-covalent bonds (e.g., biotinavidin based attachment), as reviewed elsewhere.13 For deposition of SNARE proteins two different approaches have been used thus far. Yersin et al. used glutaraldehyde cross-linking to attach SNARE proteins onto the AFM tip and mica surface.5 The aminopropyltrietoxysilane (ATEPS) treated mica/tip surface was exposed to protein solution, containing glutaraldehyde so that amines in ATEPS and lysines in proteins were cross linked, thus allowing proteins to covalently bind to the mica/tip. Although this approach can immobilize SNARE proteins on tips and mica, the amine cross linker might also cross-link the lysines within a single protein molecule or among multiple molecules, resulting in large aggregates that can obscure the interpretation of data gathered by force spectroscopy. Preferably, one should employ a directional deposition of SNARE proteins via sterical coordination.4, 14 Here, both the cantilever and the glass coverslip were coated with a thin nickel film applied by thermal evaporation. After allowing the nickel to partly oxidize in air, forming Ni2+, recombinant SNARE proteins, containing tags of six consecutive histidines (His6) at their C-termini, were applied in aqueous solution. Due to the binding between Ni2+ and His6, the proteins became attached. The measured strength of Ni2+- His6 bond was more than double the forces generated between proteins of the SNARE complexes. Thus, a Ni2+-His6 bond can be effectively used to attach SNARE proteins to the nickel-coated tips and coverslips in order to study them by force spectroscopy, as outlined below. Furthermore, this linking method helps SNARE proteins to interact freely in a more physiologically prevalent parallel fashion.15-17 Once the attachment of proteins to the coverslips and tips is completed, the experiments can start right away, or alternatively, such functionalized tips and substrates can be stored in a refrigerator (277 K (+4°C)) overnight until used in experiments.
Measurements
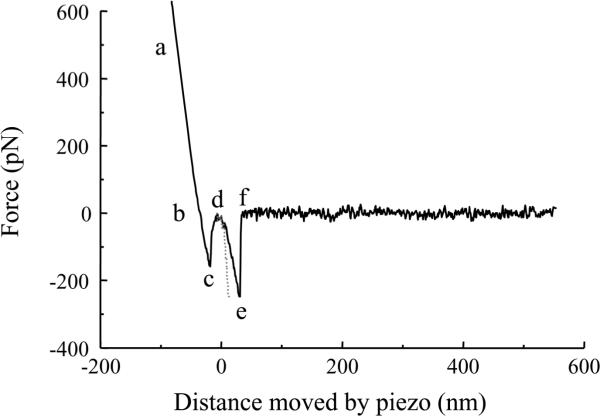
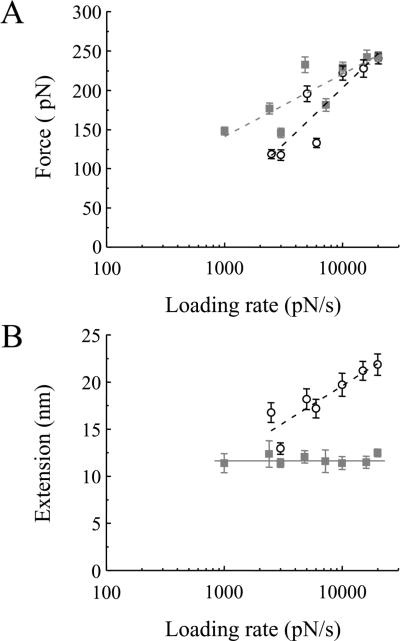
As indicated earlier, proteins deposited on the tip and substrate (glass coverslip) will form a bond when they are brought into contact by the piezoelectric element. Then the piezo is used to retract the coverslip away from the cantilever. The typical retraction part of a force curve is shown in Fig. 4. Here, the tip, co-functionalized with syntaxin 1A (Sx1A) and synaptosome-associated protein of 25 kDa isoform B (SNAP25B), was brought into contact with the glass coverslip, functionalized with synaptobrevin 2 (Sb2). Upon contact the ternary complex can form. The line abc is due to direct contact between the coverslip and the cantilever tip. The section def was confirmed to be specific to this interaction, as it was absent when either the cantilever tip, or the coverslip, or both remained unfunctionalized. As the tip and coverslip are further separated, this leads to the increased application of force to the intermolecular bond until it ruptures at point e and the cantilever returns to its free equilibrium position f. The segment ef is the force necessary to rupture the Sx1A-SNAP25B-Sb2 bond, while the segment de reports on the extension of molecules within the individual ternary SNARE complex. It should be noted, that the displacement of the piezoactuator in the segment de does not report on the true extension of the intermolecular interaction because of the bending of the cantilever due to the application of force. Consequently, one needs to subtract such bending deflection from the displacement of the cantilever to obtain the correct value for the intermolecular extension (Fig. 5; dotted line). The outlined experiment is repeated and due to thermal fluctuation, one can obtain a distribution histogram of the rupture force of the bond, with its mean and standard error, rather than a single value. Using such an approach, Liu et al. obtained an interaction force of 237±4 pN and 243±5 pN for Sx1A-Sb2 and Sx1A-SNAP25B-Sb2 interactions, respectively, at a retraction velocity of 1.6 μm/s (corresponds to a force loading rate of 20 nN/s).4 Additionally, the extension values of 23.0±0.6 nm for Sx1A-Sb2 and 12.5±0.4 nm for the ternary Sx1A-SNAP25B-Sb2 interactions were obtained.
Figure 4.
The retraction part of a typical force-distance (extension) curve using a Sx1A/SNAP25B functionalized tip and a Sb2 functionalized coverslip. In the segments ab and bc the coverslip and the cantilever tip are still in contact. The bcd segment is due to non-specific ineractions which are present even in the absence of any proteins. The Sx1A-SNAP25B-Sb2 intermolecular “bond” starts to be extended at point d. The increasing extension as the coverslip moves further away from the tip leads to an increased application of force on the intermolecular bond till it ruptures at point e. The segment ef' is then the measure of the force (ordinate) necessary to remove Sx1A-SNAP25B-Sb2 interaction. The extension induced can be calculated from the z-axis distance moved by the piezo (abscissa) given by segment de. The dotted line indicates the extension after the distance has been corrected for the bending of the cantilever. Retraction velocity: 1.6 μm/s.
Figure 5.
The force and extension values for the dissociation of SNARE proteins as a function of the force loading rate. A) The force necessary to take apart Sx1A-Sb2 in the absence (open circles) or presence of SNAP25B (squares) increases exponentially with an increase in the loading rate. B) The extension changes exponentially with loading rate when Sx1A-Sb2 interactions are ruptured, but it remains unchanged (constant at ~ 12 nm) when measuring Sx1ASb2-SNAP25B interactions. Adopted from Liu et al.4
To gain an insight into the nature of the interactions within the binary (Sx1A-Sb2) and ternary SNARE complexes, one needs to measure force and extension at the point of rupture of single intermolecular bonds as a function of the force loading rate (Figure 5).4 The measured rupture force increases exponentially with the loading rate. By extrapolating the loading force rate to zero, one can estimate dissociation rates which correspond to the spontaneous off-rates (koff0) when only a single barrier width to the transition state exists. In the case of Sx1A-Sb2 interaction, a spontaneous dissociation lifetime (τ0)of 0.16 s can be obtained, while the ternary SNARE complex is substantially more stable, displaying a spontaneous dissociation lifetime of 2.1 s. The extension in the case of Sx1A-Sb2 exponentially increases as a function of the force loading rate. Thus, when combined with force measurements under various loads, this feature of Sx1A-Sb2 interaction points to a zipper type non-localized interaction throughout the entire SNARE domains of these two proteins. In stark contrast, the extension measurements with the ternary SNARE complex are constant as the loading rate is varied. When this fact is combined with the observation that the rupture force increases exponentially with increasing loading rate, it implicates a cuffing role for SNAP25B when interacting with Sx1A and Sb2. This type of interaction refers to a strong and localized intermolecular bond localized at ~12 nm extension, corresponding to the so called `0' layer in X-ray crystallographic data.18 Based on these measurements, Liu et al. further proposed that there could be two modes of intracellular vesicular positioning with respect to the plasma membrane. For vesicle-membrane separation distances between 12-23 nm, a Sx1A-Sb2 bond could be formed. At distances less than 12 nm, the ternary SNARE complex oriented in parallel would play the major role in vesicular positioning and such interaction could last for an order of magnitude longer than the one mediated by Sx1A-Sb2 in the absence of SNAP25B.
Using the spontaneous dissociation lifetime of a bond obtained at various temperatures, information about the bond energy can be obtained. For example, Liu et al.6 measured spontaneous lifetimes of binary Sx1A-Sb2 interactions at 277 K (+4°C), 287 K (+14°C) and 297 K (+24°C). A natural logarithm (Arrhenius) plot of spontaneous lifetime vs inverse temperature is shown in Fig. 6. Since kD=ka*exp (ΔS/kB), Eq. 1 can be rewritten as:
where ka is 6.2*1012 s-1 for the Eyring model or 3.3*109 s-1 for Kramer's model of chemical reactions for the interaction between proteins.11, 12 By using a linear fit to the data on an Arrhenius plot, one can obtain the slope and the intercept, corresponding to changes in enthalpy and entropy of the interaction, respectively. Hence, an enthalpy of the binary complex of 33±6 kB T was obtained, while entropy values were 0.018±0.019 kBT*K-1 or 0.042±0.019 kBT*K-1 for the Eyring model or Kramer's model, respectively. Similar measurements for the ternary, Sx1A-SNAP25B-Sb2, complex can be achieved with an enthalpy of 43±5 kBT.7 If the formation of binary and ternary complexes would lead to an energy release equivalent to that of their measured enthalpies then, based on the 10 kBT higher enthalpy measured for the ternary system along with the shorter extensions required to rupture the complex, this would implicate SNAP25B in profoundly increasing the probability for membrane fusion. Alternatively, if the energy release during the formation of complexes could not be applied towards vesicular fusions, but rather is simply consumed in the tethering/docking of vesicles at the plasma membrane, this would indicate that there is a higher energy demand required to keep vesicles at half the distance and an order of magnitude longer in the presence of SNAP25B. Of course, these two possibilities accounting for enthalpy are not mutually exclusive.
In addition to using a temperature-dependent approach to measure energy parameters between interacting proteins as shown above, one can use the Jarzynski equality theorem,19, 20 where experimental data can be obtained at a single temperature point. Indeed, Liu et al.6 obtained interaction energies of the Sx1A-Sb2 binary complex with values comparable to those obtained from the single molecule reaction rate theory.
The measurement of energy can also be used to cross-check for internal consistency in data on spontaneous lifetime. Here, from free energy ΔG, one can obtain the spontaneous lifetime according to:
Note that the free energy ΔG is used, but not the enthalpy ΔH. For example, based on the ternary complex free energy of 23 kBT from Liu et al.,7 the spontaneous lifetime equates to ~ 3 s, a value which is in good agreement with the 2.1 s obtained from the force loading rate experiment.4 Interestingly, if the activation energy ΔH of 43 kBT is inappropriately applied instead of ΔG, then the “spontaneous lifetime” would be more than several days. Such a value would be consistent with reports of spontaneous lifetimes obtained using the surface force apparatus, as reported elsewhere.21
Concluding remarks
The intent of this chapter was to provide a short overview of the use of the AFM in force spectroscopy mode to investigate exocytotic/SNARE proteins. Single molecule mechanical probing by AFM is an effective approach to study interactions between SNARE proteins. The interaction force, extension, spontaneous dissociation times, and energy of SNARE proteinprotein interactions can be obtained. These results have improved our understanding of the role of the SNARE complex in exocytosis and are complementary to results and conclussions drawn from other techniques.
Acknowledgments
The authors' work is supported by the National Institute of Mental Health (MH 069791). We thank Dr. Erik B. Malarkey for comments on previous versions of this manuscript.
References
- 1.Binnig G, Quate CF, Gerber C. Atomic force microscope. Phys Rev Lett. 1986;56:930–933. doi: 10.1103/PhysRevLett.56.930. [DOI] [PubMed] [Google Scholar]
- 2.Florin EL, Moy VT, Gaub HE. Adhesion forces between individual ligandreceptor pairs. Science. 1994;264:415–417. doi: 10.1126/science.8153628. [DOI] [PubMed] [Google Scholar]
- 3.Lee GU, Chrisey LA, Colton RJ. Direct measurement of the forces between complementary strands of DNA. Science. 1994;266:771–773. doi: 10.1126/science.7973628. [DOI] [PubMed] [Google Scholar]
- 4.Liu W, et al. Single molecule mechanical probing of the SNARE protein interactions. Biophys J. 2006;91:744–758. doi: 10.1529/biophysj.105.073312. [DOI] [PMC free article] [PubMed] [Google Scholar]
- 5.Yersin A, et al. Interactions between synaptic vesicle fusion proteins explored by atomic force microscopy. Proc Natl Acad Sci U S A. 2003;100:8736–8741. doi: 10.1073/pnas.1533137100. [DOI] [PMC free article] [PubMed] [Google Scholar]
- 6.Liu W, et al. Comparative Energy Measurements in Single Molecule Interactions. Biophys J. 2008;95:419–425. doi: 10.1529/biophysj.107.127886. [DOI] [PMC free article] [PubMed] [Google Scholar]
- 7.Liu W, et al. Single molecule measurements of interaction free energies between the proteins within binary and ternary SNARE complexes. Submitted. 2008 doi: 10.1166/jns.2009.1001. [DOI] [PMC free article] [PubMed] [Google Scholar]
- 8.Florin EL, et al. Sensing Specific Molecular-Interactions with the Atomic-Force Microscope. Biosensors & Bioelectronics. 1995;10:895–901. [Google Scholar]
- 9.Chen F, Mohideen U. Fiber optic interferometry for precision measurement of the voltage and frequency dependence of the displacement of piezoelectric tubes. Review of Scientific Instruments. 2001;72:3100–3102. [Google Scholar]
- 10.Bell GI. Models for the specific adhesion of cells to cells. Science. 1978;200:618–627. doi: 10.1126/science.347575. [DOI] [PubMed] [Google Scholar]
- 11.Evans E. Probing the relation between force--lifetime--and chemistry in single molecular bonds. Annu Rev Biophys Biomol Struct. 2001;30:105–128. doi: 10.1146/annurev.biophys.30.1.105. [DOI] [PubMed] [Google Scholar]
- 12.Atkins PW. Physical Chemistry. W.H. Freeman and Company; New York, NY: 1990. [Google Scholar]
- 13.Montana V, et al. Single molecule probing of exocytotic protein interactions using force spectroscopy. Croat Chem Acta. 2008;81:31–40. [PMC free article] [PubMed] [Google Scholar]
- 14.Liu W, et al. Botulinum toxin type B micromechanosensor. Proc Natl Acad Sci U S A. 2003;100:13621–13625. doi: 10.1073/pnas.2233819100. [DOI] [PMC free article] [PubMed] [Google Scholar]
- 15.Bowen ME, et al. Single molecule observation of liposome-bilayer fusion thermally induced by soluble N-ethyl maleimide sensitive-factor attachment protein receptors (SNAREs) Biophys J. 2004;87:3569–3584. doi: 10.1529/biophysj.104.048637. [DOI] [PMC free article] [PubMed] [Google Scholar]
- 16.Lin RC, Scheller RH. Structural organization of the synaptic exocytosis core complex. Neuron. 1997;19:1087–1094. doi: 10.1016/s0896-6273(00)80399-2. [DOI] [PubMed] [Google Scholar]
- 17.Hanson PI, et al. Structure and conformational changes in NSF and its membrane receptor complexes visualized by quick-freeze/deep-etch electron microscopy. Cell. 1997;90:523–535. doi: 10.1016/s0092-8674(00)80512-7. [DOI] [PubMed] [Google Scholar]
- 18.Sutton RB, et al. Crystal structure of a SNARE complex involved in synaptic exocytosis at 2.4 A resolution. Nature. 1998;395:347–353. doi: 10.1038/26412. [DOI] [PubMed] [Google Scholar]
- 19.Jarzynski C. Nonequilibrium equality for free energy differences. Physical Review Letters. 1997;78:2690–2693. [Google Scholar]
- 20.Jarzynski C. Equilibrium free-energy differences from nonequilibrium measurements: A master-equation approach. Physical Review E. 1997;56:5018–5035. [Google Scholar]
- 21.Li F, et al. Energetics and dynamics of SNAREpin folding across lipid bilayers. Nat Struct Mol Biol. 2007;14:890–896. doi: 10.1038/nsmb1310. [DOI] [PubMed] [Google Scholar]


