

Abstract
This event-related functional magnetic resonance imaging (er-fMRI) study investigated BOLD signal change in response to a series of pure gustatory stimuli that varied in stimulus quality when subjects were hungry and sated with a nutritional preload. Group analyses showed significant differences in activation in the hunger minus satiety condition in response to sucrose, caffeine, saccharin, and citric acid within the thalamus, hippocampus, and parahippocampus. When examining the hunger and satiety conditions, activation varied as a function of stimulus, with the majority of the stimuli exhibiting significantly greater activation in the hunger state within the insula, thalamus, and substantia nigra, in contrast to decreased activation in the satiated state within the parahippocampus, hippocampus, amygdala, and anterior cingulate. Region of interest (ROI) analysis revealed two significant interactions, ROI by physiology and ROI by physiology by stimulus. In the satiety condition, the primary (inferior and superior insulae) and secondary (OFC 11 and OFC 47) taste regions exhibited significantly greater brain activation in response to all stimuli than regions involved in processing eating behavior (hypothalamus), affect (amygdala), and memory (hippocampus, parahippocampus and entorhinal cortex). These same regions demonstrated significantly greater activation within the hunger condition than the satiety condition, with the exception of the superior insula. Furthermore, the patterns of activation differed as a function taste stimulus, with greater activation in response to sucrose than to the other stimuli. These differential patterns of activation suggest that the physiological states of hunger and satiety produce divergent activation in multiple brain areas in response to different pure gustatory stimuli.
Keywords: Taste, Hunger, Satiety, Gustatory, Event-related fMRI
Introduction
Taste influences caloric intake and warns against ingestion of harmful substances (Scott et al., 1995). Behaviorally, caloric intake is modulated by physiological and psychophysical changes associated with hunger and satiety. Specifically, there is a positive association between physiological states of hunger and perceived taste pleasantness, a phenomenon termed “allesthesia” (Cabanac, 1971). Moreover, Cabanac and Duclax (1970) demonstrated that the modulation of perceived pleasantness by physiological state occurs 45 minutes after food consumption, suggesting that post digestive signals influence pleasantness and subsequent food consumption. Eating behavior can also be modified by changes in the perceived pleasantness of the sensory qualities associated with food recently consumed, termed sensory specific satiety (Rolls et al., 1981). Sensory-specific satiety can occur as early as two minutes after ingestion of food, and results in decreased pleasantness and subsequent termination of intake of the food previously consumed (Rolls et al., 1981).
Single neuron recordings from the non-human primate provide anatomical and functional foundations on which to base hypotheses regarding cortical taste regions in humans. Electrophysiological studies investigating the sight and taste of food have demonstrated that regions within the primary and secondary taste cortices are differentially modulated by satiety. Specifically, satiety did not alter neuronal signaling in response to taste stimuli in the nucleus of the solitary tract (Rolls, 1989; Yaxley et al., 1985), frontal opercular cortex (Rolls et al., 1988), or the insular cortex (Yaxley et al., 1985). However, satiety modulated the signaling of individual neurons within the amygdala, by as little as 1% and as much as 100%, with a mean suppression rate of 58%. Interestingly, single neuronal signaling in the caudolateral orbitofrontal cortex [OFC; (Rolls et al., 1989)], and hypothalamus (Burton, et al., 1976), decreased to zero when the monkey became satiated. However, when presented with a novel stimulus, signaling within these regions returned. It has been suggested that the amygdala’s functional and anatomical location between the primary gustatory cortex, which shows no effect of satiety, and the OFC and hypothalamus, which show complete suppression after satiety, may be indicative of the amygdala’s involvement in processing affective information that is partially modulated by physiological state (Yan and Scott, 1996).
Human neuroimaging studies provide further information regarding neuroanatomical correlates involved in the physiological states of hunger and satiety. Several neuroimaging studies examining the effects of hunger and satiety on activation to chemosensory stimuli have reported consistent activation within the insular cortex (Tataranni et al., 1999; Del Parigi et al., 2002b; Kringelbach et al., 2003; Uher et al., 2006), OFC ; (Small et al., 2001; Del Parigi et al., 2002a; Kringelbach et al., 2003; Gottfried et al., 2003), hippocampal formation (Tataranni et al., 1999; Gautier et al., 1999), dorsolateral prefrontal cortices (Tataranni et al., 1999; Uher et al., 2006), and the striatum (Tataranni et al., 1999; Kringelbach et al., 2003). However, inconsistencies remain in the literature regarding global patterns of activation. These inconsistencies in brain regions modulated by hunger and satiety may be a result of the type of chemosensory stimuli employed. To address this concern, the current study investigated brain response to a series of pure gustatory stimuli that varied in stimulus quality, using an event-related fMRI design to investigate modulation of response to pure gustatory stimuli by hunger and satiety.
Flavor stimuli elicit the involvement of taste and olfactory systems. Behaviorally, for the participant, this often results in taste-smell confusions; in which an odor stimulus presented in the oral cavity is attributed to taste and not olfaction (Cerf-Ducastel and Murphy, 2001; Frank and Byram, 1988; Murphy and Cain, 1980; Murphy et al., 1977; Rozin, 1982; Stevenson et al., 1999).
At the central level, non-human primate studies using single neuron recordings provide a neuroanatomical basis for taste/smell confusion. Previous research has shown that there is close proximity within the OFC of unimodal neurons involved in taste, olfaction, and vision and bimodal and multimodal neurons (Tanabe et al., 1975; Thorpe et al., 1983; Rolls, et al., 1990; Rolls and Baylis, 1994). Moreover, in functional magnetic resonance imaging (fMRI) experiments, Cerf-Ducastel and Murphy (2001) showed that olfactory stimuli delivered in the mouth activated areas typically associated with taste response, e.g., OFC, insula and Rolandic operculum; and de Araujo and colleagues demonstrated that delivering taste and olfactory stimuli independently elicited activation that overlapped within the caudal OFC, amygdala, insula, and frontal operculum (de Araujo et al., 2003c).
Recent fMRI experiments examining the response to complex flavor stimuli during hunger and satiety suggest that sensory qualities of the stimuli may differentially activate regions involved in flavor perception (Uher et al., 2006; Kringelbach et al., 2003). Discriminating between brain regions involved in gustatory processing from regions involved in olfactory processing during hunger and satiety is an important component in understanding regions involved in flavor perception, as well as the effect of physiological condition on eating behavior.
The present study used event related fMRI (er-fMRI) to investigate differential brain activation in response to six pure taste stimuli in two physiological states: hunger and satiety. The purpose of the current study is to elucidate the central processes involved in taste perception and the modulation by hunger and satiety of activation in these regions. Thus, a series of stimuli representing different taste qualities were employed in order to extract commonalities associated with taste stimulation and examine differences associated with quality. In addition, understanding how taste is modulated by hunger and satiety is critical for determining the neural substrates of eating disorders and the nutritional deficits that occur in the aging population.
Method
A more detailed description of the development of the materials and methods used in this study can be found in Haase et al., 2007, in the Journal of Neuroscience Methods.
Participants
Eighteen healthy young adults, nine females and nine males, ranging in age from 19 to 22 years (M = 20.7, SD = 0.99) participated in the study after giving informed consent. Subjects received monetary compensation for participating in the study. The Institutional Review Boards at both San Diego State University and the University of California, San Diego approved the research.
Screening Session
In the first session subjects completed the chemosensory assessment to screen for ageusia and anosmia with taste and odor threshold measurements (Cain et al., 1983; as modified in Murphy et al., 1990). Exclusionary criteria consisted of ageusia, anosmia, and upper respiratory infection or allergies within the prior two weeks. Subjects completed preliminary fMRI safety screening and the Three-Factor Eating Questionnaire (Stunkard and Messick, 1985) was administered to screen for restrained eating. Participants were within normal limits.
Experimental Procedure
In the second and third sessions, the participants fasted for 12 hours prior to arrival and were randomly presented either with pre-load consisting of 474ml (two bottles) of Vanilla flavored Ensure Plus or without pre-load and then completed an fMRI session conducted on a 3T GE whole body scanner.
Immediately before, after, and during the scan, participants rated their hunger and the pleasantness and intensity of the six stimuli. Participants used the general Labeled Magnitude Scale (gLMS) to rate intensity and a modified gLMS scale to rate pleasantness and hunger (Figure 1; Green et al., 1993; Green et al., 1996; Bartoshuk et al., 2004). Data analysis involving the evaluation of intensity and pleasantness during the scan is not described here but is the subject of another manuscript.
Figure 1.
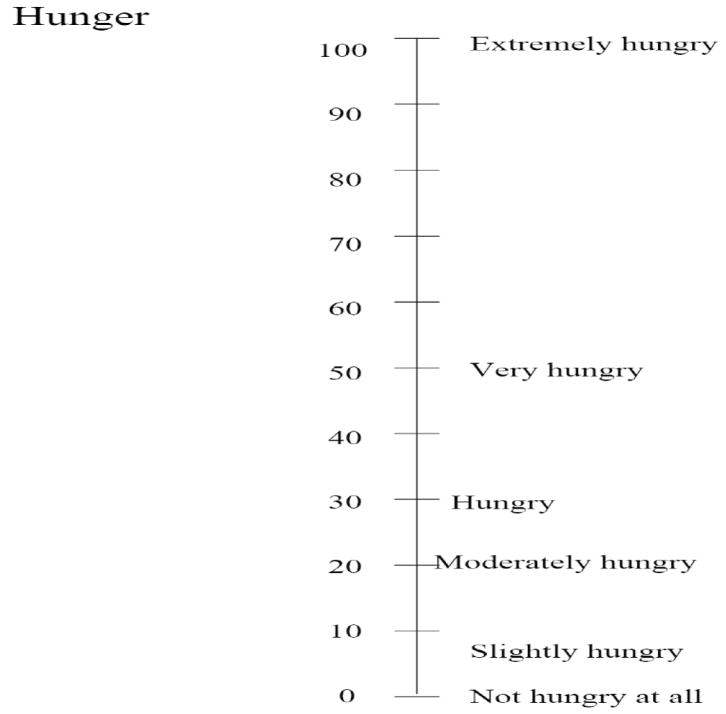
Labeled magnitude scale (LMS) for hunger
Stimuli
The following pure taste stimuli were presented dissolved in distilled water: caffeine, 0.04M; citric acid, 0.01M; guanosine 5’-monophosphate (GMP), 0.025M; saccharin, 0.028M; sucrose, 0.64M; sodium chloride (NaCl), 0.16M.
Stimulus Presentation
Inside the scanner the participant lay supine and was fitted with a bite bar. The bite bar reduced head movement associated with swallowing and was positioned comfortably between the lips so that the tubes delivered stimuli to the tip of the tongue. The six stimuli and water were delivered at room temperature through seven 25 ft long plastic tubes, which were connected to seven different computer-programmable syringe pumps. The pumps were programmed to present 0.3ml of solution in 1 s (Haase et al., 2007).
During the functional run, the six different solutions and water were pseudo-randomly presented and separated by a 10s inter-stimulus interval (ISI). Stimulus presentation was followed by two presentations of water; the first presentation of water was used as a rinse and the second presentation of water was used as a baseline comparison for the stimulus. Instructions were displayed on a screen through a computer interface.
FMRI Scanning Paradigm
Experimental Design
Each scanning session included two separate runs of 24 min (1440 s) in duration. Each stimulus was presented eight times in each run, for a total of 16 repetitions. The temporal order of events was determined according to two conditions 1) the criteria for efficient estimation of hemodynamic responses (Liu et al., 2001; Liu and Frank, 2004; Buracas and Boynton, 2002) and 2) limitations due to the nature of taste stimulation. Two presentations of the same stimulus were separated by a minimum of 60 sec due to the fact that there were two water presentations between each stimulus, and that no two stimuli were presented sequentially, thus minimizing adaptation (Bartoshuk et al., 1964; McBurney and Pfaffmann, 1963). Each of the computer-controlled pumps was programmed with a distinct series of stimulation periods so that the above conditions were met. Figure 2 illustrates the fMRI paradigm; a more detailed description of the task is reported elsewhere (Haase et al., 2007).
Figure 2.
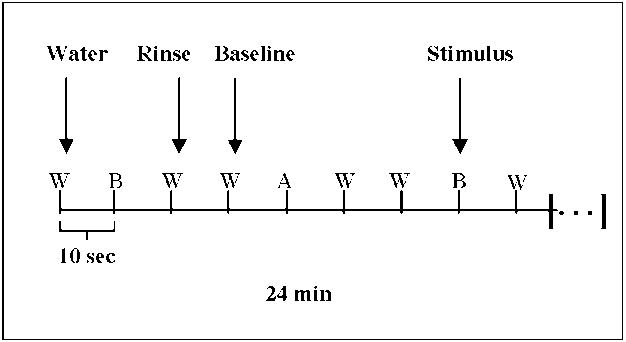
Event related fMRI paradigm
Image Acquisition
Imaging was conducted on a 3T General Electric (GE) Excite “shortbore” scanner. Structural images for anatomical localization of the functional images were collected first using a high-resolution T1-weighted whole-brain FSPGR sequence [Field of view (FOV) = 25 cm, slice thickness = 1 mm, resolution 1×1×1 mm3, echo time (TE) = 30 ms, Locs per slab = 136, flip angle = 15°]. A standard gradient echo EPI pulse sequence was used to acquire T2*-weighted functional images [24 axial slices, FOV = 19 cm, matrix size = 64×64, spatial resolution = 2.97×2.97×3 mm3, flip angle =90°, echo time (TE) = 30 ms, repetition time (TR) = 2 s].
Image Analysis
Functional data were processed and analyzed using Analysis of Functional NeuroImage (AFNI) software (Cox, 1996). Preprocessing consisted of: motion correction, temporal and spatial smoothing, concatenation, and automasking. Deconvolution was applied to the concatenated runs at the individual level. To conduct group analysis, a one-sampled t-test was calculated on the fit coefficient corresponding to each contrast at each voxel. Further details appear in Haase et al. (2007).
Contrasts
In the 3dDconvolution analysis, the main effects of hunger and satiety were investigated separately by performing contrasts against a baseline of water. For each subject each stimulus was presented in two conditions, hence for each stimulus there were two contrasts of interests, e.g. sucrose during the hunger condition vs. water during the hunger condition and sucrose during the sated condition vs. water during the sated condition. Additionally, contrasts were created for each stimulus that examined the effect of hunger minus satiety (hunger-satiety). Composite images were created for each stimulus separately that displayed the hunger, satiety, and hunger-satiety contrasts on the same image (Figures 3-6). For each contrast, a one-sample t-test was calculated on the fit coefficient at each voxel. For the purposes of the present manuscript, the analyses presented were averaged over two runs collected on the same day, during which participants performed two separate evaluative tasks.
Figure 3.

a. Hunger ratings before and after the consumption of a nutritional pre-load.
b. Hunger ratings for the Pre-load and No Pre-load conditions, pre and post scanning.
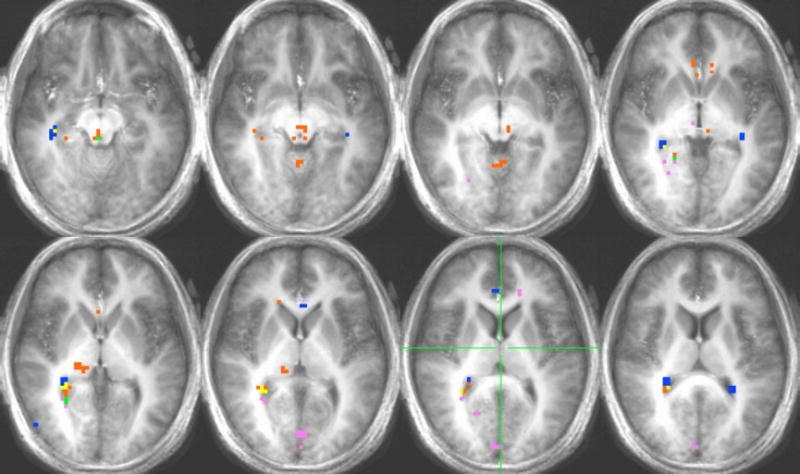
Figure 6.
Voxel-by-voxel group analysis showing the main effects in the HUNGER, SATIETY AND HUNGER-SATIETY conditions for caffeine. See Figure 4.
Voxel by voxel analysis
A statistical threshold corrected for the whole brain was considered for image analysis for the hunger and satiety conditions. The statistical threshold was chosen based on the result of 10,000 Monte Carlo simulations run with AlphaSim (Ward, 1997). AlphaSim estimates the probability of occurrence of clusters composed of voxels with a specific p value (i.e. 0.0005), separated by no more than 1 voxel width. Specifically, 3mm activated voxels in the same cluster had one complete side in common, for images spatially blurred with a 6mm (FWHM) Gaussian filtering kernel. The analysis indicated that with the parameters for the present study, less than 5% of clusters would be activated by chance in the complete explored brain volume. Voxels with a correlation coefficient exceeding a threshold of p = 0.0005 (t = 4.3) and belonging to clusters of at least five voxels were considered as activated.
Regions of interest (ROI) analysis
Regions of interest were selected from the Talairach and Tournoux database implemented in AFNI software (Cox, 1996) that provides anatomical operational definitions of regions. This feature allows for applying masks corresponding to Talairach areas onto functional MRI datasets transformed to Talairach space in order to extract signals from voxels located in selected regions.
The current study investigated activation in 12 Talairach areas identified a priori as ROIs in the left and right hemispheres: hippocampus, amygdala, Brodmann area 11 of the orbito frontal cortex (OFC11), Brodmann area 47 of the orbito frontal cortex (OFC47), inferior and superior insulae, hypothalamus, thalamus, parahippocampal gyrus, entorhinal cortex, frontal operculum, and the rolandic operculum. The inferior occipital lobe was included in all analyses as a control region for comparison. Areas were used as defined in the AFNI tool except for the orbito frontal cortex areas OFC11 and OFC47 for which contours were filled manually.
Each mask corresponding to one ROI in one hemisphere was applied to each subject’s dataset transformed to Talairach space. Signals from voxels contained in each ROI for the dataset of each subject were averaged. Repeated measures ANOVA was run on the average signal of each ROIs as described below.
Results
Demographics
A between subjects multivariate analysis of variance (MANOVA) was performed to examine potential differences in demographic characteristics [dependent variables: age, weight, height, body mass index (BMI), Three Factor Eating Questionnaire (TFEQ), taste threshold, and calories consumed per kilogram] of males and females. Using an alpha level of .001 to evaluate homogeneity assumptions, Box’s M test of homogeneity of covariance and Levene’s homogeneity of variance test were not statistically significant. Using Pillai’s Trace as the omnibus test statistic, the combined dependent variables resulted in a significant main effect for gender, [F = 3.536, p = .027, partial η2 = .673].
To probe the statistically significant multivariate effect, univariate ANOVAs were conduced on each dependent variable (Table 1). There were no significant differences between males and females, in age or taste thresholds. However, as expected, there was a significant difference in weight. Additionally, as expected, there was a significant difference in height between males and females. BMI was calculated for each participant as weight (kg) divided by the square of the height (cm); there were no significant differences between females and males.
Table 1.
Demographics
| Means | F | p value | Partial η2 | ||
|---|---|---|---|---|---|
| Females | Males | ||||
| Age | 21.3 | 20.5 | 1.352 | .260 | .070 |
| Taste Threshold | .011 | .002 | 4.130 | .057 | .187 |
| Weight (kg) * | 61.46 | 77.02 | 8.297 | .010 | .316 |
| Height (cm) * | 164.85 | 177.55 | 8.300 | .010 | 5.15 |
| Body Mass Index (BMI) | 23.05 | 24.40 | .630 | .438 | .034 |
| Three Factor Eating Questionnaire (TFEQ) | 5.3 | 4.8 | .055 | .817 | .003 |
| Kcal/kg * | 11.54 | 9.40 | 9.77 | .006 | .352 |
The mean score from the Three Factor Eating Questionnaire (TFEQ) in the current sample (M = 5) was significantly lower than the expected score for individuals considered high in restraint (11-13) and those with clinically elevated restraint (< 14; Stunkard & Messick, 1985). There were no significant differences for scores on the TFEQ between males and females. Moreover, there was no significant correlation between scores on the TFEQ and BMI (r = .274, p = 242). Thus, TFEQ was not considered in further analyses.
A range for the number of calories consumed per milliliter of Ensure Plus for males and females was determined to ensure that sufficient calories were consumed to induce a metabolic response. Males and females consumed an equal amount of Ensure Plus (474ml = 700cal); therefore, the range was determined based on the number of calories consumed per weight (kcal/kg). The number of calories consumed per kilogram was statistically different between males and females. However, the number of calories consumed was significant for both males and females to elicit a metabolic response (Crovetti et al., 1998).
Hunger ratings were collected for both hunger and satiety conditions after a 12h fast. In the satiated condition, hunger ratings were collected three times, (1) before consumption of the pre-load, (2) 10 minutes after consumption of the pre-load, pre scanning, and (3) post scanning (time points 1, 2, and 3 respectively). During the hunger condition subjects did not consume a pre-load and thus the hunger scores were collected twice, (4) pre scanning and (5) post scanning (time points 4 and 5). Independent samples t-tests were calculated to examine the effect of physiological state and time on hunger ratings. There was a significant effect of the physiological state on hunger ratings in the satiated condition between time points 1 and 2, [t = 6.88, p < .001]; hunger ratings at time point 1 (M = 62.58) were significantly higher than the hunger ratings for time point 2 (M = 18.21) (Figure 3a). As hypothesized there was no significant effect of hunger in the satiated condition between time points 2 and 3, [t = .031, p = .976]. There was no significant increase over time in hunger ratings for time point 2 (M = 18.21) and 3 (M = 18.11). Lastly, in the hunger condition there was a significant effect of hunger between time points 4 and 5, [t= -2.09, p < .05]. Hunger scores were significantly higher for time point 5 (M = 65.40), relative to time point 4 (M = 55.26; Figure 3b).
Pleasantness and intensity ratings were collected immediately before (pre scanning) and after (post scanning) the fMRI scans for the hunger and satiety conditions. As hypothesized, there were no significant differences in perceived pleasantness or intensity across time (pre vs. post scanning; p = .911), physiological condition (hunger vs. satiety; p = .128) or the interaction between the two (p = .140). No significant differences in perceived pleasantness or intensity were expected over time because the design of the experiment was not aimed at examining sensory specific satiety. Therefore, pleasantness and intensity are not discussed in the current manuscript, but are dealt with elsewhere.
fMRI Analysis
Thirty-six fMRI data sets were acquired from 18 subjects. Each subject participated in two scans, one for each condition, hunger and satiety. A one-sample t-test was calculated on the fit coefficient at each voxel. A threshold was then applied to the analyses in order to correct for multiple comparisons (See Methods). Graphical representations of brain activation in response to sucrose, saccharin, caffeine and citric acid can be found in Figures 4-9. A complete list of activated regions and their corresponding talairach coordinates can be found in Tables 2-4. Regions of activation for GMP and NaCl are described in the manuscript. There was no significant activation in the inferior occipital lobe for any stimulus; thus, this region was chosen as the control region.
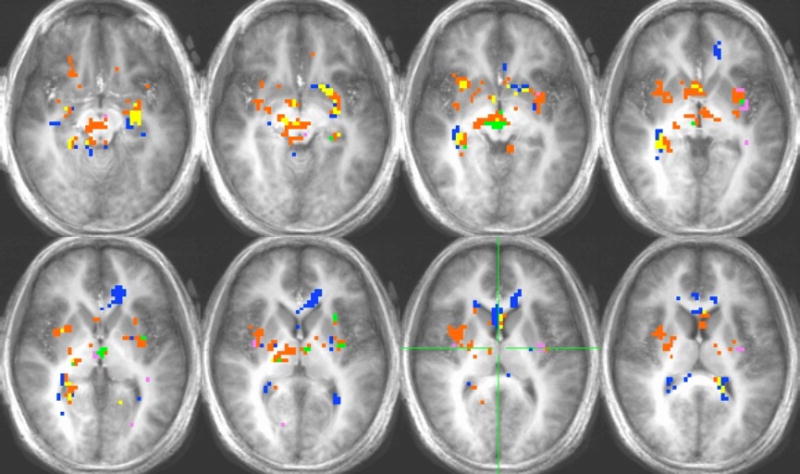
Figure 4.
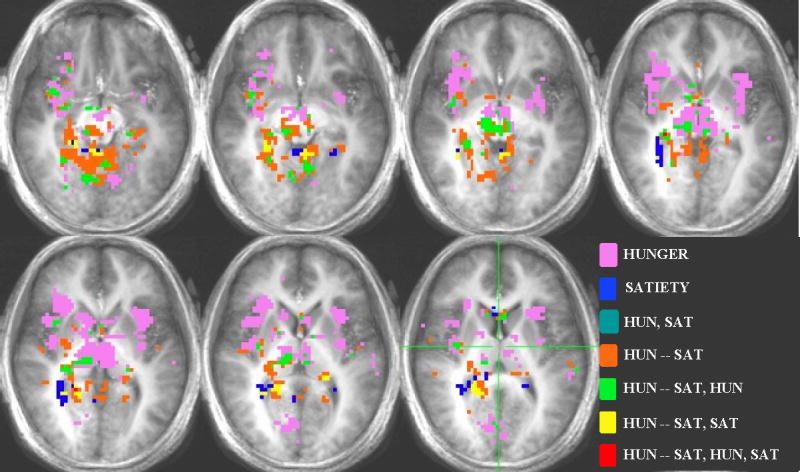
Voxel-by-voxel group analysis showing the main effects in the HUNGER, SATIETY AND HUNGER-SATIETY conditions for sucrose. Each color represents a different main effect and or the overlap of the main effects (See legend). The right side of the brain appears on the left side of the image according to the radiological convention. Activation threshold: P < 0.0005, corrected for multiple comparisons.
Figure 9.
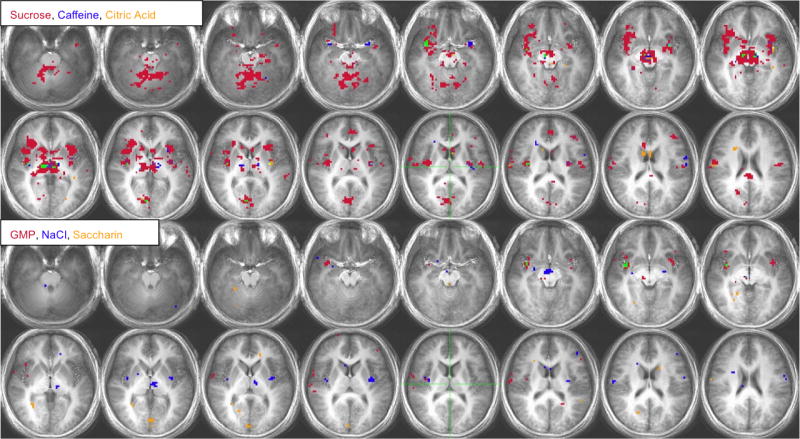
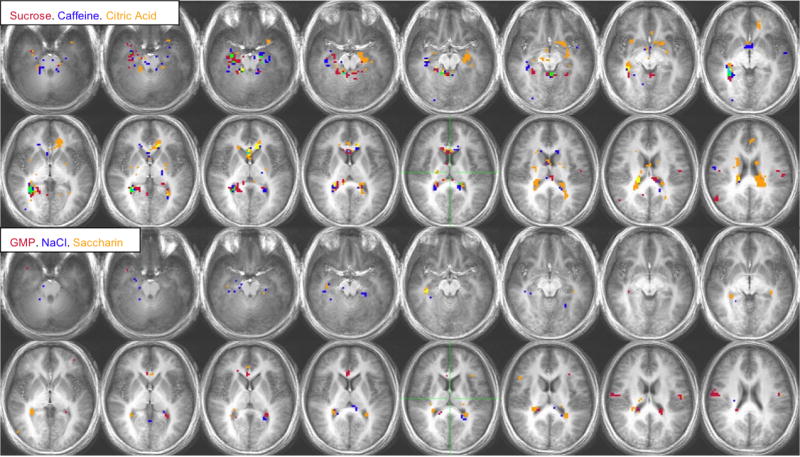
a. Voxel-by-voxel group analysis showing areas of activation in the HUNGER condition for sucrose, caffeine and citric acid (top two rows) and GMP, NaCl and saccharin (bottom two rows). Each color represents a different stimulus or the overlap of the stimuli. Burgundy: sucrose or GMP, Deep Blue: caffeine or NaCl, Green: Sucrose/Caffeine or GMP/NaCl, Orange: Citric Acid or Saccharin, Purple: Sucrose/Citric Acid or GMP/Saccharin, Yellow: Caffeine/Citric Acid or NaCl/Saccharin, Light Blue: Sucrose, Caffeine, Citric Acid or GMP, NaCl, Saccharin. The right side of the brain appears on the left side of the image according to the radiological convention. Activation threshold: P < 0.0005, corrected for multiple comparisons.
b. Voxel-by-voxel group analysis showing areas of activation in the SATIETY condition for sucrose, caffeine and citric acid (top two rows) and GMP, NaCl and saccharin (bottom two rows). See Figure 9a.
Table 2.
Left: HUNGER MINUS SATIETY. Bold type represents the maximum intensity of a cluster generated by the voxel-by-voxel group analysis and extracted with the 3dclust algorithm from AFNI (Cox, 1996). X, Y, and Z coordinates are based according to the Talairach & Tournoux Atlas within AFNI. Normal type represents the regions within the cluster and were manually extracted with help of the AFNI Talairach feature, and Atlases (Mai, Assheuer, & Paxinos, 1997). Abbreviations: L: left, R: right, g: gyrus, OFC: orbitofrontal cortex, BA: brodmann area, n: nucleus, c: cortex, ant: anterior, cing: cingulate, b: body, parahipp: parahippocampus, g.p.: globus pallidus, temp: temporal, opc: operculum, tlrc: talairach coordinates, Max Int: maximum intensity
| Region | Tlrc Coord. | # Voxels | Max. Int. | ||
|---|---|---|---|---|---|
| Sucrose | x | y | z | ||
| R Cerebellum | 14 | -44 | -16 | 990 | 5.16 |
| L Cerebellum | -8 | -43 | -14 | ||
| R Parahipp. | 25 | -44 | -8 | ||
| L Entorhinal c. | -18 | -16 | -13 | ||
| R Thalamus | 10 | -23 | 4 | ||
| R Hippocampus | 31 | -24 | -6 | ||
| L Hippocampus | -32 | -26 | -9 | ||
| R Substantia nigra | 14 | -19 | -6 | ||
| L Substantia nigra | -10 | -22 | -6 | ||
| R Uncus | 28 | 1 | -21 | 81 | 3.17 |
| R Amygdala | 28 | -4 | -19 | ||
| R Parahipp. | 29 | -8 | -15 | ||
| R Entorhinal c. | 32 | 5 | -21 | ||
| R Caudate | 11 | 16 | 9 | 40 | 2.74 |
| L Posterior cing. | -5 | -58 | 13 | 40 | 3.13 |
| R Posterior cing. | 6 | -58 | 13 | ||
| R BA 13 | 40 | 7 | -9 | 27 | 2.75 |
| R Insula | 39 | -3 | 5 | ||
| L Parahipp. | -22 | -34 | -1 | 14 | 1.59 |
| L Thalamus | -20 | -31 | 5 | ||
| L Parahipp. | 16 | 16 | -15 | 11 | 4.18 |
| L Entorhinal c. | -19 | -16 | -15 | ||
| R Inferior frontal g. | 34 | 25 | -15 | 7 | 2.99 |
| R OFC BA 47 | 27 | 27 | -10 | ||
| R Superior temp. g. | 43 | 19 | -18 | 5 | 2.31 |
| Caffeine | |||||
| L/R Thalamus | 8 | -17 | 1 | 20 | 2.78 |
| R Parahipp. | 25 | -42 | 5 | 19 | 2.88 |
| R Hippocampus | 28 | -39 | 0 | ||
| L Caudate | -6 | 3 | 1 | 18 | 2.52 |
| R Hypothalamus | 1 | -4 | -3 | 12 | 2.47 |
| L Hypothalamus | -8 | -4 | -3 | ||
| L Posterior cing. | -4 | -67 | 14 | 10 | 2.50 |
| L Parahipp. | -16 | 13 | -15 | 6 | 2.75 |
| L Entorhinal c. | -20 | -13 | -15 | ||
| L Piriform c. | -19 | -11 | -15 | ||
| Saccharin | x | y | z | ||
| R Parahipp. | 28 | -43 | 2 | 25 | 2.17 |
| R Hippocampus | 28 | -38 | 0 | ||
| R Thalamus | 13 | -28 | 5 | 10 | 1.69 |
| Citric Acid | |||||
| L/R Cerebellum | -2 | -47 | -28 | 284 | 7.24 |
| L Parahipp. | -17 | -11 | -13 | 93 | 3.17 |
| L Hippocampus | -32 | -16 | -13 | ||
| L Amygdala | -21 | -10 | -9 | ||
| L Lentiform n. | -28 | -0 | -1 | ||
| L Insula | -35 | -3 | -1 | ||
| L Entorhinal c. | -16 | -11 | -13 | ||
| R Lentiform n. | 22 | 1 | -1 | 71 | 1.75 |
| R Insula | 36 | 2 | 10 | ||
| R BA 13 | 32 | 13 | -4 | ||
| R OFC BA 47 | 34 | 17 | -5 | ||
| R Parahipp. | 28 | -35 | -4 | 39 | 2.38 |
| R Hippocampus | 30 | -30 | -4 | ||
| R Lentiform n. | 25 | -10 | 5 | 24 | 1.19 |
| L Thalamus | -6 | -10 | -1 | 19 | 2.63 |
| R Caudate | 22 | -34 | 14 | 12 | 2.03 |
| R Inferior frontal g. | -19 | -19 | -9 | 11 | 2.16 |
| R OFC BA 47 | 23 | 28 | -10 | ||
| R Insula | -34 | 1 | -6 | 9 | 1.26 |
| R Hypothalamus | 4 | -1 | -6 | 9 | 3.25 |
| R Amygdala | 25 | -10 | -9 | 6 | 2.46 |
| L Claustrum | -28 | 15 | 4 | 5 | 1.12 |
| GMP | |||||
| N/A | |||||
| NaCl | |||||
| N/A | |||||
Table 4.
SATIETY condition for the comparison of tastant – water. See Table 2
| Region | Tlrc Coord. | # Voxels | Max. Int. | ||
|---|---|---|---|---|---|
| Sucrose | x | y | z | ||
| R Caudate | 34 | -31 | -1 | 43 | -1.26 |
| R Hippocampus | 31 | -38 | 0 | ||
| R Parahipp. | 23 | -22 | -16 | 42 | -2.70 |
| R Amygdala | 28 | -7 | -16 | ||
| R Hippocampus | 27 | -11 | -15 | ||
| R Lingual g. | 17 | -49 | 2 | 34 | -1.75 |
| R Parahipp. | 17 | -44 | 5 | ||
| L Culmen | -1 | -43 | -4 | 33 | -2.73 |
| R Caudate | 2 | 17 | 8 | 16 | -2.09 |
| R Thalamus | 11 | -34 | 8 | 5 | -1.94 |
| L Postcentral g. | -46 | -13 | 23 | 5 | 2.24 |
| L Rolandic opc. | -50 | -13 | 17 | ||
| R Superior temp. g. | 56 | -61 | 23 | 5 | -1.64 |
| R Angular g. | 53 | -62 | 23 | ||
| Citric acid | |||||
| R Caudate tail | 17 | -19 | 23 | 75 | -1.90 |
| L Caudate tail | -13 | -22 | 23 | 57 | -1.93 |
| L Ant. cing. | -9 | 36 | 2 | 47 | -1.61 |
| L Parahipp. | -22 | -21 | -11 | 42 | -2.88 |
| L Amygdala | -18 | -8 | -12 | ||
| L Hippocampus | -28 | -16 | -10 | ||
| R Cerebellum | 2 | -43 | -28 | 20 | -4.28 |
| L N. accumbens | -10 | 11 | -7 | 18 | -1.79 |
| L Lentiform n | -20 | 10 | -5 | ||
| L OFC BA 47 | -30 | 14 | -16 | 6 | -2.76 |
| L Medial frontal g | -4 | 41 | 23 | 5 | 0.99 |
| L Ant. cing. | -1 | 37 | 23 | ||
| Saccharin | x | y | z | ||
| R Caudate | 26 | -35 | 11 | 20 | -1.49 |
| R Hippocampus | 29 | -40 | 2 | 14 | -1.47 |
| R Parahipp. | 38 | -22 | -13 | 10 | -1.46 |
| R Precentral g. | 59 | -10 | 26 | 7 | 3.24 |
| Caffeine | |||||
| R Hippocampus | 29 | -43 | 8 | 61 | -1.52 |
| R Parahipp. | 29 | -41 | -3 | ||
| R Caudate tail | 28 | -39 | 8 | ||
| L Ant. cing. | -13 | 29 | 41 | 21 | -1.25 |
| R Parahipp. | 37 | -27 | -11 | 17 | -1.68 |
| R Caudate head | 2 | 14 | 5 | 16 | -1.92 |
| L Caudate head | -4 | 8 | -1 | 11 | -1.76 |
| R Culmen | 17 | -31 | -22 | 9 | -2.58 |
| R Caudate body | 17 | -25 | 20 | 9 | -1.22 |
| R Precentral g. | 56 | -7 | 23 | 9 | 2.00 |
| L Parahipp/Piriform | -16 | -10 | -16 | 7 | -2.09 |
| L Amygdala | -20 | -8 | -16 | ||
| L Cerebellum | -1 | -40 | -7 | 7 | -2.72 |
| R Culmen | 11 | -37 | -10 | 6 | -1.97 |
| R Parahipp. | 32 | -7 | -19 | 5 | -1.15 |
| R Culmen | 17 | -34 | -16 | 5 | -2.7 |
| GMP | |||||
| R Precentral g. | 62 | -7 | 23 | 17 | 2.416 |
| R Postcentral g. | 59 | -11 | 20 | ||
| R Rolandic Operculum | 60 | -7 | 19 | ||
| R Ant. cing. | 2 | 32 | 11 | 13 | -1.767 |
| L Postcentral g. | -49 | -13 | 20 | 6 | 1.4 |
| NaCl | |||||
| Parahippocampus | 41 | -28 | -13 | 6 | -1.452 |
Contrasts
Sucrose
Brain activation in response sucrose for the hunger-satiety contrast and sucrose vs. water contrasts for the hunger and satiety conditions was localized in several areas (Figure 4). In particular, significant differences in activation for the hunger-satiety contrast were found in the insula, OFC BA 47, OFC BA 13, thalamus, hippocampus, parahippocampus, amygdala, and substantia nigra (Table 2). In the hunger condition there was significant activation relative to water in the insula, rolandic and frontal operculum, OFC BA 47, OFC BA 11, thalamus, parahippocampus, hypothalamus, amygdala, substantia nigra, and anterior cingulate (Table 3). Activation in the sated condition was found in the rolandic operculum, amygdala, anterior cingulate, hippocampus and parahippocampus (Table 4).
Table 3.
HUNGER condition for the comparison of tastant – water. See Table 2
| Region | Tlrc Coord. | # Voxels | Max. Int. | ||
|---|---|---|---|---|---|
| Sucrose | x | y | z | ||
| R Insula | 39 | 5 | -5 | 384 | 3.19 |
| BA 13 | 37 | 11 | -9 | ||
| R Frontal opc. | 43 | 10 | 8 | ||
| R OFC BA 47 | 37 | 17 | -9 | ||
| R Amygdala | 28 | -8 | 10 | ||
| R OFC BA 11 | 25 | 33 | -13 | ||
| R Parahipp. | 30 | -7 | -11 | ||
| R Middle front. g. | 38 | 35 | -4 | ||
| R Claustrum | 28 | 18 | 2 | ||
| R Thalamus | 10 | -13 | 3 | 357 | 2.33 |
| L Thalamus | -8 | -23 | 4 | ||
| R Lentiform n. | 11 | 2 | -1 | ||
| R Hypothalamus | 8 | -4 | -5 | ||
| R Caudate | 13 | 17 | 2 | ||
| R Substantia nigra | 7 | -14 | -7 | ||
| L Substantia nigra | -6 | -13 | 8 | ||
| L/R Cerebellum | 8 | -67 | -13 | 307 | 3.01 |
| L Insula | -34 | 11 | 14 | 162 | 2.22 |
| L OFC BA 47 | -34 | 17 | 14 | ||
| L Lentiform n. | -23 | -1 | -4 | ||
| R Cuneus | 5 | -73 | 11 | 68 | 2.66 |
| L Caudate | -8 | 11 | 5 | 27 | 1.58 |
| L Culmen | -13 | -67 | -10 | 26 | 2.35 |
| L Cing. g. | -3 | -32 | 26 | 22 | 2.38 |
| L Postcentral g. | -52 | -13 | 14 | 19 | 1.91 |
| L Rolandic opc. | -53 | -14 | 18 | ||
| L Lentiform n. | -17 | -1 | 5 | 18 | 1.19 |
| L Sup. Temp. g. | -42 | 2 | -13 | 15 | 2.38 |
| L Middle frontal g. | -43 | 35 | 20 | 13 | 2.47 |
| R Rolandic opc. | 62 | -7 | 17 | 13 | 3.23 |
| L Medial frontal g. | -4 | 46 | 11 | 9 | 1.40 |
| L Ant. cing. | -2 | 42 | 11 | ||
| R Precuneus | 17 | -61 | 26 | 9 | 1.24 |
| R Ant. cing. | 8 | 26 | 20 | 7 | 0.84 |
| L Parahipp. | -25 | -25 | -16 | 6 | 1.72 |
| L/R Cerebellum | -7 | -43 | -34 | 5 | 1.77 |
| R Fusiform g. | 29 | -55 | -10 | 5 | 1.63 |
| R Lingual g. | 17 | ||||
| Saccharin | x | y | z | ||
| R Cuneus | 5 | -89 | 8 | 7 | 3.60 |
| R Lingual g. | 2 | -76 | 5 | 6 | 2.23 |
| R Thalamus | 8 | -13 | -4 | 14 | 1.61 |
| Caffeine | |||||
| R Thalamus | 8 | -13 | -4 | 14 | 1.61 |
| R Substantia nigra | 7 | -13 | 7 | ||
| R Thalamus | -7 | -16 | 2 | 13 | 1.31 |
| R Insula/BA 13 | -33 | 6 | -10 | 9 | 2.38 |
| L Insula/BA 13 | 38 | 11 | -10 | 6 | 1.71 |
| Citric Acid | |||||
| L Claustrum | -34 | -7 | 8 | 14 | 1.25 |
| L Insula | -31 | -14 | 14 | ||
| R Red n. | 8 | -19 | -5 | 10 | 1.54 |
| R Thalamus | 4 | -14 | 1 | ||
| L Insula | -37 | -1 | -1 | 6 | 1.5 |
| R Caudate body | 11 | 7 | 19 | 5 | 1.2 |
| GMP | |||||
| R Insula | 41 | 2 | -4 | 27 | 1.86 |
| L Insula | -37 | 5 | -4 | 13 | 1.232 |
| R Precentral g. | 62 | -4 | 26 | 12 | 3.04 |
| R Postcentral g. | 56 | -17 | 26 | ||
| R BA 13 | 35 | 8 | -12 | 7 | 2.194 |
| R Superior temp. g. | 39 | 2 | -12 | ||
| R Precentral g. | 59 | 2 | 8 | 6 | 2.1 |
| NaCl | |||||
| L Thalamus | -1 | -16 | 5 | 15 | 1.252 |
| L Insula | -34 | -10 | 11 | 14 | 1.374 |
| R Mammillary b. | 2 | -9 | -7 | 12 | 1.8 |
| L Mammillary b. | 2 | -11 | -7 | ||
| R Substantia nigra | 7 | -13 | -7ß | ||
| R Insula | 41 | 2 | -4 | 9 | 1.6 |
Saccharin
Activation in response to saccharin for the hunger-satiety contrast and saccharin vs. water contrasts for the hunger and satiety conditions can be found in Figure 5. Of particular interest to the present study, significant differences in activation for the hunger-satiety contrast were found in the hippocampus, parahippocampus and thalamus (Table 2). Activation in the sated condition was found in the hippocampus and parahippocampus (Table 4).
Figure 5.
Voxel-by-voxel group analysis showing the main effects in the HUNGER, SATIETY AND HUNGER-SATIETY conditions for saccharin. See Figure 4.
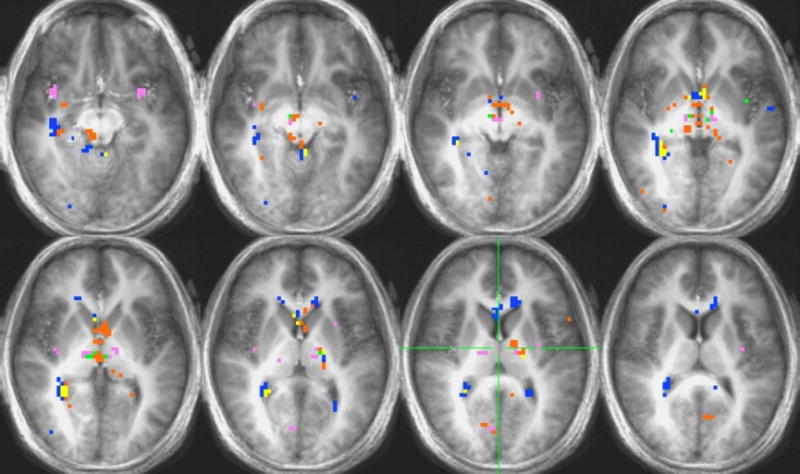
Caffeine
Activation in response to caffeine for the hunger-satiety contrast and caffeine vs. water contrasts for the hunger and satiety conditions can be found in Figure 6. Significant differences in activation for the hunger-satiety contrast were found in the thalamus, hippocampus, parahippocampus, and hypothalamus (Table 2). Activation in the hunger condition was found in the insula, thalamus and substantia nigra (Table 3). Activation in the satiety condition was found in the hippocampus, parahippocampus, anterior cingulate, rolandic operculum, and amygdala (Table 4).
Citric Acid
Activation in response to citric acid for the hunger-satiety contrast and citric acid vs. water contrasts for the hunger and satiety conditions can be found in Figure 7. Significant differences in activation for the hunger-satiety contrast were found in the insula, OFC BA 47, OFC BA 13, hippocampus, parahippocampus, thalamus, hypothalamus, and amygdala (Table 2). Activation for the hungry condition was found in the insula, thalamus and substantia nigra (Table 3). Activation in the satiety condition was found in the hippocampus, parahippocampus, anterior cingulate, amygdala, and OFC BA 47 (Table 4).
Figure 7.
Voxel-by-voxel group analysis showing the main effects in the HUNGER, SATIETY AND HUNGER-SATIETY conditions for citric acid. See Figure 4.
Guanosine 5’-monophosate (GMP)
There were no significant differences in activation in response to GMP for the hunger-satiety contrast. Activation in response to GMP vs. water for the hunger condition was found in the insula and activation in the satiety condition was found in the rolandic operculum and anterior cingulate.
Sodium Chloride (NaCl)
There were no significant differences in activation in response to NaCl for the hunger-satiety contrast. Activation in response to NaCl vs. water for the hunger condition was found in the insula, thalamus, and substantia nigra (Table 3). Activation in the satiety condition was found in the parahippocampus (Table 4).
Region of Interest Analysis
Two repeated measures ANOVAs (RM-ANOVA) were conducted in order to examine the effect of hunger and satiety on brain activation in response to taste stimuli, with ROI, stimulus, hemisphere, and physiology as the within subjects factors and BMI as a covariate. In the first RM-ANOVA, all six stimuli were included. There was a significant ROI by physiology interaction [F= 2.026, p < 0.05, partial η2 = .122]. Newman-Keuls Multiple Range test was used to probe the significant interaction. There was significantly greater activation during the satiety condition in primary (inferior and superior insulae) and secondary (OFC 11 and OFC 47) taste regions relative to regions involved in processing eating behavior (hypothalamus), affect (amygdala), and memory (hippocampus, parahippocampus, and entorhinal cortex). Following the same pattern, all of these regions, with the exception of the superior insula, exhibited significantly greater activation in the hunger condition relative to the satiety condition.
The second RM-ANOVA was conducted in order to examine the effect of hunger and satiety on brain activation in response to stimuli representing the four basic taste qualities (Figure 9). Thus the stimuli were chosen based on quality, including sweet (sucrose), sour (citric acid), salty (NaCl), and bitter (caffeine). There was a significant ROI by hemisphere interaction [F = 1.848, p < 0.05, partial η2 = .122] and a significant physiology by stimulus by ROI interaction [F = 1.608, p < 0.05, partial η2 = .091]. Newman-Keuls Multiple Range tests were used to probe the significant interactions. Consistent with the ROI by physiology interaction and the group analysis, the same regions were modulated by physiological condition (e.g., amygdala, OFC, 11, and so forth, Figure 9). In addition, there was statistically greater activation in the satiety condition for sucrose relative to the activation in the satiety condition for the other stimuli (p < .05).
Discussion
To date, the majority of neuroimaging studies examining the effects of hunger and satiety have focused mainly on the effect of sensory specific satiety for complex flavor stimuli (Del Parigi et al., 2002a; Del Parigi et al., 2002b; Kringelbach et al., 2003; Gautier et al., 1999; O’Doherty, et al., 2002; Small et al., 2001) and olfactory stimuli (Gottfried, et al., 2003; O’Doherty et al., 2000). Sensory specific satiety experiments that use a complex flavor stimulus as the satiety inducer and the stimulus, elicit responses from both taste and olfactory systems and the corresponding reward activation in cortical regions reflects activity in both systems (de Araujo et al., 2003c). Using flavor stimuli has very strong ecological validity and provides excellent information about cortical processing of complex chemosensory stimuli, yet limits the information regarding the taste system. In contrast, the present study sought to separate taste from flavor and thus investigated brain regions activated in response to pure gustatory stimulation during two physiological conditions, hunger and satiety using six stimuli with different qualities.
While there are clear consistencies in activation across physiological condition, physiological dependent activation is also differentially modulated in different cortical taste regions in response to taste stimuli (Figure 8, Figure 9a and b). The most striking finding, demonstrated by the group and the ROI analyses, is the robust activation in response to sucrose relative to the other stimuli. Specifically, sucrose produced significantly greater global activation, particularly in the hunger state, than other tastes whether they were sweet (the artificial sweetener saccharin), bitter (caffeine) or another taste quality. Frank et al., (2008) recently reported a similarly greater activation to sucrose than to sucralose (Splenda, another artificial sweetener), in a satiated condition. Artificial sweeteners do not have nutritive value and, therefore, the brain may respond less because the taste of such a stimulus has been conditioned to a stimulus that does not reward with calories. In the present study, it is also possible that the slight bitter side taste that accompanies higher concentrations of saccharin (Schiffman et al., 1995) contributed to the brain response. It is unlikely due to stimulus intensity differences since perceived intensity ratings were 39.8 ± 3.8 for saccharin, 37.8 ± 5.4 for sucrose (M ± SEM). This effect may be related to the sucrose’s ecological importance to eating behavior. These results suggest that the taste system is sensitive to the internal cues from the body, which may aid in the regulation of feeding behavior.
Figure 8.
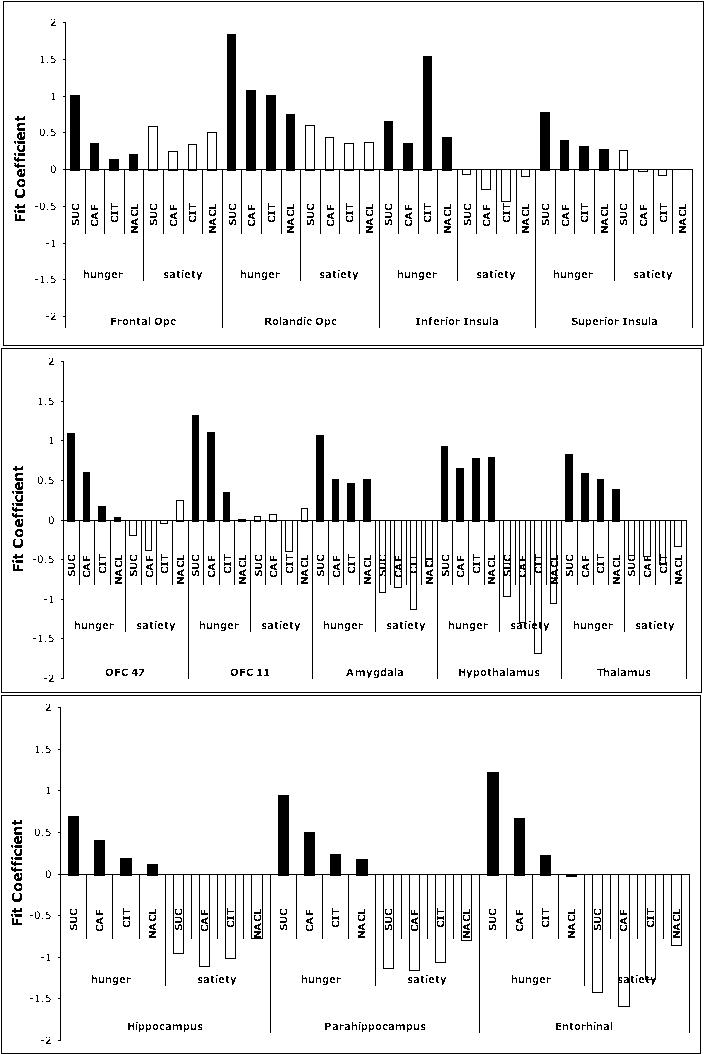
Fit coefficients corresponding to brain activation for a three way interaction between stimulus (suc: sucrose; caf: caffeine; cit: citric acid; NaCl (sodium chloride), physiology (hunger and satiety), and ROI.
At the group level, various taste stimuli produced significant differences in activation in the hunger minus satiety contrast within the thalamus, hippocampus, and parahippocampus; less consistent activation was found within the insula, OFC BA 47, amygdala, anterior cingulate gyrus and substantia nigra. Globally, brain activation in the hunger condition produced more robust activation to pure taste stimuli relative to water in regions associated with sensory experiences and activation in response to pure taste stimuli in the satiety condition was decreased relative to water in regions associated with emotion and motivation. More specifically, the hunger condition produced consistent activation across taste stimuli that differed in quality (e.g. sweet, bitter, salty, sour, umami) within the insula and thalamus, which are involved in the processing of taste, and the substantia nigra, which is implicated in attentional processing of reward value. This pattern of activation suggests that the motivational state of hunger may elicit activation from brain regions involved in processing sensory information and reward value relative to regions involved in the actual processing of reward per se. From an evolutionary standpoint, activation within these regions may ensure that the tastes being consumed are not potentially dangerous and that what the organism ingests is, in fact, rewarding.
Interestingly, the satiety condition produced less activation for taste stimuli in limbic regions including the parahippocampus, hippocampus, amygdala, and anterior cingulate gyrus. These findings suggest that in the satiety condition, processing taste stimuli produces less activation relative to water in regions involved in emotion and motivation, which may aid in the termination of food consumption that is associated with the motivation for and emotional value of the stimulus. Decreased activation to taste in the limbic regions is in parallel to allesthesia and sensory specific satiety, in that physiologically and behaviorally, food recently consumed influences the motivation to continue with or terminate food consumption. The ROI analysis supports the group level analysis and provides a more precise understanding of the physiological effects of hunger and satiety on the human gustatory system. ROI analysis demonstrated that in the satiety condition, primary and secondary taste regions elicit greater activation in response to taste stimuli relative to regions involved in processing affective, memory and eating behavior. In addition, these same regions (e.g., inferior insula, amygdala, and so forth) have significantly greater activation in the hunger condition than in the satiety condition, with the exception of the superior insula. Examination of insula subregions, based on anatomical and functional distinctions, contributes to the elucidation of the underlying processes that may occur as a result of the physiological condition of the participant and/or reward related contingencies.
Insula
The insular cortex is recognized as part of the primary taste cortex in the non-human primate electrophysiology (Yaxley et al., 1988; Yaxley et al., 1990; Scott and Plata-Salaman, 1999) and human neuroimaging literatures (Zald et al., 2002; Cerf et al., 1998; Cerf-Ducastel et al., 2001b; de Araujo et al., 2003a; Faurion et al., 1999; Frank et al., 2008; Francis et al., 1999; Kringelbach et al., 2004; O’Doherty et al., 2001).
Considerable research has also examined the effect of physiological state on activation in response to taste stimuli within the insula. Rolls and colleagues demonstrated that neuronal responses to taste stimuli within the frontal operculum and insular cortex of the macaque monkey were not modulated by physiological condition (Rolls et al., 1988; Yaxley et al., 1988). More recently, a number of studies in the human neuroimaging literature suggest that there are motivation/reward related differences in activation within the insular cortex in response to food-related stimuli that include both taste and olfactory components (Small et al., 2001; Gottfried et al, 2003; Uher et al., 2006).
One possible explanation for the inconsistencies observed in the effect of physiological state on activity of the insular cortex between non-human primates and human primates may be a result of differences in data collection procedures. For example, electrophysiological recordings from non-human primates show activation from single neurons, whereas, human neuroimaging techniques typically average activation over substantially larger anatomically defined regions, such as the insular cortex. Augustine (1996) has shown anatomically distinct regions in the insula cortex. In line with these findings, human neuroimaging and clinical studies on taste have suggested that sub-regions within the insula may sustain different functions in gustatory processing, such as taste (Cerf et al., 1998; Faurion et al., 1999, Prichard, 1999) somatosensory stimulation (Pardo et al., 1997; Cerf-Ducastel et al., 2001b), thirst (de Arauo et al., 2003b; Denton, et al., 1999) and hunger (Tataranni et al., 1999). There may also be real across species differences. Interestingly, Scott and Small (2008) have recently articulated true interspecies differences in pontine taste processing that suggest modulation of taste information by hedonic information at very different levels of the taste system in rodents and primates.
In the current study, at the group level, there was significantly more activation for sucrose and citric acid in the hunger condition than in the satiety condition. Additionally, consistent across five of the six taste stimuli, greater activation was observed in the hunger condition for taste relative to water. For the ROI analysis, activation in the inferior insula was modulated by the physiological state of the participant; however, superior insula did not show similar modulation. A unique strength of the current design is the ability to dissociate responses to different pure taste stimuli that represent a number of taste qualities. The ROI analysis demonstrated that activation between the inferior and superior insulae is modulated by physiological state and taste stimulus.
Taken together, these findings suggest that the insular cortex may be receiving not only sensory signals but also introspective signals of motivation and/or hedonic value and that these effects are more clearly differentiated when examining the insula based on anatomical and functional distinctions. The current findings provide a critical foundation for understanding the multi-modal nature of eating behavior and how motivational/reward value affects brain activation.
Thalamus
In the current study, there was significant positive activation within the thalamus in the hunger condition in response to sucrose, caffeine, NaCl, and citric acid; however, there was no significant activation in the sated condition. Single neuron recordings from non-human primates have demonstrated that the ventroposteromedial thalamic nucleus (VPMpc) responds to gustatory, thermal, and tactile stimulation (Pritchard et al., 1989). It has been suggested that the VPMpc may play a role in eating behavior given the efferent projections from the VPMpc to regions in the primary and secondary taste cortices (Pritchard et al., 1986). Komura and colleagues (Komura et al., 2001) reported that single neurons within the thalamus respond to rewarding stimuli. In addition, human neuroimaging studies have reported activation within the thalamus in response to gustatory stimulation (Faurion et al., 1999; Kobayashi et al., 2004; Zald et al., 1998) and activation that is modulated by hunger and satiety (Gautier et al., 1999; Tataranni et al., 1999). Taken in combination, these findings support the role of the thalamus in processing taste stimuli and suggest that activation in response to taste stimuli is partially modulated by reward value.
Hippocampus/Parahippocampus
In the satiated condition, there was a decrease in activation in the parahippocampus for all stimuli, except GMP, in comparison to water and a decrease in activation in the hippocampus for sucrose, saccharin, caffeine, and citric acid. Research in rodents has found that selective lesions in the hippocampus result in an impaired ability to discriminate between interoceptive states of hunger and satiety (Davidson and Jarrard, 1993). Previous neuroimaging studies have shown that the hippocampal and parahippocampal gyri are implicated in food craving (Pelchat et al., 2004), the physiological state of hunger (Tataranni et al., 1999), when motivationally relevant food objects are shown (LaBar et al., 2001), and when tasting a liquid meal (Gautier et al., 1999). This suggests that activation in the hippocampal and parahippocampal gyri may be modulated by the interoceptive signaling of satiety, which may aid in the ability to engage in normal feeding behavior (i.e. food consumption and termination). Engagement of neuronal populations in these areas that subserve memory function suggests that taste stimuli are appreciated in the context of previous experience with a stimulus, a fact that may have implications for clinical populations with disordered eating as well as avoiding the ingestion of harmful substances.
Amygdala
In the group and ROI analyses, there were significant differences in activation between the hunger and satiety conditions within the amygdala for both sucrose and citric acid, with greater activation in the hunger condition relative to the sated condition. It is suggested that the amygdala may be responsible for relaying motivational significance, possibly influenced by taste stimuli and physiological state (Yan and Scott, 1996). As in non-human primate studies, human neuroimaging studies reinforce the notion that the amygdala’s response to gustatory stimuli is modulated by satiety. LaBar and colleagues (2001) examined brain activation in response to pictures of food when participants were hungry and sated and demonstrated increased activation in the amygdala in the hungry condition relative to the sated condition. Furthermore, the anticipation of a primary taste reward in a hungry state, investigated by O’Doherty et al. (2002), resulted in an increase in activation in the amygdala during reward anticipation and not during reward receipt, suggesting that different regions are involved in processing anticipation and receipt of rewarding stimuli. The amygdala is also associated with a number of different affective processes, such as food craving (Pelchat et al., 2004) hunger-enhanced memory (Morris and Dolan, 2001), and increased incentive to food items (Arana et al., 2003).
Activation within the amygdala in the sated condition was decreased in response to caffeine and citric acid. Both animal and neuroimaging studies have shown that neuronal response within the amygdala is associated with pleasant and unpleasant gustatory stimulation (Scott et al., 1993; O’Doherty et al., 2001).
Orbitofrontal Cortex
There were significant differences in activation between the hunger and satiety conditions within the orbitofrontal cortex (OFC) Brodmann area (BA) 47 for sucrose and citric acid. At the group level, brain activation in the OFC 47 was found in response to sucrose during the hunger condition and failed to reach statistical significance in the satiated condition. No other stimulus exhibited as robust a signal within the OFC as sucrose, which may be related to the fact that of all six stimuli, sucrose was the only stimulus that was perceived by all participants as significantly pleasant. Interestingly, citric acid was perceived as moderately unpleasant and there was a significant decrease in activation in the sated condition within the OFC 47.
The current findings in the OFC are consistent with the non-human primate and human literature. Single neuron recordings from non-human primates demonstrated that regions within the caudolateral orbitofrontal cortex (OFC) respond to gustatory, olfactory, and multimodal stimulation (Rolls et al., 1990) and are modulated by hunger and satiety (Rolls et al., 1989). Human neuroimaging studies have demonstrated that the OFC responds to aversive and pleasant tastants (Zald et al., 1998; Francis et al., 1999; O’Doherty et al., 2002; Kringelbach et al., 2004). Moreover, activation within the OFC was found in response to flavor stimuli (Small et al., 2001; Gautier et al., 1999; Kringelbach et al., 2003), food-related olfactory stimuli (O’Doherty et al., 2000; Cerf-Ducastel and Murphy, 2001a) and was modulated by satiety (Tataranni et al., 1999; de Araujo et al., 2003b; Gottfried et al., 2003). In addition, activation within the OFC is associated with incentive, motivation, and goal selection (Arana et al., 2003).
The multi-modal functioning of the OFC substantiates its role in the formation of flavor perception, whereas the modulation of its activity by satiety supports the role of the OFC in the evaluation of pleasantness/motivation. In combination, this provides further evidence that the OFC functions as an integration region where flavor perception and motivation interact.
Anterior Cingulate Gyrus
Activation in the anterior cingulate gyrus in the sated condition was significantly decreased in response to sucrose, caffeine, GMP, and citric acid relative to water. Previous studies have reported that the anterior cingulate responds to aversive and pleasant taste stimuli (de Araujo and Rolls, 2004; Zald et al., 1998; Faurion et al., 1998). The anterior cingulate gyrus has also been shown to be associated with energy content and the palatability of foods (de Araujo and Rolls, 2004). Additionally, de Araujo and colleagues (de Araujo et al., 2003b) demonstrated that activation in the anterior cingulate gyrus, independent of the stimulus, was greater in a thirsty condition relative to a sated condition. These findings suggest that activation in the anterior cingulate gyrus may be modulated by motivational states.
Substantia nigra
In the current study, activation within the substantia nigra was found in response to sucrose, citric acid, and caffeine in comparison to water in the hungry condition. However, activation failed to reach statistical significance in the satiated condition. Research has shown that the substantia nigra is involved in anticipation of reward related stimuli found in both animal (Schultz, 1998) and human neuroimaging studies (O’Doherty et al., 2002; Kirsch et al., 2003). Moreover, Kirsch and colleagues demonstrated that activation within the substantia nigra is modulated by motivation, i.e., the greater the reward the stronger the activation. Therefore, the absence of significant activation within the satiety condition could be interpreted as a decrease in motivation as a result of being satiated in comparison to the motivating state of hunger induced by a 12 hour fast.
Regions of Interest Analysis
Two main analyses were conducted for the ROI analysis. In the first RM-ANOVA, all six stimuli were included. Newman-Keuls Multiple Range Test revealed that, in the satiety condition, the primary (inferior and superior insulae) and secondary (OFC 11 and OFC 47) taste regions exhibited significantly greater brain activation in response to all stimuli than regions involved in processing eating behavior (hypothalamus), affect (amygdala), and memory (hippocampus, parahippocampus and entorhinal cortex), p < .05. These same regions demonstrated significantly greater activation in the hunger condition than in the satiety condition, with the exception of the superior insula. Specifically, for all taste stimuli, brain activation was significantly greater in the hunger condition than in the satiety condition in the hypothalamus, which is involved in metabolic processes (e.g., regulation of hunger and thirst; Elmquist et al., 1998). In addition, activation was greater in the hippocampus, parahippocampus and entorhinal cortices that have been shown to be involved in hunger, satiety, and various components of memory processing (e.g., encoding, retrieval, and familiarity; for a review, see Squire et al., 2004). As expected, there was greater activation within the amygdala during the hunger condition relative to the sated condition, which has been shown to be involved in anticipation (Knutson et al., 2001) and receipt (Elliott et al., 2003) of rewarding and non-rewarding stimuli.
In the second RM-ANOVA, activation to the four prototypical tastants (sweet, sour, salty, and bitter) were included in the analysis. There was a significant three-way interaction between physiology, stimulus, and ROI (Figure 8). As can be seen in Figure 8 and supported statistically by Newman Keuls Multiple Ranges Test, p < .05, similar patterns of activation emerge from caffeine, NaCl and citric acid. There is statistically greater activation in the hunger condition relative to the satiety condition within regions involved in primary taste regions and those involved in higher order gustatory processing (affect, eating behavior, memory). Interestingly, the pattern of brain activation in response to sucrose was atypical in comparison to the other stimuli. Specifically, brain activation was significantly greater in response to sucrose than to the other stimuli.
The data suggest that a number of regions involved in taste processing are modulated by the physiological state of the participant. It should also be noted that qualitatively different stimuli produce variable patterns of activation that are physiologically dependent. These findings underscore the importance of including qualitatively different stimuli in order to extract the functional role of regions involved in processing gustatory stimuli as well as flavor stimuli.
In the present experiment, water was used as the baseline comparison. Water was chosen as the baseline for a number of reasons. First, there exists a significant body of research for comparison; second, because water was used as the solvent for the tastants; and finally, water was used as the rinse between stimuli. There is a very large psychophysical literature on the taste of solutions produced in this way. However, we note that previous fMRI research has demonstrated significant activation in primary gustatory cortex during the presentation of water (Zald and Pardo, 2000; de Araujo et al., 2003b). Additionally, de Araujo and colleagues found that brain activation in response to water yields patterns of activation that are similar to those evoked during the presentation of prototypical tastants (e.g., glucose and NaCl). Activation of the cortical gustatory regions is not limited to tastants. For example, olfactory stimuli delivered retronasally produce patterns of activation in cortical gustatory areas, similarly to those produced by taste stimuli (Cerf-Ducastel and Murphy, 2001; Small et al., 2005), which may also suggest that these regions are involved in somatosensory and motor processing during oral stimulation, irrespective of the stimulus. One could hypothesize then, that even a tasteless solution would engage the same gustatory regions. In fact, a recent study by Veldhuizen et al., 2007, demonstrated that paying attention to a tasteless solution administered to the oral cavity produced activation within the insula and operculum. These findings are concordant with behavioral observations of taste-smell confusions when odorants are presented in aqueous solution in the oral cavity (Murphy et al., 1977). In the present experiment, activation to taste stimuli was contrasted with activation to water. This does present a limitation. However, any influence of using water as the baseline in the analysis can be expected to underestimate the size of effects in those cases where water alone would produce activation.
Conclusions
The physiological state of the subject modulated brain activation within specific regions in response to a range of pure taste stimuli. In particular, the inferior insula was modulated by physiological condition, whereas, the superior insula was not. The most striking finding was the robust activation for sucrose relative to other stimuli, particularly in the hunger state. Differences in activation across physiological condition and stimuli suggest that other motivational (i.e., wanting) and hedonic (i.e., liking) factors, as well as memory for previous experience with a stimulus, result in the recruitment of additional neuronal populations and thereby contribute to the pattern of brain activation. These findings highlight the importance of using stimuli that vary in quality when examining neural correlates of reward and emotion, particularly in clinical populations that may have complex relationships with taste stimuli. Understanding how the physiological states of hunger and satiety modulate the taste system provides a necessary foundation for the complete elucidation of the role of hunger and satiety in the more global perception that is flavor. The current experiment also provides a foundation on which comparisons can be made regarding neural correlates of chemosensory function and hunger and satiety in healthy young adults and clinical populations with eating disorders such as anorexia and bulimia.
Acknowledgments
This research was supported by NIH grant R01AG04085 to C.M. and R03DC05134 to B.C.D. We thank Nobuko Kemmotsu and Drs. Rick Buxton and Giedrius Buracas for fMRI expertise, Drs. Paul Gilbert and Wendy Smith for assistance, and an anonymous reviewer for especially insightful comments on the manuscript.
Footnotes
Publisher's Disclaimer: This is a PDF file of an unedited manuscript that has been accepted for publication. As a service to our customers we are providing this early version of the manuscript. The manuscript will undergo copyediting, typesetting, and review of the resulting proof before it is published in its final citable form. Please note that during the production process errors may be discovered which could affect the content, and all legal disclaimers that apply to the journal pertain.
References
- Arana FS, Parkinson JA, Hinton E, Holland AJ, Owen AM, Roberts AC. Dissociable contributions of the human amygdala and orbitofrontal cortex to incentive motivation and goal selection. The Journal of Neuroscience. 2003;23(29):9632–9638. doi: 10.1523/JNEUROSCI.23-29-09632.2003. [DOI] [PMC free article] [PubMed] [Google Scholar]
- Augustine JR. Circuitry and functional aspects of the insular lobe in primates including humans. Brain Research Reviews. 1996;22:229–244. doi: 10.1016/s0165-0173(96)00011-2. [DOI] [PubMed] [Google Scholar]
- Bartoshuk LM, Duffy VB, Green BG, Hoffman HJ, Ko CW, Lucchina LA, Marks LE, Snyder DJ, Weiffenbach JM. Valid across-group comparisons with labeled scales: the gLMS versus magnitude matching. Physiology & Behavior. 2004;82(1):109–114. doi: 10.1016/j.physbeh.2004.02.033. [DOI] [PubMed] [Google Scholar]
- Bartoshuk LM, McBurney DH, Pfaffmann C. Taste of Sodium Chloride solutions after adaptation to Sodium Chloride: Implications for the “Water Taste”. Science. 1964;143:967–968. doi: 10.1126/science.143.3609.967. [DOI] [PubMed] [Google Scholar]
- Buracas GT, Boynton GM. Efficient design of event-related fMRI experiments using M-sequences. NeuroImage. 2002;16(3 Pt 1):801–813. doi: 10.1006/nimg.2002.1116. [DOI] [PubMed] [Google Scholar]
- Burton MJ, Rolls ET, Mora F. Effects of hunger on the responses of neurons in the lateral hypothalamus to the sight and taste of food. Experimental Neurology. 1976;51(3):668–677. doi: 10.1016/0014-4886(76)90189-8. [DOI] [PubMed] [Google Scholar]
- Cabanac M. Physiological role of pleasure. Science. 1971;173(2):1103–1107. doi: 10.1126/science.173.4002.1103. [DOI] [PubMed] [Google Scholar]
- Cabanac M, Duclaux R. Specificity of internal signals in producing satiety for taste stimuli. Nature. 1970;227(5261):966–967. doi: 10.1038/227966a0. [DOI] [PubMed] [Google Scholar]
- Cain WS, Gent J, Catalanotto FA, Goodspeed RB. Clinical evaluation of olfaction. American Journal of Otolaryngology. 1983;4(4):252–256. doi: 10.1016/s0196-0709(83)80068-4. [DOI] [PubMed] [Google Scholar]
- Cerf B, Le Bihan D, Van de Moortele PF, Mac Leod P, Faurion A. Functional lateralization of human gustatory cortex related to handedness disclosed by fMRI study. Annals of the New York Academy of Sciences. 1998;855:575–578. doi: 10.1111/j.1749-6632.1998.tb10627.x. [DOI] [PubMed] [Google Scholar]
- Cerf-Ducastel B, Murphy C. fMRI activation in response to odorants orally delivered in aqueous solutions. Chemical Senses. 2001;26(6):625–637. doi: 10.1093/chemse/26.6.625. [DOI] [PubMed] [Google Scholar]
- Cerf-Ducastel B, Van De Moortele PF, MacLeod P, Le Bihan D, Faurion A. Interaction of gustatory and lingual somatosensory perceptions at the cortical level in the human: a functional magnetic resonance imaging study. Chemical Senses. 2001;26(4):371–383. doi: 10.1093/chemse/26.4.371. [DOI] [PubMed] [Google Scholar]
- Cox RW. AFNI: software for analysis and visualization of functional magnetic resonance neuroimages. Computers and Biomedical Research. 1996;29(3):162–173. doi: 10.1006/cbmr.1996.0014. [DOI] [PubMed] [Google Scholar]
- Crovetti R, Porrini M, Santangelo A, Testolin G. The influence of thermic effect of food on satiety. European Journal of Clinical Nutrition. 1998;52(7):482–488. doi: 10.1038/sj.ejcn.1600578. [DOI] [PubMed] [Google Scholar]
- Davidson TL, Jarrard LE. A role for hippocampus in the utilization of hunger signals. Behavioral and Neural Biology. 1993;59(2):167–171. doi: 10.1016/0163-1047(93)90925-8. [DOI] [PubMed] [Google Scholar]
- de Araujo IET, Kringelbach ML, Rolls ET, Hobden P. Representation of umami taste in the human brain. Journal of Neurophysiology. 2003a;90(1):313–319. doi: 10.1152/jn.00669.2002. [DOI] [PubMed] [Google Scholar]
- de Araujo IET, Kringelbach ML, Rolls ET, McGlone F. Human cortical responses to water in the mouth, and the effects of thirst. Journal of Neurophysiology. 2003b;90(3):1865–1876. doi: 10.1152/jn.00297.2003. [DOI] [PubMed] [Google Scholar]
- de Araujo IET, Rolls ET. Representation in the human brain of food texture and oral fat. The Journal of Neuroscience. 2004;24(12):3086–3093. doi: 10.1523/JNEUROSCI.0130-04.2004. [DOI] [PMC free article] [PubMed] [Google Scholar]
- de Araujo IET, Rolls ET, Kringelbach ML, McGlone F, Phillips N. Taste-olfactory convergence, and the representation of the pleasantness of flavour, in the human brain. The European Journal of Neuroscience. 2003c;18(7):2059–2068. doi: 10.1046/j.1460-9568.2003.02915.x. [DOI] [PubMed] [Google Scholar]
- Del Parigi A, Chen K, Gautier JF, Salbe AD, Pratley RE, Ravussin E, Reiman EM, Tataranni PA. Sex differences in the human brain’s response to hunger and satiation. The American Journal of Clinical Nutrition. 2002a;75(6):1017–1022. doi: 10.1093/ajcn/75.6.1017. [DOI] [PubMed] [Google Scholar]
- Del Parigi A, Gautier JF, Chen K, Salbe AD, Ravussin E, Reiman E, Tataranni PA. Neuroimaging and obesity: mapping the brain responses to hunger and satiation in humans using positron emission tomography. Annals of the New York Academy of Sciences. 2002b;967:389–397. [PubMed] [Google Scholar]
- Denton D, Shade R, Zamarippa F, Egan G, Blair-West J, McKinley M, Fox P. Correlation of regional cerebral blood flow and change of plasma sodium concentration during genesis and satiation of thirst. Proc Natl Acad Sci. 1999;96(5):2532–7. doi: 10.1073/pnas.96.5.2532. [DOI] [PMC free article] [PubMed] [Google Scholar]
- Elliott R, Newman JL, Longe OA, Deakin JF. Differential response patterns in the striatum and orbitofrontal cortex to financial reward in humans: a parametric functional magnetic resonance imaging study. The Journal of Neurosciences. 2003;23(1):303–307. doi: 10.1523/JNEUROSCI.23-01-00303.2003. [DOI] [PMC free article] [PubMed] [Google Scholar]
- Elmquist JK, Maratos-Flier E, Saper CB, Flier JS. Unraveling the cntral nervous system pathways underlaying responses to leptin. Nature Neuroscience. 1998;1(6):445–450. doi: 10.1038/2164. [DOI] [PubMed] [Google Scholar]
- Faurion A, Cerf B, Le Bihan D, Pillias AM. fMRI study of taste cortical areas in humans. Annals of the New York Academy of Sciences. 1998;855:535–545. doi: 10.1111/j.1749-6632.1998.tb10623.x. [DOI] [PubMed] [Google Scholar]
- Faurion A, Cerf B, Van De Moortele PF, Lobel E, Mac Leod P, Le Bihan D. Human taste cortical areas studied with functional magnetic resonance imaging: evidence of functional lateralization related to handedness. Neuroscience Letters. 1999;277(3):189–192. doi: 10.1016/s0304-3940(99)00881-2. [DOI] [PubMed] [Google Scholar]
- Francis S, Rolls ET, Bowtell R, McGlone F, O’Doherty J, Browning A, Clare S, Smith E. The representation of pleasant touch in the brain and its relationship with taste and olfactory areas. NeuroReport. 1999;10(3):453–459. doi: 10.1097/00001756-199902250-00003. [DOI] [PubMed] [Google Scholar]
- Frank GKW, Oberndorfer TA, Simmons AN, Paulus MP, Fudge JL, Yang TT, Kaye WH. Sucrose activates human taste pathways differently from artificial sweetener. NeuroImage. 2008;39:1559–1569. doi: 10.1016/j.neuroimage.2007.10.061. [DOI] [PubMed] [Google Scholar]
- Frank RA, Byram J. Taste-smell interactions are tastant and odorant dependent. Chemical Senses. 1988;13(3):445–455. [Google Scholar]
- Gautier JF, Chen K, Uecker A, Bandy D, Frost J, Salbe AD, Pratley JE, Lawson M, Ravussin E, Reiman EM, Tataranni PA. Regions of the human brain affected during a liquid-meal taste perception in the fasting state: a positron emission tomography study. The American Journal of Clinical Nutrition. 1999;70(5):806–810. doi: 10.1093/ajcn/70.5.806. [DOI] [PubMed] [Google Scholar]
- Gottfried JA, O’Doherty J, Dolan RJ. Encoding predictive reward value in human amygdala and orbitofrontal cortex. Science. 2003;301(5636):1104–1107. doi: 10.1126/science.1087919. [DOI] [PubMed] [Google Scholar]
- Green BG, Dalton P, Cowart B, Shaffer G, Rankin K, Higgins J. Evaluating the ’Labeled Magnitude Scale’ for measuring sensations of taste and smell. Chemical Senses. 1996;21(3):323–334. doi: 10.1093/chemse/21.3.323. [DOI] [PubMed] [Google Scholar]
- Green BG, Shaffer SS, Gilmore MM. Derivation and evaluation of a semantic scale of oral sensation magnitude with apparent ratio properties. Chemical Senses. 1993;18(6):683–702. [Google Scholar]
- Haase L, Cerf-Ducastel B, Buracas G, Murphy C. On-line psychophysical data acquisition and event related fMRI protocol optimized for the investigation of brain activation in response to gustatory stimuli. Journal of Neuroscience Methods. 2007;159:98–107. doi: 10.1016/j.jneumeth.2006.07.009. [DOI] [PubMed] [Google Scholar]
- Kirsch P, Schienle A, Stark R, Sammer G, Blecker C, Walter B, Ott U, Burkart J, Vaitl D. Anticipation of reward in a nonaversive differential conditioning paradigm and the brain reward system: an event-related fMRI study. NeuroImage. 2003;20(2):1086–1095. doi: 10.1016/S1053-8119(03)00381-1. [DOI] [PubMed] [Google Scholar]
- Knutson B, Adams CM, Fong GW, Hommer D. Anticipation of increasing monetary reward selectively recruits nucleus accumbens. The Journal of Neuroscience. 2001;21(16):RC159. doi: 10.1523/JNEUROSCI.21-16-j0002.2001. [DOI] [PMC free article] [PubMed] [Google Scholar]
- Kobayashi M, Takeda M, Hattori N, Fukunaga M, Sasabe T, Inoue N, Nagai Y, Sawada T, Sadato N, Watanabe Y. Functional imaging of gustatory perception and imagery: “top-down” processing of gustatory signals. NeuroImage. 2004;23(4):1271–1282. doi: 10.1016/j.neuroimage.2004.08.002. [DOI] [PubMed] [Google Scholar]
- Komura Y, Tamura R, Uwano T, Nishijo H, Kaga K, Ono T. Retrospective and prospective coding for predicted reward in the sensory thalamus. Nature. 2001;412(6846):546–549. doi: 10.1038/35087595. [DOI] [PubMed] [Google Scholar]
- Kringelbach ML, de Araujo IET, Rolls ET. Taste-related activity in the human dorsolateral prefrontal cortex. NeuroImage. 2004;21(2):781–788. doi: 10.1016/j.neuroimage.2003.09.063. [DOI] [PubMed] [Google Scholar]
- Kringelbach ML, O’Doherty J, Rolls ET, Andrews C. Activation of the human orbitofrontal cortex to a liquid food stimulus is correlated with its subjective pleasantness. Cerebral Cortex. 2003;13(10):1064–1071. doi: 10.1093/cercor/13.10.1064. [DOI] [PubMed] [Google Scholar]
- Kringelbach ML, Rolls ET. The functional neuroanatomy of the human orbitofrontal cortex: evidence from neuroimaging and neuropsychology. Progress in Neurobiology. 2004;72(5):341–372. doi: 10.1016/j.pneurobio.2004.03.006. [DOI] [PubMed] [Google Scholar]
- LaBar KS, Gitelman DR, Parrish TB, Kim YH, Nobre AC, Mesulam MM. Hunger selectively modulates corticolimbic activation to food stimuli in humans. Behavioral Neuroscience. 2001;115(2):493–500. doi: 10.1037/0735-7044.115.2.493. [DOI] [PubMed] [Google Scholar]
- Liu TT, Frank LR. Efficiency, power, and entropy in event-related fMRI with multiple trial types. Part I: theory. NeuroImage. 2004;21(1):387–400. doi: 10.1016/j.neuroimage.2003.09.030. [DOI] [PubMed] [Google Scholar]
- Liu TT, Frank LR, Wong EC, Buxton RB. Detection power, estimation efficiency, and predictability in event-related fMRI. NeuroImage. 2001;13(4):759–773. doi: 10.1006/nimg.2000.0728. [DOI] [PubMed] [Google Scholar]
- McBurney DH, Pfaffmann C. Gustatory adaptation to saliva and sodium chloride. Journal of Experimental Psychology. 1963;65:523–529. [Google Scholar]
- Morris JS, Dolan RJ. Involvement of human amygdala and orbitofrontal cortex in hunger- enhanced memory for food stimuli. The Journal of Neuroscience. 2001;21(14):5304–5310. doi: 10.1523/JNEUROSCI.21-14-05304.2001. [DOI] [PMC free article] [PubMed] [Google Scholar]
- Murphy C, Cain WS. Taste and olfaction: independence vs interaction. Physiology & Behavior. 1980;24(3):601–605. doi: 10.1016/0031-9384(80)90257-7. [DOI] [PubMed] [Google Scholar]
- Murphy C, Cain WS, Bartoshuk LM. Mutual action of taste and olfaction. Sensory Processes. 1977;1(3):204–211. [PubMed] [Google Scholar]
- Murphy C, Gilmore MM, Seery CS, Salmon DP, Lasker BR. Olfactory thresholds are associated with degree of dementia in Alzheimer’s disease. Neurobiology of Aging. 1990;11(4):465–469. doi: 10.1016/0197-4580(90)90014-q. [DOI] [PubMed] [Google Scholar]
- O’Doherty J, Rolls ET, Francis S, Bowtell R, McGlone F. Representation of pleasant and aversive taste in the human brain. The Journal of Neurophysiology. 2001;85(3):1315–1321. doi: 10.1152/jn.2001.85.3.1315. [DOI] [PubMed] [Google Scholar]
- O’Doherty J, Rolls ET, Francis S, Bowtell R, McGlone F, Kobal G, Renner B, Ahne G. Sensory-specific satiety-related olfactory activation of the human orbitofrontal cortex. NeuroReport. 2000;11(2):399–403. doi: 10.1097/00001756-200002070-00035. [DOI] [PubMed] [Google Scholar]
- O’Doherty J, Deichmann R, Critchley HD, Dolan RJ. Neural responses during anticipation of a primary taste reward. Neuron. 2002;33(5):815–826. doi: 10.1016/s0896-6273(02)00603-7. [DOI] [PubMed] [Google Scholar]
- Pardo JV, Wood TD, Costello PA, Pardo PJ, Lee JT. PET study of the localization and laterality of lingual somatosensory processing in humans. Neurosci Lett. 1997;234(1):23–6. doi: 10.1016/s0304-3940(97)00650-2. [DOI] [PubMed] [Google Scholar]
- Pelchat ML, Johnson A, Chan R, Valdez J, Ragland JD. Images of desire: food-craving activation during fMRI. NeuroImage. 2004;23(4):1486–1493. doi: 10.1016/j.neuroimage.2004.08.023. [DOI] [PubMed] [Google Scholar]
- Pritchard TC, Hamilton RB, Norgren R. Neural coding of gustatory information in the thalamus of Macaca mulatta. The Journal of Neurophysiology. 1989;61(1):1–14. doi: 10.1152/jn.1989.61.1.1. [DOI] [PubMed] [Google Scholar]
- Pritchard TC, Hamilton RB, Morse JR, Norgren R. Projections of thalamic gustatory and lingual areas in the monkey, Macaca fascicularis. Journal of Comparative Neurology. 1986;244(2):213–228. doi: 10.1002/cne.902440208. [DOI] [PubMed] [Google Scholar]
- Pritchard TC, Macaluso DA, Eslinger PJ. Taste perception in patients with insular cortex lesions. Behavioral Neuroscience. 1999;113:663–671. [PubMed] [Google Scholar]
- Rolls BJ, Rolls ET, Rowe EA, Sweeney K. Sensory specific satiety in man. Physiology & Behavior. 1981;27(1):137–142. doi: 10.1016/0031-9384(81)90310-3. [DOI] [PubMed] [Google Scholar]
- Rolls ET. Information processing in the taste system of primates. The Journal of Experimental Biology. 1989;146:141–164. doi: 10.1242/jeb.146.1.141. [DOI] [PubMed] [Google Scholar]
- Rolls ET, Baylis LL. Gustatory, olfactory, and visual convergence within the primate orbitofrontal cortex. The Journal of Neuroscience. 1994;14(9):5437–5452. doi: 10.1523/JNEUROSCI.14-09-05437.1994. [DOI] [PMC free article] [PubMed] [Google Scholar]
- Rolls ET, Scott TR, Sienkiewicz ZJ, Yaxley S. The responsiveness of neurones in the frontal opercular gustatory cortex of the macaque monkey is independent of hunger. The Journal of Physiology. 1988;397:1–12. doi: 10.1113/jphysiol.1988.sp016984. [DOI] [PMC free article] [PubMed] [Google Scholar]
- Rolls ET, Sienkiewicz ZJ, Yaxley S. Hunger modulates the responses to gustatory stimuli of single neurons in the caudolateral orbitofrontal cortex of the macaque monkey. The European Journal of Neuroscience. 1989;1(1):53–60. doi: 10.1111/j.1460-9568.1989.tb00774.x. [DOI] [PubMed] [Google Scholar]
- Rolls ET, Yaxley S, Sienkiewicz ZJ. Gustatory responses of single neurons in the caudolateral orbitofrontal cortex of the macaque monkey. The Journal of Neurophysiology. 1990;64(4):1055–1066. doi: 10.1152/jn.1990.64.4.1055. [DOI] [PubMed] [Google Scholar]
- Rozin P. “Taste-smell confusions” and the duality of the olfactory sense. Perception & Psychophysics. 1982;31(4):397–401. doi: 10.3758/bf03202667. [DOI] [PubMed] [Google Scholar]
- Schiffman SS, Booth BJ, Losee ML, Pecore SD, Warwick ZS. Bitterness of sweeteners as a function of concentration. Brain Research Bulletin. 1995;36(5):505–513. doi: 10.1016/0361-9230(94)00225-p. [DOI] [PubMed] [Google Scholar]
- Scott TR, Karadi Z, Oomura Y, Nishino H, Plata-Salaman CR, Lenard L, Giza BK, Aou S. Gustatory neural coding in the amygdala of the alert macaque monkey. The Journal of Neurophysiology. 1993;69(6):1810–1820. doi: 10.1152/jn.1993.69.6.1810. [DOI] [PubMed] [Google Scholar]
- Scott TR, Plata-Salaman CR. Taste in the monkey cortex. Physiology & Behavior. 1999;67(4):489–511. doi: 10.1016/s0031-9384(99)00115-8. [DOI] [PubMed] [Google Scholar]
- Scott TR, Yan Y, Rolls ET. Brain mechanisms of satiety and taste in macaques. Neurobiology. 1995;3(34):281–292. [PubMed] [Google Scholar]
- Scott TR, Small D. The role of the parabrachial nucleus in taste processing and feeding. International Symposium on Olfaction and Taste XI; San Francisco. July 23, 2008; Abstract. [DOI] [PubMed] [Google Scholar]
- Schultz W. Predictive reward signal of dopamine neurons. Journal of Neurophysiology. 1998;80(1):1–27. doi: 10.1152/jn.1998.80.1.1. [DOI] [PubMed] [Google Scholar]
- Small DM, Gerber JC, Mak YE, Hummel T. Differential neural responses evoked by orthonasal versus retronasal odorant perception in humans. Neuron. 2005;47(4):593–605. doi: 10.1016/j.neuron.2005.07.022. [DOI] [PubMed] [Google Scholar]
- Small DM, Zatorre RJ, Dagher A, Evans AC, Jones-Gotman M. Changes in brain activity related to eating chocolate: from pleasure to aversion. Brain. 2001;124(Pt 9):1720–1733. doi: 10.1093/brain/124.9.1720. [DOI] [PubMed] [Google Scholar]
- Squire LR, Stark CEL, Clark RE. The medial temporal lobe. Annual Review of Neuroscience. 2004;27:279–306. doi: 10.1146/annurev.neuro.27.070203.144130. [DOI] [PubMed] [Google Scholar]
- Stevenson RJ, Prescott J, Boakes RA. Confusing tastes and smells: how odours can influence the perception of sweet and sour tastes. Chemical Senses. 1999;24(6):627–635. doi: 10.1093/chemse/24.6.627. [DOI] [PubMed] [Google Scholar]
- Stunkard AJ, Messick S. The three-factor eating questionnaire to measure dietary restraint, disinhibition and hunger. Journal of Psychosomatic Research. 1985;29(1):71–83. doi: 10.1016/0022-3999(85)90010-8. [DOI] [PubMed] [Google Scholar]
- Tanabe T, Yarita H, Iino M, Ooshima Y, Takagi SF. An olfactory projection area in orbitofrontal cortex of the monkey. The Journal of Neurophysiology. 1975;38(5):1269–1283. doi: 10.1152/jn.1975.38.5.1269. [DOI] [PubMed] [Google Scholar]
- Tataranni PA, Gautier JF, Chen K, Uecker A, Bandy D, Salbe AD, Pratley RE, Lawson M, Reiman EM, Ravussin E. Neuroanatomical correlates of hunger and satiation in humans using positron emission tomography. Proceedings of the National Academy of Sciences of the United States of America. 1999;96(8):4569–4574. doi: 10.1073/pnas.96.8.4569. [DOI] [PMC free article] [PubMed] [Google Scholar]
- Thorpe SJ, Rolls ET, Maddison S. The orbitofrontal cortex: neuronal activity in the behaving monkey. Experimental Brain Research. 1983;49(1):93–115. doi: 10.1007/BF00235545. [DOI] [PubMed] [Google Scholar]
- Uher R, Treasure J, Heining M, Brammer MJ, Campbell IC. Cerebral processing of food-related stimuli: effects of fasting and gender. Behavioural Brain Research. 2006;169(1):111–119. doi: 10.1016/j.bbr.2005.12.008. [DOI] [PubMed] [Google Scholar]
- Veldhuizen MD, Bender G, Constable RT, Small DM. Trying to detect taste in a tasteless solution: Modulation of early gustatory cortex by attention to taste. Chemical Senses. 2007;32(6):569–581. doi: 10.1093/chemse/bjm025. [DOI] [PubMed] [Google Scholar]
- Ward BD. Simultaneous inference for fMRI data. Biophysics Research Institute, Medical College of Wisconsin 1997 [Google Scholar]
- Yan J, Scott TR. The effect of satiety on responses of gustatory neurons in the amygdala of alert cynomolgus macaques. Brain Research. 1996;740(12):193–200. doi: 10.1016/s0006-8993(96)00864-5. [DOI] [PubMed] [Google Scholar]
- Yaxley S, Rolls ET, Sienkiewicz ZJ. The responsiveness of neurons in the insular gustatory cortex of the macaque monkey is independent of hunger. Physiology & Behavior. 1988;42(3):223–229. doi: 10.1016/0031-9384(88)90074-1. [DOI] [PubMed] [Google Scholar]
- Yaxley S, Rolls ET, Sienkiewicz ZJ. Gustatory responses of single neurons in the insula of the macaque monkey. The Journal of Neurophysiology. 1990;63(4):689–700. doi: 10.1152/jn.1990.63.4.689. [DOI] [PubMed] [Google Scholar]
- Yaxley S, Rolls ET, Sienkiewicz ZJ, Scott TR. Satiety does not affect gustatory activity in the nucleus of the solitary tract of the alert monkey. Brain Research. 1985;347(1):85–93. doi: 10.1016/0006-8993(85)90891-1. [DOI] [PubMed] [Google Scholar]
- Zald DH, Hagen MC, Pardo JV. Neural correlates of tasting concentrated quinine and sugar solutions. The Journal of Neurophysiology. 2002;87(2):1068–1075. doi: 10.1152/jn.00358.2001. [DOI] [PubMed] [Google Scholar]
- Zald DH, Lee JT, Fluegel KW, Pardo JV. Aversive gustatory stimulation activates limbic circuits in humans. Brain. 1998;121(Pt 6):1143–1154. doi: 10.1093/brain/121.6.1143. [DOI] [PubMed] [Google Scholar]
- Zald DH, Pardo JV. Cortical activation induced by intraoral stimulation with water in humans. Chem Senses. 2000;25(3):267–75. doi: 10.1093/chemse/25.3.267. [DOI] [PubMed] [Google Scholar]