

Abstract
Ambiguous stimuli with two distinct interpretations give rise to perceptual alternations between them. During prolonged viewing of transparently moving gratings, observers report periods of perceiving one grating in front of the other, alternating with periods of the reverse depth ordering. We measured the percepts' dominance times to study the effect of depth cues (wavelength, duty cycle, and speed) on the perceived depth ordering. The grating with shorter wavelength, lower duty cycle, or higher speed was perceived as being behind the other for a fraction of time larger than one half. The fraction of time spent perceiving each grating as behind changed gradually as a function of the parameters. The fraction of dominance depended on the ratio between the gratings' wavelengths, not on their absolute sizes. The wavelength ratio had a stronger effect on perceived depth than that of duty cycle or speed and could override stereoscopic disparity cues. Similar results were obtained with superimposed moving surfaces of random dots. The findings are interpreted in terms of their relation to statistical properties of natural surfaces and provide evidence that the fraction of dominance of each percept represents the likelihood that it corresponds to the true interpretation of the underlying scene.
Keywords: grating, depth, bi-stability, plaid
Introduction
When viewing a stimulus with two or more distinct interpretations, observers experience perceptual switches between the two alternatives. Well-known examples are binocular rivalry (Blake, 2001; Logothetis, 1998), ambiguous figures (e.g., Necker, 1832), and figure/ground illusions such as the face-vase (Rubin, 1958). For both binocular rivalry and ambiguous motion displays, the dynamics of the perceptual alternations were found to be stationary (Rubin & Hupé, 2004). In particular, the fraction of time that one percept dominates over the other is stable over time and does not depend on methodological details such as measurement duration. Furthermore, in several domains of bi-stability, it has been shown that the fraction of dominance time changes gradually with parametric manipulations of the stimulus (e.g., contrast of the monocular images; Blake, Sobel, & Gilroy, 2003; Leopold & Logothetis, 1996; Levelt, 1967; see also Bonneh, Cooperman, & Sagi, 2001; Hupé & Rubin, 2003). This fraction therefore offers a valuable measure of how the relative strengths of the competing percepts vary with stimulus parameters.
In this study, we measured dominance times during spontaneous perceptual reversals in the perceived depth ordering of transparently moving gratings. A well-known ambiguity in the interpretation of two superimposed drifting gratings concerns their relative motion: as Figure 1A shows, they may be perceived as sliding over each other in different directions (“transparent motion,” right panel) or as moving together as a single pattern (“gingham,” Wallach, 1976; Wuerger, Shapley, & Rubin, 1996; “plaid,” Adelson & Movshon, 1982; left panel). A lesser-known ambiguity of the same display concerns the relative depth of the two gratings: Are they in the same depth plane, or is one of them behind the other? And if the latter, which grating is in front and which one is in the back? When stimulus parameters are chosen such that transparent motion is dominant for long periods, observers quickly become aware of this additional ambiguity due to spontaneous alternations of the depth ordering of the two gratings (Figure 1B). We therefore created such displays, presented them for trials of ∼1 min each, and asked observers to continually indicate which grating was seen as behind the other. Since it was previously shown that setting the angle between the gratings' individual directions of motion sufficiently large (above ∼140°; cf. Figure 1) causes transparent motion to dominate for long periods of time (Hupé & Rubin, 2003), in all the experiments reported here the angle between the two gratings was set to 160°. This yielded displays where the only perceptual alternations were those concerned with the relative depth ordering of the gratings.
Figure 1.
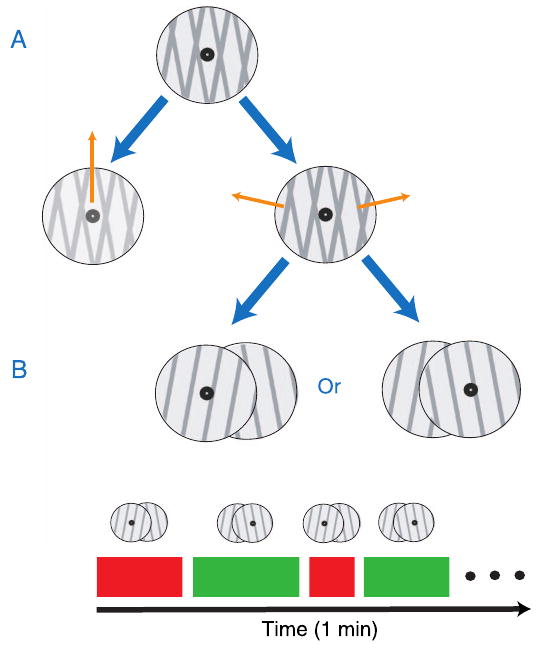
Depth ordering and spontaneous reversals of two superimposed drifting gratings. (A) When two drifting rectangular-wave gratings are superimposed so that their directions of motion differ by a large angle (here, 160°), the transparent motion interpretation (bottom right) is predominant while the alternative, pattern motion interpretation (bottom left) is never observed. (B) Transparent motion is ambiguous as to the depth ordering of the two gratings. During prolonged viewing of these displays (in our experiments, 1 min), observers notice this ambiguity since it gives rise to spontaneous perceptual reversals of the depth ordering of the gratings.
When the two gratings have identical form parameters and equal speeds, and their individual directions of motion are symmetric about the vertical (as in Figure 1), observers spend equal amounts of time (on average) perceiving each of the two possible depth orderings. However, when the symmetry of the display is broken, one of the two gratings is seen to move behind the other more often. Pilot experiments indicated that the fraction of time that one grating was seen behind the other, f, varied with grating parameters that could be interpreted as depth cues. We therefore proceeded to measure the effect of pictorial depth cues, motion parameters, and relative disparity on f. Specifically, we varied the gratings' wavelength (Experiment 1), duty cycle (Experiment 2), speed (Experiment 3) and pitted their relative wavelength against stereoscopic disparity (Experiment 4). All of these parameters produced strong and lawful effects on the fraction of time that each grating was perceived as moving behind the other. Furthermore, the dependence of f on each of the parameters was gradual, its observed values covered wide ranges (sometimes the full possible range, from zero to one), and it varied in a direction that could be readily interpreted in terms of the image changes expected as surfaces are further away in the background. Equivalent effects on the depth ordering of two overlying moving random dots surfaces were obtained when depth cues like the global scale, the dots duty cycle and their relative speeds were manipulated (Experiment 5). The results therefore support the hypothesis that the fraction of time that each percept is dominant provides a measure of the probability assigned by the visual system to it as being a valid interpretation of the underlying scene.
Methods
Observers
A total of 16 observers (15 naïve, one author) participated in the experiments; six in Experiment 1 (#1–6; three females), four in Experiment 2 (#1, #5, #7–8; two females), four in Experiment 3 (#1, #4, #8–9, #13–15; four females), four in Experiment 4 (#2, #5, #10–11; three females), and three in Experiment 5 (#12–14; one female). All observers had normal or corrected-to-normal vision. They were paid $10 per session for their participation and provided informed consent according to the guidelines of the NYU Committee on Activities Involving Human Subjects.
Stimulus
Experiments 1–3
The stimulus consisted of two superimposed square-wave gratings moving at an angle of 160° between their directions of motion, as shown schematically in Figure 1A. The luminance of the bars was 30 cd/m2 (the intersections had the same luminance as that of the bars), and that of the background was 76 cd/m2. The bars were anti-aliased (i.e., intermediate luminance values were used for the pixels at their edges). One of the two gratings had the following fixed parameters: wavelength λ = 2.7°; duty cycle dc = 0.2; speed v = 5.4°/s. The other grating had two of these three parameters fixed at the same values, and the third parameter was varied, separately in each experiment, as follows: wavelength λ = 0.9°, 1.35°, 1.8°, 2.25°, 2.7°, 3.24°, 4.05°, 5.4°, 8.1° (Experiment 1a); duty cycle dc = 0.0125, 0.025, 0.05, 0.1, 0.2, 0.3, 0.5 (Experiment 2); speed v = 0, 0.36, 1.8, 3.6, 5.4, 7.2, 9, 10.8, 14.4°/s (Experiment 3). Note that varying the wavelength with fixed duty cycle corresponds to a true size scaling of the grating. In Experiment 1b, the wavelengths of both gratings varied simultaneously, as detailed in Results. In Experiment 3b, one grating moved with speed v = 5.4°/s and the other with speed v = 0.18°/s; the luminance of the faster grating took one of two values, the original 30 cd/m2 or the lower value 23 cd/m2. For the second value of luminance, the luminance of the intersection regions between the two gratings was made to be consistent with the physics of semitransparent neutral filters (see e.g., Stoner, Albright, & Ramachandran, 1990; Vallortigara & Bressan, 1991), taking the value 9 cd/m2. The observers reported that the lower luminance grating had clearly a higher apparent contrast in relation to the background than that of the higher luminance grating (note that the background had bright appearance).
Experiment 4
Red-green glasses and corresponding anaglyph images were used to create stereo stimuli. The stereoscopic disparity was created by shifting horizontally the cyan and red components of one of the gratings by 0.37°. This caused the grating to appear behind the fixation point, which had zero disparity. Its wavelength was fixed at λ = 4.1°. The second grating, whose wavelength was varied from trial to trial, had zero disparity. The luminance of the background was 0.06 cd/m2 (black appearance). Other parameters were as in Experiment 1–3.
Experiment 5
Two surfaces made of random square dots moved at an angle of 160° between their directions of motion. The luminance of the dots was 40 cd/m2. The dots were randomly placed at the surfaces, which moved with constant speed v = 5.4°/s. The dot density and dot size of one of the surfaces were fixed at density = 0.7 dot/deg2 and size = 0.36°. The duty cycle (approximate proportion of the surface covered by the square dots) for this surface was hence fixed at dc = density × size2 = 0.1. The global scale and duty cycle of the other surface were varied according to a full factorial design (Experiment 5a). Its scale took values 1/1.25, 1, and 1.25, where one means same scale as the reference surface. (Note that scaling up the surface implies increasing the dot size and simultaneously decreasing the dot density in a proportion equal to the square of the dot size increase.) For each scale, the duty cycle took the values 1/1.252, 1, and 1.252 times the reference duty cycle. This is achieved by multiplying both the dot horizontal and vertical dimensions by the factors 1/1.25, 1, and 1.25, respectively. Note that here the scale is equivalent to the parameter wavelength, at fixed duty cycle, in the gratings stimulus. In a second experiment (Experiment 5b), the speed of one of the surfaces was varied, with values v = 0.54, 1.08, 5.4, 8.1, and 10.8°/s, while the speed of the other surface remained fixed at v = 5.4°/s. (Scale and duty cycle were identical for the two surfaces and equal to those of the reference surface in the previous experiment.)
In all experiments, the stimulus appears within a circular aperture of diameter 12.5°. Luminance outside the aperture was 18 cd/m2. A circular fixation point (radius 0.18°, luminance 58 cd/m2) was overlaid on a small homogeneous circular region (radius 0.9°, luminance 0.2 cd/m2) that covered the center of the display.
Apparatus
The stimuli were generated by an Intel-based PC running a C program and using the OpenGL graphics library and displayed on a 19-in. CRT screen at 75 Hz with a resolution of 1280 × 1024 pixels. Observers sat at a distance 56 cm from the screen.
Experimental procedure
Observers sat in front of a computer screen with their heads supported by a chin rest. They were asked to continually report the direction of motion (right or left) of the grating which they perceived as being behind the other, by holding down one of two designated keys. (Identical results were obtained in pilot tests from two observers when the instruction was to report the motion of the grating in front, rather than of that behind.) Observers were given passive viewing instructions (not to try to perceive one possibility more than the other, just to report the spontaneous changes) and were instructed to not press either key if the percept was unclear (this option was used less than 5% of the time, on average). Observers fixated the central spot during the whole 1 min duration of each trial, and viewed the stimuli binocularly, for comfort. (In pilot tests, we did not find any qualitative or quantitative differences using monocular viewing, suggesting that the stereo information about the flat screen did not play a significant role in suppressing the perceptual depth ordering effects.) Each combination of the gratings' parameters was repeated four times, randomizing the global directions of motion of the two gratings (up–right, up–left, down–right, and down–left; always ±80° from the vertical each; the global direction of motion did not produce any significant effect). Observers ran a total of 36 trials of 1 min each in a single session; they were instructed to take a 10- to 30-s rest between the trials.
Analysis
The fraction of time that one percept dominated was defined as f = (the cumulative time this percept was reported as dominant) / (the total time that either of the percepts was reported as dominant). Here percept refers to a particular depth ordering of the two gratings; i.e., one percept corresponds to grating 1 perceived as being behind grating 2, and the other possible percept corresponds to grating 2 perceived as being behind grating 1. The fraction f is a number between zero and one, with a value of 0.5 indicating that the two possible percepts, i.e., depth orderings, were equally likely.
Error bars are the standard deviations of the mean of f values across the four repetitions of each set of parameter and across all observers.
ANOVA was used to test significance of the grating's parameters (wavelength, duty cycle, speed, and orientation) on f. Individual analysis was performed using the grating's parameter and orientation as fixed effects. Group analysis was performed using parameter and orientation as fixed effects as well, and subjects as random effect. Orientation did not have any significant effect.
Grating's wavelength had a strong effect on f subject by subject (Experiment 1; subject #1, F(8,24) = 199, p < 10−4; #2, F(8,24) = 32, p < 10−4; #3, F(8,24) = 39, p < 10−4; #4, F(8,24) = 36.5, p < 10−4; #5, F(8,24) = 165, p < 10−4), as well as when they were grouped (F(8,32) = 61, p < 10−4). The duty cycle had a strong effect on f individually (Experiment 2; subject #1, F(6,18) = 30.6, p < 10−4; #5, F(6,18) = 23.6, p < 10−4; #7, F(6,18) = 88.3, p < 10−4; #8, F(6,18) = 19.8, p < 10−4), as well as when subjects were considered as a population (F(6,18) = 9.7, p < 10−4). Similarly, speed effects were significant for all subjects individually (Experiment 3; subject #1, F(8,24) = 21, p < 10−4; #5, F(8,24) = 7, p = 10−4; #8, F(8,24) = 24.5, p < 10−4; #9, F(8,24) = 12.3, p < 10−4) or when they were grouped (F(8,24) = 39.6, p < 10−4). The luminance had a significant effect on the depth ordering probabilities for the three subjects tested (Experiment 3b; subject #13, F(1,11) = 19.3, p = 0.001; #14, F(1,11) = 8.1, p = 0.016; #15, F(1,11) = 12.9, p = 0.004; two repetitions per condition). The fastest grating is perceived as being behind for f larger than 0.5 when the contrasts of the two gratings were different for two subjects (one-tailed t test, df = 7, subject #13 p = 0.013; #14 p = 0.007). For the third subject, f was not significantly different from 0.5 (two-tailed t test, df = 7, subject #15, p = 0.92).
The effect of scale and duty cycle on f for random dot surfaces (Experiment 5a) was tested using ANOVA. For all subjects, both scale and duty cycle had a strong effect (subject #12, F(2,12) = 50.5, p < 10−4 and F(2,12) = 48.7, p < 10−4, respectively; #13, F(2,12) = 40.6, p < 10−4 and F(2,12) = 15.6, p = 6 × 10⁻⁴; #14, F(2,12) = 30.2, p < 10−4 and F(2,12) = 12.5, p = 12 × 10−4). The effect of dot density was assessed by using ANOVA with predictors “scale” and “scale × duty cycle.” Since the second variable completely determines the dot size, the independent first variable “scale” (for fixed “scale × duty cycle”) specifies dot density. Dot size had a strong effect on f for all subjects (subject #12, F(2,25) = 12.4, p < 10−4; #13, F(2,25) = 12.4, p < 10−4; #14, F(2,25) = 7.9, p = 10−4), while dot density did not have any effect on f, except for a borderline significant dependence on a subject (#12, F(5,25) = 0.21, p = 0.81; #13, F(5,25) = 12.4, p = 0.04; #14, F(5,25) = 2.4, p = 0.11). ANOVA shows that speed had a significant effect in Experiment 5b for all subjects (subject #12, F(4,12) = 16.2, p = 10−4; #13, F(4,12) = 8.6, p = 0.002; #14, F(4,12) = 29.3, p < 10−4).
Results
Experiment 1: The grating with the shorter wavelength tends to appear behind
Figure 2A shows the effect of modifying the wavelength of a grating (labeled “grating 1”) on the fraction of time f that it is perceived to move behind another grating (labeled “2”) that had a fixed wavelength of 2.7° (Experiment 1a). When the wavelengths of two gratings are equal, λ1 = λ2, f is statistically indistinguishable from 0.5. This balance no longer holds when the wavelength of grating 1 is modified. When λ1 < λ2, f is larger than 0.5, increasing gradually and monotonically as λ1 decreases toward 0. Conversely, in the range of values where λ1 > λ2, f is smaller than 0.5, decreasing toward zero gradually and monotonically as λ1 increases. The effect of the wavelength on f was highly significant for all observers individually, as well as when grouped (F(8,32) = 61, p < 10−4; see Methods). The effect of wavelength was so strong that doubling it for one grating reduced the fraction of time it was seen behind the other by as much as a factor of 5 (e.g., from f= 0.5 to f∼ 0.1, for λ1 = 2.7° and λ1 = 5.4°, respectively; Figure 2A). These results suggest that the visual system treats higher spatial frequency (shorter wavelength) of a surface as evidence that it is more distant, which in turn is consistent with the ecological properties of the visual world (distant objects produce smaller projected images on the retina; Euclid's law; (Goldstein, 2007).
Figure 2.
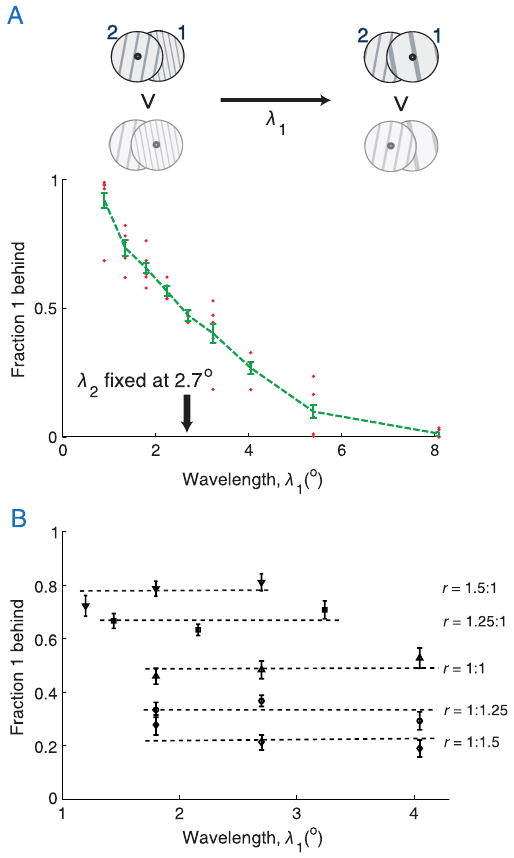
The grating with the shorter wavelength appears behind. (A) The fraction of time f that grating 1 was perceived to be moving behind grating 2 gradually decreases a function of the wavelength of grating 1, λ1 (here, the wavelength of grating 2 was fixed at λ2 = 2.7°, as indicated by the black arrow). f approaches its maximal and minimal values of 1 and 0 when λ1 « λ2, and λ2 « λ1, respectively. (Here and in all subsequent figures, the dots correspond to the individual observers' average f values.) In the schematic, top row (higher contrast images) corresponds to the most likely percept (i.e., depth configuration) as a function of wavelength of grating 1, while the bottom row (lower contrast images) corresponds to the less likely percept. Contrast here does not correspond to the physical appearance of the stimulus when it becomes dominant; it was used only for illustrative purpose. The symbol “>” vertically oriented indicates probability rank. (B) The fraction of time that grating 1 was perceived behind depended on its relative, not absolute wavelength. f is plotted as a function of λ1 for 5 different sets of fixed wavelength ratios: r = λ2:λ1 values of 1.5:1, 1.25:1, 1:1, 1:1.25, and 1:1.5 (each set grouped by a dashed line drawn at the mean f for that rvalue).
Next, we asked whether it is the relative or the absolute wavelength that affects a grating's perceived depth ordering. We therefore ran a second experiment, 1b, where we varied the wavelengths of both gratings simultaneously so as to obtain fixed wavelength ratios between them, r = λ2:λ1. We used five different ratios: 1.5:1, 1.25:1, 1:1, 1:1.25, and 1:1.5. Three different pairs of (λ1, λ2) values were used for each ratio. ANOVA of the resulting f measurements (four observers, 2 repetitions of each trial per observer) revealed a strong main effect of the wavelength ratio r (F(2,6) = 47, p = 2 × 10⁻⁴; observers treated as random effect; data for ratios 1.5:1 and 1.25:1 obtained from data for the reversed ratios) but no significant effect of the value of the individual wavelength λ1 alone (F(2,6) = 0.33, p = 0.73) and no interaction of r with it. These results can be clearly seen also in Figure 2B, which shows f as a function of λ1 grouped by the horizontal dashed lines according to the value of r (its values decrease between the groups from top to bottom). We therefore conclude that the critical parameter in determining the fraction of time a grating is perceived in a particular depth plane is not the absolute value of its wavelength, but rather the ratio between it and the wavelength of the other grating.
Experiment 2: The grating with the smaller duty cycle tends to appear in behind
Before we can interpret the results of Experiments 1a and 1b as reflecting the effect of the gratings' wavelength ratio as a depth cue, there is an alternative interpretation that needs to be addressed. In (static) displays where two shapes of the same luminance are superimposed so that they cross each other, the surface with the shorter contours in the region of overlap has a greater probability of appearing in front of the other surface. This phenomenon, known as Petter's rule (see e.g., Masin, 2000), is thought to arise from the more robust completion of the shorter contour gaps. Since the bars of the shorter wavelength grating have shorter gaps in the regions where they intersect with those of the other grating, the results of Experiment 1 may arise from Petter's rule. One way to test this alternative hypothesis is to measure the effect of duty cycle. By changing this parameter without changing the gratings' wavelength we can dissociate between the effect of the bars' width and that of wavelength per se.
Figure 3 shows that duty cycle indeed had a marked effect on the perceived depth ordering of the gratings: the grating with the smaller duty cycle tends to be perceived as behind more often (F(6,18) = 9.7, p < 10−4; see Methods). Increasing the duty cycle of grating 1 from 0.01 leads to a gradual decrease in f, the fraction of time this grating was perceived behind. Note that f crosses the value of 0.5 at the point when dc1 = dc2 = 0.2. Duty cycle was not increased beyond 0.5; for dc ≥ 0.5 a figure-ground reversal occurs, with the lighter regions becoming the foreground (since they become the thinner bars; Koffka, 1935), producing an effective duty cycle equal to 1 − dc.
Figure 3.
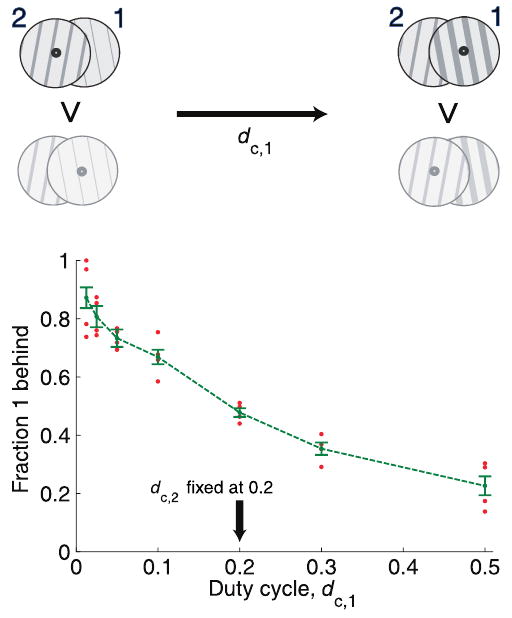
The grating with the smaller duty cycle appears behind the other grating more often. The fraction of time f that grating 1 was perceived to be moving behind the grating 2 is plotted against its duty cycle. (Grating 2 duty cycle was fixed at 0.2, as indicated by the black arrow.)
Although the effect of duty cycle is also consistent with Petter's rule, the results also show that the effect of wavelength observed in Experiment 1 cannot be attributed to it. This is because the effect of the wavelengths' difference on f was much stronger than the effect of duty cycle's differences, even when the two parametric manipulations affected the width of the grating's bars by the same amount. For example, doubling the wavelength of grating 1 (in Experiment 1) decreased f to from 0.5 to 0.1 whereas doubling its duty cycle (in Experiment 2) yielded a smaller reduction of f, 0.25 (see also Figure 5). Thus, Petter's rule cannot account for the results of Experiment 1, supporting our hypothesis that (all or part) of the effect of wavelength observed there was mediated by its role as a depth cue.
Figure 5.

The wavelength ratio of two superimposed gratings has a stronger effect on their perceived depth ordering than their relative duty cycle or speed. The fraction of time that grating 1 is seen behind grating 2 (data from Experiments 1–3, Figures 2–4) is plotted as a function of the relative wavelength, duty cycles, and speeds, i.e., r = λ2/λ1 (green line), dc2/dc1 (blue line), and v1/v2 (red line).
Experiment 3: The faster grating tends to appear behind
We next turn to examine the effect of the gratings' speed on perceived depth ordering. Figure 4A shows f as a function of the speed of grating 1, with the other parameters (wavelength and duty cycle) being the same for the two gratings. This parameter, too, had a marked effect on f: the faster grating tended to appear behind (F(8,24) = 39.6, p < 10−4; see Methods). To see why this result is consistent with speed being a depth cue, refer to Figure 4B. As we move in the environment, we typically fixate (even if for brief durations) on a nearby object (illustrated by the cross). Now consider two other static objects or surfaces, further in the background nearly behind the fixated object (these two more distant objects are illustrated by the circle and the star). It is clear from the illustration that for the same ego-movement, the further surface would traverse a longer retinal distance, and therefore would have higher retinal speed. The prevalence of these stimulation conditions during normal vision could have led to a learned association between faster speed and further surfaces, which revealed itself in the results of this experiment.
Figure 4.
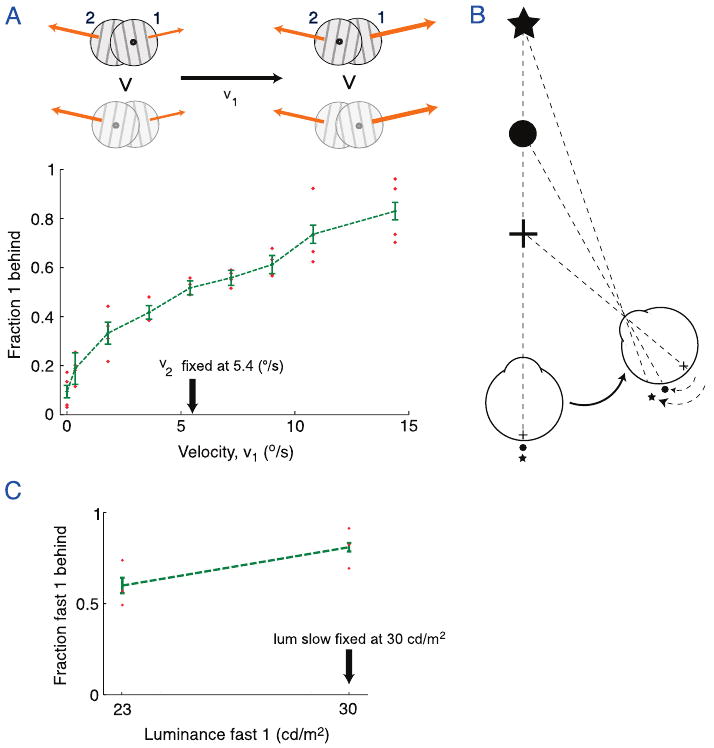
The grating with the higher speed appears behind the other grating more often. (A) The fraction of time f that grating 1 was perceived to be moving behind grating 2 increases as a function of its speed (the speed of grating 2 was fixed at 5.4°/s, as indicated by the black arrow). (B) A schematic diagram to explain the systematic relation caused by ego motion between the retinal speed of objects and their distances from the observer (see text). (C) The fraction of time f that the faster grating 1 was perceived to be moving behind the slower grating 2 as a function of the luminance of the grating 1. The luminance of grating 2 was fixed at 30 cd/m2; the speeds of the gratings were fixed at 5.4°/s and 0.18°/s.
An alternative interpretation of the results of Experiment 3 is that higher speeds lead to blurring of the grating's bars and/or a reduction of their perceived contrast, and that it is those effects that indirectly cause the faster grating to appear behind more often. Figure 4C shows f for two luminance values of the faster grating 1 while the slower grating 2 had fixed luminance (Experiment 3b). One luminance value (30 cd/m2) was equal to that of the slower grating. The second value (23 cd/m2) was such that the faster grating had clearly a higher contrast in relation to the bright background (with luminance 76 cd/m2) than that of the slower grating. Even when the apparent contrast of the faster grating was higher than that of the slower grating, the faster grating was still perceived as being behind for most of the time for two of the three subjects tested (see Methods). Hence, this additional test casts serious doubts on the alternative hypothesis that the speed effects on the depth ordering was purely due to speed-related changes in perceived contrast of the gratings. Figure 4C also shows that increasing the contrast of the faster grating (i.e., decreasing its luminance) reduces the fraction of time that it was perceived as moving behind the lower contrast grating. This effect was significant for all subjects (see Methods). Therefore, luminance differences also act as a depth cue in our stimulus, favoring the lower contrast grating to be perceived as moving behind the higher contrast grating. It is interesting to note that luminance differences have also been shown to affect coherence and transparent motion perception in plaids (Adelson & Movshon, 1982; Vallortigara & Bressan, 1991). We did not test the effect of blurring the gratings; however, note that even if apparent contrast reduction and/or blurring played some part in mediating the results of Experiment 3, those effects also arise in natural viewing conditions when objects move fast, and therefore may not be separable from the direct effects of speed itself.
Comparison of the effects of wavelength, duty cycle and speed on f
The strength of effects of the three parameters tested in Experiments 1–3 are compared in Figure 5. The fraction of time that grating 1 was seen behind grating 2 is plotted against the ratio of the parameter varied in each of the experiments—λ2/λ1 (green line), dc2/dc1 (blue line), and v1/v2 (red line) for the wavelength, duty cycle, and speed ratios, respectively. (The results of Experiment 3 were plotted against the inverse ratio to obtain a monotonically increasing function.) This allows a comparison of the strength of effect of the three parameters in dimensionless units. The effect of wavelength ratio on f is clearly stronger than that of the other two parameters: varying λ2/λ1 from 1:3 to 3:1 causes f to change from its lowest and highest observed mean values, ∼0.02 and ∼0.9, respectively.
Although the curves have non-constant slopes, locally the slope of f against λ2/λ1 is higher at virtually every point than that of f against dc2/dc1 or v1/v2. Indeed, a grating with a wavelength equal to half that of the other grating is seen behind as little as 10% of the time, while a grating with a duty cycle half that of the other is still seen behind close to 30% of the time, and similarly for speed. Furthermore, varying wavelength ratio was the only manipulation that could produce almost exclusive dominance of one specific depth ordering: neither duty cycle nor speed manipulation produced such extreme values of f (i.e., close to 0 or 1), even for ratios that were much larger than those used for wavelength.
Experiment 4: Wavelength differences can override binocular disparity as a depth cue
Finally, we sought to determine whether a pictorial depth cue could be strong enough so as to counteract, or at least reduce the effect of stereoscopic depth cues (Figure 6). We therefore presented observers with displays in which one of the two gratings has non-zero stereoscopic disparity, while the other had zero disparity (same as the fixation plane; see Methods). In addition, the wavelength of one of the gratings was varied, similarly to Experiment 1a. (We choose wavelength since it was found to have the strongest effect on f, see above.) Figure 4 shows the results; f is plotted against λ1 for two configurations: when grating 2 had positive disparity (the bottom, blue curve) and when it—as well as grating 1—had zero disparity (top, green curve; note that λ2 was fixed at the value of 4.1° in this experiment, as indicated by the arrow, which is why the value of f = 0.5 is obtained at this much larger value of λ1 than that observed in Experiment 1a). The results indicate that the depth cue of wavelength ratio can indeed have a marked, even decisive effect on the perceived depth ordering of the two gratings, even in the presence of stereoscopic disparity that favors the opposite depth relationship. Starting from the symmetric (pictorial) situation of wavelength ratios of 1 (right-most data points on the two curves, λ1 = 4.1°), we find that, while in the absence of stereoscopic disparity f = 0.5 as expected, the addition of positive disparity to grating 2 causes f to drop to 0, i.e., grating 1 is never observed as being in the back. But by decreasing the wavelength ratio to ∼1:4 (λ1 ∼ 1°), one can restore f to a value near 0.5, i.e., cause grating 1 to be observed as being in the back roughly half of the time in spite of the continual presence of disparity information to the contrary. As the wavelength ratio is further decrease to below 1:8 (λ1 < 0.5°), f approaches the maximum value of 1, i.e., grating 1 is seen in the back most of the time, disparity information to the contrary notwithstanding. Thus, although the addition of stereoscopic disparity clearly has an effect on the perception of depth ordering of the gratings, this cue can nevertheless be counteracted by pictorial depth cues, specifically wavelength ratio.
Figure 6.
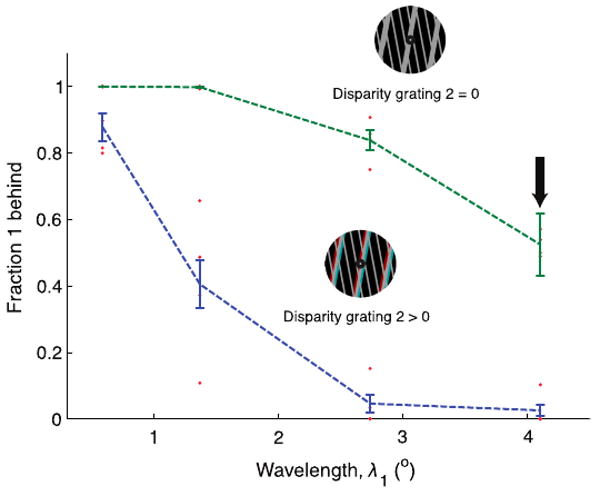
Wavelength differences can override binocular disparity as a depth cue. The fraction of time that grating 1 is perceived as being behind grating 2 is plotted as a function of the wavelength of grating 1 for two disparity conditions. In one condition, both gratings had zero disparity (top, green curve) whereas in the other condition grating 2 had positive disparity (bottom, blue curve). The positive disparity made grating 2 appear clearly behind grating 1 and the fixation point when the two gratings had the same wavelength (λ1 = λ2 = 4.1°, indicated by the arrow), but reducing λ1 (while keeping λ2 fixed) could counteract the disparity and cause grating 1 to be seen behind more often (the reader might check this by using red/green glasses with the red filter positioned in front of the left eye).
Experiment 5: Depth ordering probabilities in surfaces of random dots
We have shown that relative wavelength, duty cycle, and speed bias the probabilities of depth ordering in superimposed drifting gratings. We proceeded to study the generality of our results by using other common planar surfaces, in this case superimposed moving surfaces made of random dots. In Experiment 5a, one of the surfaces had fixed global scale and duty cycle; the global scale and the duty cycle of the second surface were varied from trial to trial. The global scale was varied by changing the dot density inversely proportional to the square of the dot size. The duty cycle was varied by modifying for a given scale the dot size alone. Figure 7A shows that scale and duty cycle had strong effects on the depth ordering of the superimposed random dot surfaces for all subjects tested (see Methods). The surface with the lowest scale tended to appear behind for most of the time, and so did the surface with the lowest duty cycle. These results parallel the results with superimposed drifting gratings in that scale (equivalent to wavelength in the case of gratings) and duty cycle play an important role as a depth cues and modify smoothly the fraction of time that one surface is perceived as being behind the other.
Figure 7.

Global scale, duty cycle, and speed have strong effects on the depth ordering of superimposed random dot moving surfaces, similar to those produced on superimposed drifting gratings. (A) Fraction of time that surface 1 is perceived as being behind surface 2 decreases as a function of its scale for three different duty cycles ratios. The fraction also decreases as a function of the duty cycle (duty cycle increases from top to bottom). The scale is measured in relation to the reference surface 2. (B) Fraction of time that surface 1 is perceived as being behind surface 2 as a function of its speed ratio v1/v2 (the speed of surface 2 was fixed at 5.4°/s).
The effects of dot density and dot size on f were also assessed. The dot density had no significant effect on the fraction of time that one surface was perceived as being behind the other (see Methods). The dot size had a strong effect on f. Therefore, most or all of the variance in f produced by varying image scale and duty cycle can be accounted for the dot size alone (i.e., duty cycle). This result contrasts with that found in the previous experiments, where it has been shown that wavelength has a stronger effect on f than that of the duty cycle. The ways in which the surfaces are covered by dots or by much elongated units such as bars could account for those differences. In a stimulus made of a sphere with random dots, Brouwer and van Ee (2006) showed that the dot density affected alternation rate during passive viewing. However, they did not test whether differences in dot density in the front and back surfaces of the sphere resulted in rotation asymmetries, i.e., a preference for the rotation sign in which the back surface is made of higher density dots than the front surface. Our results with planar surfaces strongly suggest that, in fact, the higher dot density surface in the back with the lower dot density in the front might be the preferred depth ordering also in non-planar surfaces such as spheres.
Figure 7B shows the results of Experiment 5b, where the speed of one surface of random dots varied while the speed of the other remained fixed. The faster surface is perceived as being behind the slower one for larger amounts of time for all subjects (see Methods), similarly to what it was found in the gratings' experiment. In particular, when one of the surfaces moves very slowly, it appears behind the other with probability close to zero. Previous work has found no effect on speed on the probabilities of depth ordering in a similar random dot stimulus (Mamassian & Wallace, 2003). There, either the use of short term presentations of a few hundreds of milliseconds, instead of the long term presentations used in our experiment, or restricted speed ratios tested could explain their lack of speed effects on the depth ordering of superimposed random dot sets.
Discussion
Motion and depth perception are two aspects of the visual world that are tightly related (e.g., KDE, Wallach & O'Connell, 1953). In displays comprised of two superimposed drifting gratings, separation in depth is observed when the gratings are perceived to move transparently in different directions (Adelson & Movshon, 1982; Farell & Li, 2004; Stoner et al., 1990; Trueswell & Hayhoe, 1993; Vallortigara & Bressan, 1991; Wallach, 1935); see also (Holcombe, 2001; Kawabe & Miura, 2006). In contrast, when the gratings are perceived as a pattern moving in a single direction, they are seen as being at the same depth plane. This qualitative observation is in itself compelling evidence for a perceptual coupling between motion and depth. In this study, we sought to study quantitatively the effects of pictorial depth cues and motion parameters on the perception of depth ordering. We therefore used stimuli that were previously shown to elicit only transparent motion (i.e., no pattern motion) during long presentations by setting the angle between the directions of motion of the two gratings to the large value of 160°. During long presentations of such displays, numerous and conspicuous perceptual alternations of the perceived depth ordering of the two gratings are observed. We asked observers to continually indicate which of the two gratings was seen as moving behind the other and calculated the effects of a grating's spatial wavelength, duty cycle, speed, and stereoscopic disparity on the fraction of time, f, that it was perceived to move behind the other grating.
All of the parameters tested produced strong and lawful effects on our dependent variable, f. The grating with shorter wavelength, lower duty cycle, or higher speed was perceived as being behind the other for a fraction of time larger than one half (the same dependences were obtained when superimposed random dot surfaces were used instead of gratings). These results suggest that similar gratings (surfaces, more generally) are interpreted by the visual system as having identical form and speed in the outside world—or, at the very least, that their physical form and speed are not as different as they are on the retinal image. This, in turn, would lead to attributing the (retinal) differences in form parameters and speed between the two gratings to differences in how far each surface is from the observer. Indeed, the further of two identical gratings would cast a retinal image with shorter wavelength than the closer one (Experiment 1); the further of two bars of identical width would cast a narrower image than the closer one (Experiment 2, duty cycle) and the further of two background surfaces would travel a larger retinal distance as an observer moves about the environment looking at a proximal object (Experiment 3; cf. Figure 4). These depth cues occur in natural viewing conditions and are especially useful for distant objects, where disparity and accommodation cannot provide reliable depth information. It is important to note, however, that they do not convey information about the relative distance of the gratings, but only about probabilities of depth ordering. However, one could measure the strength of these depth cues in relation with disparity by measuring the amount of stereoscopic disparity needed to counteract differences in gratings' parameters as a function of the magnitude of those differences. Experiment 4 provides preliminary evidence that this is possible.
The dependence of f on the form and motion parameters was gradual, and its observed values covered wide ranges between its minimal and maximal possible values of zero and one. There results are consistent with those from other domains of perceptual bi-stability, where it has been shown that the fraction of dominance time changes gradually with parametric manipulations of the stimulus. In binocular rivalry, increasing the contrast of one of the monocular images leads to a gradual increase of the fraction of time that image dominates over the other (Blake et al., 2003; Leopold & Logothetis, 1996; Levelt, 1967). In the “motion-induced blindness” phenomenon, the fraction of time that the target remains invisible depends gradually as a function of the target size and contrast and increases gradually as the number of dynamic random dots in the display increases (Bonneh et al., 2001). And in displays consisting of two superimposed drifting gratings, the fraction of time spent perceiving them as sliding transparently over each other increases gradually and near-linearly as the angle between the gratings' individual directions of motion increases (Hupé & Rubin, 2003).
The above results suggest that the fraction of time that a percept is dominant provides a measure of the probability assigned by the visual system to it as being a valid interpretation of the underlying scene. Consider the displays used in the present study: since no single cue provides complete information about the depth ordering of the two gratings, it is only reasonable that the effect of changing a particular cue's parametric value on the estimation of the depth map should be probabilistic. Indeed, there is much recent evidence that the brain is continually engaged in computing probability estimations of the possible underlying three dimensional scenes that could give rise to the retinal image, and that in doing so it uses prior knowledge about the statistics of the environment (Knill & Richards, 1996; Rao, Olshausen, & Lewicki, 2002); see also (e.g., van Ee, Adams, & Mamassian, 2003). In turn, the gradual variation of f (dominance duration) suggests that when two distinct image interpretations are judged to have finite probability values (i.e., when the stimulus is highly ambiguous), the brain “hedges its bets” between the two, rather than choosing the likelier alternative and sticking with it during the whole presentation of the stimulus (i.e., as if the brain were sampling the estimated posterior probability distribution of the interpretations instead of choosing the interpretation of highest probability). Perceptual alternations occur even when the probabilities of the two possible interpretations appear to be grossly imbalanced: even when f departs from 0.5 significantly, it approaches the values of 0 or 1 gradually, rather than “clipping” to them abruptly (Figures 2–4). This behavior is intriguingly reminiscent of the well-known “matching law” (Herrnstein, 1970), which states that animals divide their consummatory time between two sources of food in a proportion that matches the relative reinforcement obtained from each one. In the latter domain, it has been shown that this exploratory strategy often maximizes reward or food intake (Herrnstein, 1997); see also (e.g., Trommershäuser, Maloney, & Landy, 2003) and references therein for different reward maximization criteria in motor tasks). It is therefore tempting to hypothesize that the intermediate f values observed in bi-stable perception similarly represent a “perceptual exploratory strategy” that allows for optimal inferences about the nature of the underlying scene, one that might not be attained if the brain sticks to a single (possibly incorrect, albeit more probable) interpretation.
A natural question that arises from our study is whether the form parameters we studied have similar effects on static stimuli and on figure/ground segmentation of planar objects. Informal observations show that the effects of wavelength and duty cycle are similar for static stimuli as for moving stimuli (see top stimulus panel of Figure 6; here the shorter wavelength grating is perceived as being behind the longer wavelength grating, as in the case of moving gratings). However, one important difference is that the sense of depth separation of the two surfaces in the static display is weaker than that on the moving stimulus. One possible interpretation for this is that the systematic relation between surface distance and (retinal) spatial wavelength is learned primarily during ego motion, and therefore extends less conspicuously to static surfaces. Although the effects of wavelength are qualitatively similar in both static and moving stimuli, wavelength content seems to play an opposite role in order to segment objects from background in planar images. Klymenko and Weisstein (1986) examined the influence of wavelength on the figure/ground organization of a modified faces/vase illusion. Observers were presented with stimuli where each object silhouette was made of a sinusoidal grating of a different wavelength (all gratings were horizontally oriented). The authors recorded which object was perceived as “figure” (in front) in trials of 30 s, and found that the object rendered from the higher spatial frequency (shorter wavelength) was perceived as figure more often. This result contrasts with what we found in the case of superimposed moving surfaces, since in the latter case the shorter wavelength surface appears behind more often. These different results can be due to the fact that in our stimuli neither surface is perceived as background, but both are perceived as “objects” lying between the aperture and an undefined bright background that is behind both of them. This clearly differs with what happens in the faces/vase stimulus, in which one surface looses its identity and becomes undefined background.
An important set of questions that remain open concern the neural basis of the phenomena we report in this study. There is growing evidence that the neural correlate of the perceptual alternations is a concomitant increase and decrease in the activities of the neuronal populations representing the dominant and suppressed percepts, respectively (Logothetis, 1998; Polonsky, Blake, Braun, & Heeger, 2000; Tong, 2001). This, in turn, is thought to be the result of (direct or indirect) inhibition between the populations that compete for dominance (e.g., Blake, 1989; Laing & Chow, 2002; Lehky, 1988; Moreno-Bote, Rinzel, & Rubin, 2007; Shpiro, Curtu, Rinzel, & Rubin, 2007; Wilson, 2003). In such networks, gradual changes in the relative dominance times arise naturally from changes in input strength to one or both populations. The phenomenon we have observed—a gradual shift in the fraction of time a surface is perceived to be further away as the parametric values of depth cues vary—has an appealing interpretation also at the neural level. This interpretation is derived from an analogy to the case of binocular rivalry, where the increased fraction of dominance time caused by increasing the contrast of a monocular image is thought to reflect the increased strength of input to the neural populations representing that image (Blake, 2001; Blake & Logothetis, 2002). Similarly, it is possible that increasing (say) the wavelength of one of two overlapping surfaces has the effect of strengthening the input to the neural population that represents it as the “near” surface (and/or weakening the input to the competing population that would have represented the same surface as the “far” one), leading to a decrease in the fraction of time that it is perceived as being behind the other surface. Existing physiological data provide a possible neural substrate for such a mechanism. Sub-populations of MT neurons have been reported that are selective not only to the direction of motion of a stimulus (Albright, Desimone, & Gross, 1984; Britten, Shadlen, Newsome, & Movshon, 1992), but also to whether it has far-, near- or zero-disparity has already been reported (Bradley, Qian, & Andersen, 1995; DeAngelis & Newsome, 1999; Maunsell & Van Essen, 1983). Similar groups of neurons have been found also in V1 and V2 (Livingstone & Hubel, 1988). These (or related) neurons may represent surface depth ordering more generally, i.e., not only from disparity cues. Since the pairing of far (near) stimuli and shorter (longer) spatial wavelength will have been encountered frequently under natural viewing conditions, the brain could have adapted (either developmentally or during evolution) to represent this robust statistical property of the environment in the tuning properties of cortical neurons. This predicts that spatial frequency tuning and depth tuning in those neurons should covary, with neurons preferring far surfaces having also higher spatial frequency preferences, a conjecture that could be tested using electrophysiology.
Acknowledgments
We thank Bob Shapley and Ed Vessel for useful discussions. We are also very grateful to Ed Vessel, Timm Lochmann, and Jan Drugowitsch for their help in the statistical analysis of the data. Supported by the Swartz Foundation Program for Theoretical Neuroscience and the National Eye Institute grants T32EY071580 and R01EY014030.
Footnotes
Commercial relationships: none.
Contributor Information
Rubén Moreno-Bote, Email: rmoreno@bcs.rochester.edu, Center for Neural Science, New York University, New York, USA.
Asya Shpiro, Email: asya@cns.nyu.edu, Center for Neural Science, New York University, New York, USA.
John Rinzel, Email: rinzel@cns.nyu.edu, Center for Neural Science, New York University, New York, USA & Courant Institute of Mathematical Sciences, New York University, New York, USA.
Nava Rubin, Email: Nava.Rubin@nyu.edu, Center for Neural Science, New York University, New York, USA.
References
- Adelson EH, Movshon JA. Phenomenal coherence of moving visual patterns. Nature. 1982;300:523–525. doi: 10.1038/300523a0. [DOI] [PubMed] [Google Scholar]
- Albright TD, Desimone R, Gross CG. Columnar organization of directionally selective cells in visual area MT of the macaque. Journal of Neurophysiology. 1984;51:16–31. doi: 10.1152/jn.1984.51.1.16. [DOI] [PubMed] [Google Scholar]
- Blake R. A neural theory of binocular rivalry. Psychological Review. 1989;96:145–167. doi: 10.1037/0033-295x.96.1.145. [DOI] [PubMed] [Google Scholar]
- Blake R. A primer on binocular rivalry. Brain and Mind. 2001;2:5–38. [Google Scholar]
- Blake R, Logothetis NK. Visual competition. Nature Reviews, Neuroscience. 2002;3:13–21. doi: 10.1038/nrn701. [DOI] [PubMed] [Google Scholar]
- Blake R, Sobel KV, Gilroy LA. Visual motion retards alternations between conflicting perceptual interpretations. Neuron. 2003;39:869–878. doi: 10.1016/s0896-6273(03)00495-1. [DOI] [PubMed] [Google Scholar]
- Bonneh YS, Cooperman A, Sagi D. Motion-induced blindness in normal observers. Nature. 2001;411:798–801. doi: 10.1038/35081073. [DOI] [PubMed] [Google Scholar]
- Bradley DC, Qian N, Andersen RA. Integration of motion and stereopsis in middle temporal cortical area of macaques. Nature. 1995;373:609–611. doi: 10.1038/373609a0. [DOI] [PubMed] [Google Scholar]
- Britten KH, Shadlen MN, Newsome WT, Movshon JA. The analysis of visual motion: A comparison of neuronal and psychophysical performance. Journal of Neuroscience. 1992;12:4745–4765. doi: 10.1523/JNEUROSCI.12-12-04745.1992. [DOI] [PMC free article] [PubMed] [Google Scholar]
- Brouwer GJ, van Ee R. Endogenous influences on perceptual bistability depend on exogenous stimulus characteristics. Vision Research. 2006;46:3393–3402. doi: 10.1016/j.visres.2006.03.016. [DOI] [PubMed] [Google Scholar]
- DeAngelis GC, Newsome WT. Organization of disparity-selective neurons in macaque area MT. Journal of Neuroscience. 1999;19:1398–1415. doi: 10.1523/JNEUROSCI.19-04-01398.1999. [DOI] [PMC free article] [PubMed] [Google Scholar]
- Farell B, Li S. Seeing depth coherence and transparency. Journal of Vision. 2004;4(3):8, 209–223. doi: 10.1167/4.3.8. http://journalofvision.org/4/3/8/, doi:10.1167/4.3.8. [DOI] [PubMed]
- Goldstein EB. Sensation and perception. Belmont, CA: Thomson Wadsworth; 2007. [Google Scholar]
- Herrnstein RJ. On the law of effect. Journal of the Experimental Analysis of Behavior. 1970;13:243–266. doi: 10.1901/jeab.1970.13-243. [DOI] [PMC free article] [PubMed] [Google Scholar]
- Herrnstein RJ. The matching law. Cambridge, MA: Harvard University Press; 1997. [Google Scholar]
- Holcombe AO. A purely temporal transparency mechanism in the visual system. Perception. 2001;30:1311–1320. doi: 10.1068/p3273. [DOI] [PubMed] [Google Scholar]
- Hupé JM, Rubin N. The dynamics of bistable alternation in ambiguous motion displays: A fresh look at plaids. Vision Research. 2003;43:531–548. doi: 10.1016/s0042-6989(02)00593-x. [DOI] [PubMed] [Google Scholar]
- Kawabe T, Miura K. Recovering depth-order from orientation-defined junctions. Psychological Research. 2006;70:375–383. doi: 10.1007/s00426-005-0227-8. [DOI] [PubMed] [Google Scholar]
- Klymenko V, Weisstein N. Spatial frequency differences can determine figure-ground organization. Journal Experimental Psychology: Human Perception and Performance. 1986;12:324–330. doi: 10.1037//0096-1523.12.3.324. [DOI] [PubMed] [Google Scholar]
- Knill DC, Richards W. Perception as Bayesian inference. Cambridge: Cambridge University Press; 1996. [Google Scholar]
- Koffka K. Principles of Gestalt Psychology. New York: Harcourt; 1935. [Google Scholar]
- Laing CR, Chow CC. A spiking neuron model for binocular rivalry. Journal of Computational Neuroscience. 2002;12:39–53. doi: 10.1023/a:1014942129705. [DOI] [PubMed] [Google Scholar]
- Lehky SR. An astable multivibrator model of binocular rivalry. Perception. 1988;17:215–228. doi: 10.1068/p170215. [DOI] [PubMed] [Google Scholar]
- Leopold DA, Logothetis NK. Activity changes in early visual cortex reflect monkeys' percepts during binocular rivalry. Nature. 1996;379:549–553. doi: 10.1038/379549a0. [DOI] [PubMed] [Google Scholar]
- Levelt WJ. Note on the distribution of dominance times in binocular rivalry. British Journal of Psychology. 1967;58:143–145. doi: 10.1111/j.2044-8295.1967.tb01068.x. [DOI] [PubMed] [Google Scholar]
- Livingstone M, Hubel D. Segregation of form, color, movement, and depth: Anatomy, physiology, and perception. Science. 1988;240:740–749. doi: 10.1126/science.3283936. [DOI] [PubMed] [Google Scholar]
- Logothetis NK. A primer on binocular rivalry, including current controversies. Philosophical Transactions of the Royal Society of London B: Biological Sciences. 1998;353:1801–1818. doi: 10.1098/rstb.1998.0333. [DOI] [PMC free article] [PubMed] [Google Scholar]
- Mamassian P, Wallace JM. Depth assignment in motion transparency [Abstract] Journal of Vision. 2003;3(9):805–805a. http://journalofvision.org/3/9/805/, doi:10.1167/3.9.805.
- Masin SC. Petter's effect in patterns formed by outlined surfaces. Perceptual and Motor Skills. 2000;90:595–600. doi: 10.2466/pms.2000.90.2.595. [DOI] [PubMed] [Google Scholar]
- Maunsell JH, Van Essen DC. Functional properties of neurons in middle temporal visual area of the macaque monkey: II. Binocular interactions and sensitivity to binocular disparity. Journal of Neurophysiology. 1983;49:1148–1167. doi: 10.1152/jn.1983.49.5.1148. [DOI] [PubMed] [Google Scholar]
- Moreno-Bote R, Rinzel J, Rubin N. Noise-induced alternations in an attractor network model of perceptual bistability. Journal of Neurophysiology. 2007;98:1125–1139. doi: 10.1152/jn.00116.2007. [DOI] [PMC free article] [PubMed] [Google Scholar]
- Necker LA. Observations on some remarkable phenomenon which occurs on viewing a figure of a crystal of geometrical solid. London and Edinburgh Philosophical Magazine and Journal of Science. 1832;3:329–337. [Google Scholar]
- Polonsky A, Blake R, Braun J, Heeger DJ. Neuronal activity in human primary visual cortex correlates with perception during binocular rivalry. Nature Neuroscience. 2000;3:1153–1159. doi: 10.1038/80676. [DOI] [PubMed] [Google Scholar]
- Rao R, Olshausen B, Lewicki M. Probabilistic models of the brain: Perception and neural function. Cambridge: Cambridge University Press; 2002. [Google Scholar]
- Rubin E. Figure and ground. In: Beardslee DC, Wertheimer M, editors. Readings in perception. Princeton, NJ: D. Van Nostrand Company, Inc; 1958. pp. 194–203. [Google Scholar]
- Rubin N, Hupé JM. Dynamics of perceptual bistability: Plaids and binocular rivalry compared. In: Alais D, Blake R, editors. Binocular rivalry. Cambridge, MA: MIT Press; 2004. pp. 137–154. [Google Scholar]
- Shpiro A, Curtu R, Rinzel J, Rubin N. Dynamical characteristics common to neuronal competition models. Journal of Neurophysiology. 2007;97:462–473. doi: 10.1152/jn.00604.2006. [DOI] [PMC free article] [PubMed] [Google Scholar]
- Stoner GR, Albright TD, Ramachandran VS. Transparency and coherence in human motion perception. Nature. 1990;344:153–155. doi: 10.1038/344153a0. [DOI] [PubMed] [Google Scholar]
- Tong F. Competing theories of binocular rivalry. Brain and Mind. 2001;2:55–83. [Google Scholar]
- Trommershäuser J, Maloney LT, Landy MS. Statistical decision theory and trade-offs in the control of motor response. Spatial Vision. 2003;16:255–275. doi: 10.1163/156856803322467527. [DOI] [PubMed] [Google Scholar]
- Trueswell JC, Hayhoe MM. Surface segmentation mechanisms and motion perception. Vision Research. 1993;33:313–328. doi: 10.1016/0042-6989(93)90088-e. [DOI] [PubMed] [Google Scholar]
- Vallortigara G, Bressan P. Occlusion and the perception of coherent motion. Vision Research. 1991;31:1967–1978. doi: 10.1016/0042-6989(91)90191-7. [DOI] [PubMed] [Google Scholar]
- van Ee R, Adams WJ, Mamassian P. Bayesian modeling of cue interaction: Bistability in stereoscopic slant perception. Journal of the Optical Society of America A, Optics, Image Science, and Vision. 2003;20:1398–1406. doi: 10.1364/josaa.20.001398. [DOI] [PubMed] [Google Scholar]
- Wallach H. Uber visuell wahrgenommene Bewegungsrichtung. Psychologische Forschung. 1935;20:325–380. [Google Scholar]
- Wallach H. On perception. New York: Quadrangle; 1976. [Google Scholar]
- Wallach H, O'Connell DN. The kinetic depth effect. Journal Experimental Psychology: Human Perception and Performance. 1953;45:205–217. doi: 10.1037/h0056880. [DOI] [PubMed] [Google Scholar]
- Wilson HR. Computational evidence for a rivalry hierarchy in vision. Proceedings of the National Academy of Sciences of the United States of America. 2003;100:14499–14503. doi: 10.1073/pnas.2333622100. [DOI] [PMC free article] [PubMed] [Google Scholar]
- Wuerger S, Shapley R, Rubin N. “On the visually perceived direction of motion” by Hans Wallach: 60 years later. Perception. 1996;25:1317–1318. [Google Scholar]