

Abstract
Post-translational arginylation consists in the covalent union of an arginine residue to a Glu, Asp or Cys amino acid at the N-terminal position of proteins. This reaction is catalyzed by the enzyme arginyl-tRNA protein transferase. Using mass spectrometry, we have recently demonstrated in vitro the posttranslational incorporation of arginine into the calcium-binding protein calreticulin (CRT). To further study arginylated-CRT we raised an antibody against the peptide (RDPAIYFK), which contains an arginine followed by the first 7 N-terminal amino acids of mature rat CRT. This antibody specifically recognizes CRT obtained from rat soluble fraction that was arginylated in vitro and also recognizes endogenous arginylated CRT from NIH 3T3 cells in culture, indicating that CRT arginylation takes place in living cells. Using this antibody we found that arginylation of CRT is Ca2+-regulated. In vitro and in NIH 3T3 cells in culture, the level of arginylated-CRT increased with the addition of a Ca2+ chelator to the medium, whereas a decreased arginine incorporation into CRT was found in the presence of Ca2+. The arginylated-CRT was observed in the cytosol, in contrast to the non arginylated CRT which is in the endoplasmic reticulum (ER). Under stress conditions, arginylated-CRT was found associated to stress granules. These results suggest that CRT arginylation occurs in the cytosolic pool of mature CRT (defined by an Asp acid N-terminal) which is probably retro-translocated from the ER.
Keywords: Animals; Arginine; chemistry; Brain; metabolism; Calcium; metabolism; Calreticulin; chemistry; metabolism; Cytosol; metabolism; Endoplasmic Reticulum; metabolism; Immunoprecipitation; Mice; NIH 3T3 Cells; Peptides; chemistry; Protein Processing, Post-Translational; Protein Transport; Rats; Time Factors
The complex mechanism of post-translational modification of proteins is important for the regulation of cell functions, however is poorly understood. One post-translational modification is the incorporation of arginine into the NH2-terminus of proteins (1–3). Protein arginylation is catalyzed by the arginyl–tRNA protein transferase (ATE 1) which transfers arginine to a variety of peptides and proteins, all containing acidic amino acids or cystein as NH2- terminal residue (4–6). This enzyme is likely to be cytosolic since it lacks motifs characteristic of either ER targeting or membrane–spanning helical segments (7). In addition, arginyl-tRNA protein transferase fused to GFP has been observed both in the cytosol and nucleus of NIH 3T3 cells (8).
We recently identified by mass spectrometry the in vitro post-translational incorporation of arginine into calreticulin (CRT) (9). Calreticulin is a Ca2+-binding protein which is highly concentrated in the lumen of the ER. This protein functions as a chaperone involved in the control of newly synthesized proteins and as a modulator of Ca2+ signaling and Ca2+ homeostasis (10–13). The primary translation product of rat CRT contains a 17 amino acid N-terminal signal peptide which leads the nascent protein to the ER. As the protein translocates to the lumen of the ER this peptide is cotranslationally cleaved, giving rise to the mature protein that contains an aspartic acid exposed at the NH2-terminus (14). The C-terminus end of CRT contains a KDEL ER retrieval sequence (15–16). Nevertheless, numerous functions of this protein, such as nuclear export receptor activity, anti-thrombotic activity, modulation of cell adhesion and its integrin-dependent Ca2+ signaling (17–20), have led to the proposal that CRT has functions in the cytoplasm, the nucleus and on the cell surface. The presence of CRT in the cytosol, as well as the origin of this cytosolic CRT is still a matter of controversy. It has been reported that cytosolic CRT could be produced either by retro translocation from the lumen to cytoplasmic compartments or by an inefficient CRT translocation to the ER (21–22).
In the study describing CRT as an in vitro acceptor of arginine (9) it has had not been determined whether arginine was incorporated on native CRT or on mature CRT (which contains an acidic amino acid as acceptor residue, 14). Our hypothesis is that arginine is incorporated in mature CRT (9), by the arginyl transferase that specifically adds arginine to acidic N-terminal amino acids (4). Because the cytosolic distribution of this enzyme, it was unclear whether arginylation of CRT was an ER lumenal or a cytosolic event. In the present study we demonstrate that arginylation of CRT occurs on a cytosolic pool of mature CRT and that this modification is regulated by Ca2+.
Experimental Procedures
Chemical Reagents
Chemical reagents, protease inhibitors and prestained molecular weight standard mixture were purchased from Sigma Chemical Co (St. Louis, MO, USA).
Preparation of rat brain soluble extract
Soluble brain extract from rat were prepared as described (23). Briefly, brains were homogenized in 10 mM Tris-HCl buffer (pH 7.8), containing 0.25 M sucrose, 6 mM 2-mercaptoethanol, 1 mM EGTA and a mixture of protease inhibitors (PI: 100 μM leupeptin, 100 μM bestatin, 200 μM N-p-tosyl-L-arginine methyl ester, 2 μg/ml aprotinin and 100 μM amastatin). The homogenate was centrifuged at 100,000 g for 1 h and the supernatant was filtered through a Bio-Gel P6 column (Bio-Rad) equilibrated in 10 mM Tris-HCl buffer (pH 7.8), containing PI. All procedures were performed at 4°C.
Incorporation of 14C-arginine into proteins of soluble brain extract
Proteins of soluble extracts were arginylated as described by Hallak et al., 1991 (23). The incubation system consisted of 7 mg/ml of protein from soluble brain extract, 10 μM 14C-arginine (3 μCi/ml) (New England Nuclear, Boston, MA, USA), 1 mM ATP, 100 mM KCl, 5 mM MgCl2, Tris-HCl buffer pH 7.8, and PI. Standard 14C incorporation assay contained also 1 mM EGTA. To determine the effect of Ca2+ in the 14C-arginine incorporation into CRT, CaCl2 was varied from 0 to 2 mM and EGTA from 0 to 1 mM. Where indicated, 60 pg/ml of bovine CRT (Sigma Chemical Co, St. Louis, MO, USA) was added to the soluble brain extract. After incubation at 37°C for 45 min, arginine incorporation was stopped by the addition of Laemmli sample buffer (24).
Cell cultures
NIH 3T3 cells were plated in 100 mm Petri dishes coated with poly-L-lysine and maintained in Dulbecco’s modified Eagle’s medium (DMEM) supplemented with 10% fetal bovine serum (Gibco-BRL, Gaithersburg, MA). For intracellular Ca2+ depletion, NIH 3T3 cells were washed twice with DMEM and incubated for 15 min with DMEM supplemented with 3 mM EGTA and 2 μM thapsigargin (TG) (dissolved in DMSO 0.65 % w/v) or 10 μM BAPTA AM and 2 μM TG. The concentration of DMSO in the culture medium was 0.02% (v/v) also in control cells.
Preparation of cell lysate
NHI 3T3 cells were grown to 90 % confluence, washed twice with phosphate-buffered saline (PBS) containing 137 mM NaCl, 2.7 mM KCl, 10 mM Na2HPO4, 1.76 mM KH2PO4, pH 7.4 and disrupted in lysis buffer (RIPA) containing 1% w/w Nonidet P40, 1% w/v sodium deoxycholate, 0.1 % w/v SDS, 10 mM Na3PO4, 150 mM NaCl, 50 mM NaF, 2 mM EDTA, pH 7.2. After 10 min at 0°C the cells were scrapped. Total protein concentration was determined using the BCA protein assay kit (Pierce lab, IL USA).
Immunoprecipitation
The stress granule component TIA-1 was immunoprecipitated using an anti-TIA-1 pAb C20 (Santa Cruz Biotechnology, Ca USA) using standard protocols. In brief, 3 μl of anti-TIA-1 polyclonal Ab were incubated for 1 h at 4°C with 25 μl of protein G Sepharose (Amersham Biosciences) in 1 ml of RIPA. The suspension was briefly centrifuged and the pellet washed twice with RIPA. Then, cell lysate (300–500 μg of protein) was added to the suspension and the mixture was rotated overnight at 4°C. The suspension was briefly centrifuged and the supernatant discarded. The protein G Sepharose/C20 antibody/TIA-1 complex was washed 5 times with 500 μl of RIPA prior to the addition of Laemmli sample buffer.
Electrophoresis, autoradiography and immunodetection of proteins
Proteins from soluble brain extract, cell lysate and immunoprecipitated materials were separated using SDS-PAGE (24) and were electrophoretically transferred onto nitrocellulose membrane (25). As primary antibodies, we used mouse anti-CRT mAb (1:2500) (BD Biosciences) that specifically recognizes the C-terminal end of CRT, goat anti-TIA-1 (C20) pAb (1:200) (Santa Cruz biotechnology), and a rabbit anti arginylated-CRT (R-CRT) pAb (dilution 1:60) specific for arginylated calreticulin (this work). The polyclonal antibody R-CRT was custom designed by Eurogentec (Belgium), and directed against the peptide RDPAIYFK coupled to keyhole limpet hemocyanin. This peptide corresponds to the amino terminal sequence of the mature form of calreticulin (devoid of the signal peptide amino acids 1–17), with an arginine residue (bolded) added at the N-terminal end. The rabbit IgGs with affinity for the peptide RDPAIYFK were affinity-purified onto a column linked with the peptide RDPAIYFK, and then eluted with 0.5 M SCNK. In a second affinity chromatography, the peptide DPAIYFK was used to retain IgGs non specific of the arginylated peptide. As secondary antibodies we used biotinylated goat anti-rabbit and anti-mouse IgG (H+L) and horse anti-goat IgG (H+L) (1:15000) (Vector Labs). The nitrocellulose membrane was probed with horseradish peroxidase-labeled streptavidin (1:60000) (Amersham) that was visualized by ECL Western Blotting Detection System (Amersham). After immunostaining, the 14C-arginylated proteins were visualized by autoradiography.
Immunofluorescence
For immunofluorescence, NIH 3T3 cells were grown on glass coverslips to 60% confluence. Cell cultures were washed twice with PBS and fixed with 3% (w/v) formaldehyde in PBS containing 4% w/v sucrose for 30 min at room temperature. After washing with PBS, cells were permeabilized with 0.2% v/v Triton X-100 in PBS for 10 min and then treated with 5% w/v bovine serum albumin for 2 h before the addition of antibodies. Cells were incubated for 4 h at 4°C with primary antibodies and for 2 h at room temperature with secondary antibodies. All antibodies were diluted in PBS containing 5% w/v bovine serum albumin. As primary antibodies, we used rabbit R-CRT pAb (1:60) to detect arginylated CRT, mouse anti-CRT mAb (1:2500) and rabbit anti-CRT (PA3-900) pAb (1:100) (Affinity Bioreagents) to detect CRT, and goat anti-TIA-1(C20) pAb (1:100) to detect TIA-1. As secondary antibodies we used Alexa Fluor 543-conjugated goat anti-rabbit IgG (1:1000) (Molecular Probes), Alexa Fluor 488- conjugated goat anti-mouse IgG (1:1000) (Molecular Probes) and Alexa Fluor 488- conjugated donkey anti-goat IgG (1:1000) (Molecular Probes). Control for the cross talk between the fluorophores was negligible. However, for double staining, TIA-1 and R-CRT (or CRT) labelling were performed sequentially, starting with TIA-1 labelling.
Image acquisition
Confocal images were captured with an inverted Zeiss LSM 5 Pascal Laser confocal microscope (Carl Zeiss, Jenna, Germany), using a 63/1.4 or 100/1.4 Plan-Apochromat objective. Pinholes were set for a nominal axial resolution <0.6 μm. Excitation on the LSM 5 Pascal Laser confocal microscope was with a 25 mW Argon laser emitting at 488 nm, or with a 1 mW helium/neon laser emitting at 543 nm. Emissions were collected using a 505–530-nm band pass filter for Alexa 488, or a 560–615-nm band pass filter for Alexa 543 emission.
RESULTS
Immunodetection of 14C -arginylated calreticulin by anti R-CRT antibody
We raised an antibody against a peptide containing the first seven N-terminal amino acids of mature rat CRT with an additional arginine residue at the N-terminus of the peptide (RDPAIYFK). This antibody (anti-R-CRT) and one that specifically recognizes CRT (anti-CRT) were used to analyze the in vivo arginylation of CRT.
To demonstrate that anti R-CRT antibody specifically recognize R-CRT, the soluble fraction of rat brain homogenates was in vitro arginylated with 14C-arginine for different periods of times. Autoradiography of the 14C-arginylated proteins shows increasing 14C-arginine incorporation during time into several proteins, including CRT at 57 kD (Fig. 1A). Total CRT remains constant during the time course as determined by Western blot of the extracts with an antibody (anti-CRT) that recognize the C-terminal region of CRT (Fig. 1B). In contrast the anti-R-CRT immunostaining progressively increases, at least up to 140 min of incubation (Fig. 1C), with concomitant increase in the 14C-arginine incorporated by this protein (Fig. 1A). This result indicates that the anti-R-CRT antibody directed against the putative N-terminus of the arginylated mature CRT is specific for the arginylated form of CRT, since it was the only band detected after the in vitro arginylation.
Figure 1. Immunodetection of 14C -arginylated calreticulin by anti R-CRT antibody.
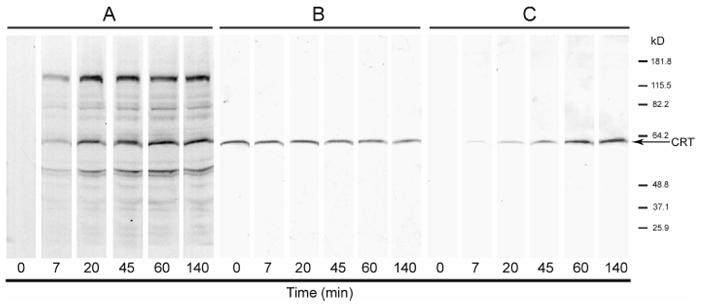
Proteins from soluble fraction of rat brain were 14C-arginylated as described under experimental procedures. The reaction was interrupted at the indicated times by the addition of Laemmli sample buffer. Samples were subjected to SDS-PAGE and blotted. (A) Autoradiography of the 14C-arginylated proteins. (B) Immunostaining with anti-CRT mAb to reveal total CRT (C) Immunostaining with anti-R-CRT pAb to reveal arginylated-CRT. Molecular weights are in kD.
Effect of Ca2+ on the CRT arginylation
CRT is a Ca2+-binding protein whose tertiary structure is modified by this cation (26–27). Therefore, we examined if the arginylation of CRT is affected by the concentration of Ca2+. A soluble fraction from rat brain was 14C-arginylated in vitro in the presence of different Ca2+ concentrations. We found that, the increase of Ca2+ concentration specifically inhibits the 14C-arginine incorporation into CRT (Fig. 2A). The 14C-arginine incorporation was also assayed as a function of the Ca2+ chelator EGTA. Increasing EGTA concentration increases the amount of 14C-arginine incorporated into CRT (Fig. 2B), further indicating that Ca2+ has an inhibitory effect on the arginylation of CRT. When EGTA was omitted in the incubation system, anti-R-CRT immunostaining become negligible, whereas no variation was observed for total CRT (Fig 2C, compare lane 2 with lane 1). To improve sensitivity in the 14C-arginine incorporation assay, we added purified mature bovine CRT to the incubation system and arginylation assays were performed in the presence of different amounts of Ca2+ or EGTA. Mature bovine CRT was chosen as substrate of arginylation since it has a potential arginine acceptor (glutamic acid) at the N-terminus and amino terminal sequence similar to that in rat CRT. We observed that bovine CRT arginylation is also modulated by Ca2+ levels (Fig. 2A′ and B′). Ca2+ modulation of the 14C-arginine incorporation seems to be specific for CRT since the 14C-arginylation of the other protein substrates was not affected by the addition of calcium or of EGTA (Fig. 2, A and B).
Figure 2. Effects of Ca2+ on the incorporation of 14C arginine into calreticulin.
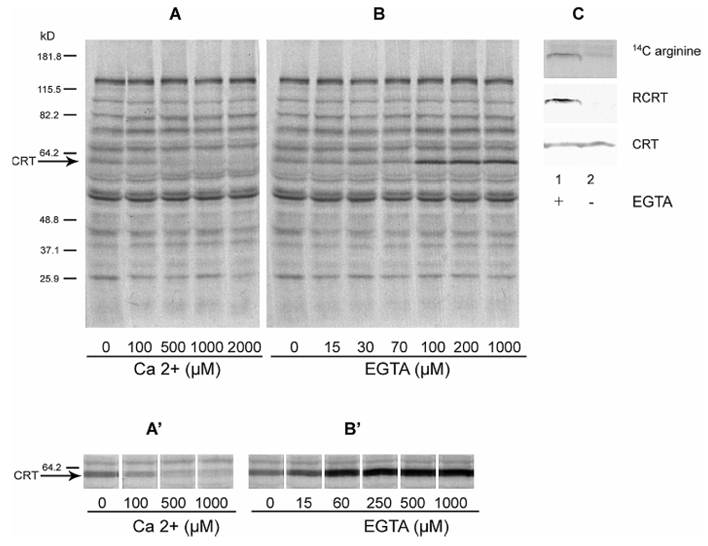
Proteins from soluble fraction of rat brain (panel A and B) or with exogenous bovine calreticulin (panels A′ and B′) were 14C-arginylated as described under experimental procedures. Incubations were carried out at the indicated calcium concentrations (panels A and A′) or EGTA (panels B and B′). After 45 min at 37°C, the samples were subjected to SDS-PAGE and the 14C-arginylated proteins were detected by autoradiography. The arrow indicates the position of CRT. Molecular weights are indicated in kD. Panel C shows the bands corresponding to R-CRT and CRT detected with anti R-CRT polyclonal Ab and anti CRT mAb, respectively, of preparations 14C arginylated in the presence (lane 1) or absence (lane 2) of 1 mM EGTA. The autoradiography of the 14C-arginylated CRT bands are shown at the top of the panel C.
Arginylation of CRT in cultured cells
In addition to the soluble fraction of rat brain, the incorporation of 14C- arginine in CRT was also found in the soluble fraction from COS, CHO and NIH 3T3 cells. It was deemed of importance to examine if CRT arginylation occurs in vivo. This was addressed in mouse NIH 3T3 fibroblasts in culture. These cells showed one of the highest 14C-arginine incorporation rates in CRT and in addition the N terminal sequence used to generate the anti-RCRT antibody is common to both mouse and rat CRT.
The existence of an arginylated isoform of CRT in NIH 3T3 cells was evident in both immunocytochemistry and immunoblot assays. Immunocytochemical assay of NIH 3T3 cells with the anti-R-CRT antibody reveals a scarce, cytosolic-like immunostaining of R-CRT (Fig. 3A, b) with occasional cluster distribution. It is worth noting that the immunostaining for R-CRT lacks the typical ER appearance characteristic of CRT (Fig. 3A, a) and that both stainings do not overlap (Fig. 3A, c). These results indicate that R-CRT is present in cells and that its shows an intracellular localization different from that of lumenal CRT. Moreover when total proteins from NIH 3T3 cells are subjected to immunoblot and probed with the R-CRT antibody, a 57 kD band is recognized by this antibody (Fig. 3B, lane 1), indicating the presence of endogenous R-CRT. Arginylated-CRT and CRT from NIH 3T3 cells show the same electrophoretic mobility, as determined by immunostaining with an antibody that recognizes the C-terminal region of CRT (Figure 3B, lane 3).
Figure 3. Immunodetection of arginylated calreticulin in NIH 3T3 in cultures.
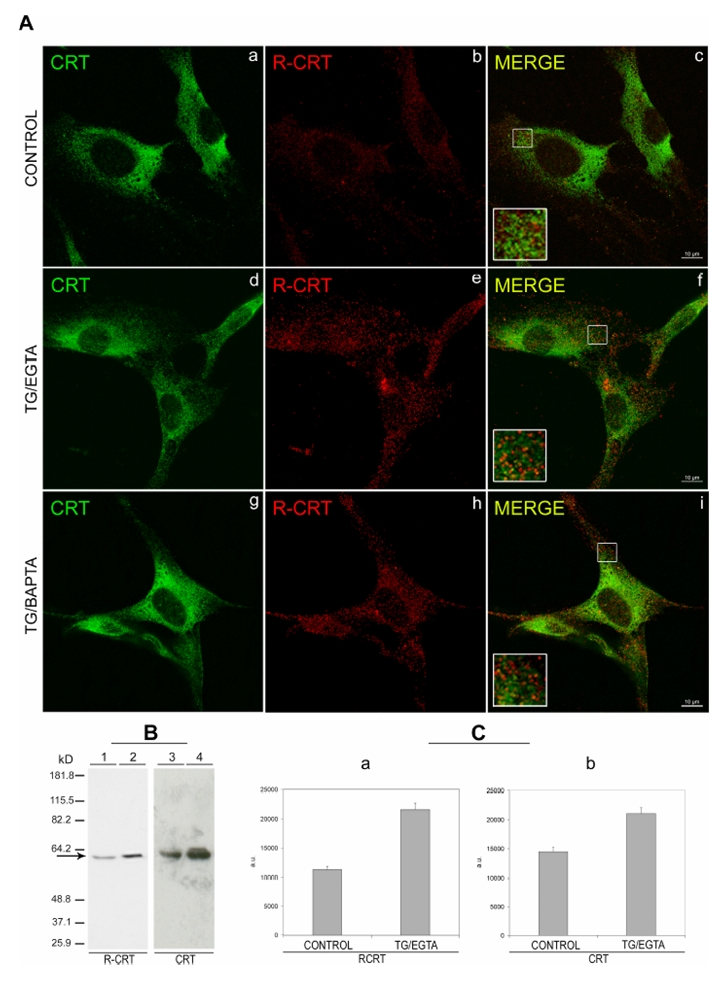
NIH 3T3 cells, treated with 2 μM TG plus 3 mM EGTA (TG/EGTA) or with 2 μM TG plus 10 μM BAPTA-AM (TG/BAPTA-AM) or with vehicle, (control), were incubated for 15 min at 37°C. (A) After treatment, cells were analyzed by immunofluorescence using anti-CRT mAb (CRT) (a, d, and g) to visualize total CRT and with R-CRT pAb (b, e, and h) to visualize R-CRT. Co-localization of proteins was monitored by confocal microscopy. In all three experimental conditions, no immuno colocalization was observed in the merged images or in the zoomed regions of interest (inserts) (c, f, and i). (B) Total protein from NIH 3T3 cells, from control cultures (lanes 1 and 3), or from cultures treated with TG/EGTA as in (A) (lanes 2 and 4), were subjected to SDS-PAGE and analyzed by Western blot with R-CRT pAb (R-CRT) (lanes 1–2), or anti-CRT mAb (CRT) (lanes 3–4) (C). Quantification of Western blots by densitometric scanning using the image analysis system function of the METAMORPH 3.0 software was used to calculate the total value within the area above the threshold for each filter set. The samples were normalized to equal amounts of tubulin. Signals are expressed in arbitrary absorbance units (a.u.) as the mean ± SD of three experiments for R-CRT (a) and CRT (b) antibodies.
To address whether CRT arginylation in cells is also regulated by Ca2+, NIH 3T3 cells were treated with 2 μM of thapsigargin (TG), an sarcoplasmic-endoplasmic-reticulum-Ca2+-ATPase inhibitor capable of depleting lumenal Ca2+ (28), plus 3 mM EGTA or with 2 μM TG plus 10 μM BAPTA-AM, a membrane-permeable Ca2+ chelator. The used of the Ca2+ chelator, EGTA or BAPTA-AM, with the inhibitor TG leads to a decrease in the levels of cytosolic Ca2+ (29–30). We found a significant increase in the level of R-CRT after TG/EGTA treatment both by immunocytochemistry with the anti-R-CRT antibody (Fig 3A, compare e with b) and by Western blot (Fig 3B, compare lane 2 with lane 1). After scanning of the Western blots, a densitometric quantification of R-CRT levels reveals 100% increase of arginylated calreticulin in TG/EGTA treated cells with respect to control cells (Fig 3C, a). The level of total CRT, detected with the antibody that recognizes the C-terminal region of CRT (anti-CRT) (Fig 3C, b), was also increased in TG/EGTA treated cells, although this increment is lower than that for R-CRT. In accordance with these results, it has been reported that TG treatment promotes an increase in CRT gene expression (31). Immunocytochemistry analysis reveals that TG/BAPTA-AM and TG/EGTA treatments induce a prominent clustering of R-CRT (Fig. 3A, e and h), whereas for total CRT only a small condensation in the perinuclear zone is seen (Fig 3A, d and g). As it is observed in control cells, treated cells do not show colocalization of R-CRT and CRT (Fig 3A, f, d and i). Our results indicate that CRT arginylation occurs in living cells and that it is modulated by Ca2+ levels. The reason why we do not observed colocalization between R-CRT and CRT is considerer below.
Arginylated CRT colocalizes with stress granules
After TG treatment of NIH 3T3 cells (Fig 3A, e and h), we found that the R-CRT is sequestered into clusters similar to the punctuate cytoplasmic aggregates found in stress granules (SGs) (32). The presence of R-CRT in SGs was investigated in NIH 3T3 cells by double immunostaining with anti-R-CRT antibody and with TIA-1 antibody, a marker of SGs (32) that is specific for RNA-binding protein TIA-1. After inducing stress by treatment of cells with TG/EGTA, SGs formation was detected as clusters with a robust TIA-1 staining (Fig. 4A, b). Under these experimental conditions, many TIA-1 stained granules colocalized with the labeling of R-CRT (Fig 4A, a and c). In non treated cells, SGs formation was not induced and no colocalization of R-CRT with TIA-1 was observed, with both proteins presenting a diffuse labeling (Fig 4B, d – f). Strikingly, in immunofluorescence assays an anti-CRT mAb (1:2500) (Fig. 3A), did not recognize the R-CRT even when used at higher concentration (1:50) (not shown). This antibody recognizes an epitope localized in the C-terminal domain of CRT whereas the arginylated epitope is localized in the N-terminus. In consequence it is speculated that in SGs, the C-terminal epitope of CRT is probably not accessible to the antibody CRT mAb due to steric hindrance. To support this hypothesis we performed double immunofluorescence in TG/EGTA treated (Fig 4C) and not treated (Fig 4D) NIH 3T3 cells using a rabbit policlonal antibody raised against the entire human CRT and TIA-1 antibody as an SGs marker. In addition to the classical ER immunostaining of CRT which does not colocalize with TIA-1, we observed in TG/EGTA treated cells partial colocalization between CRT and TIA-1 (Fig 4C i) similar to that observed between R-CRT and TIA-1 (Fig. 4A c), indicating the presence of CRT in SGs. In not treated cells (Fig 4D i) no colocalization between CRT and TIA 1 was detected. Double immunofluorescence between R-CRT and total CRT with this policlonal antibody could not be performed because both antibodies were raised in rabbit.
Figure 4. Colocalization of arginylated calreticulin and TIA-1 in NIH 3T3 cells under stress conditions.
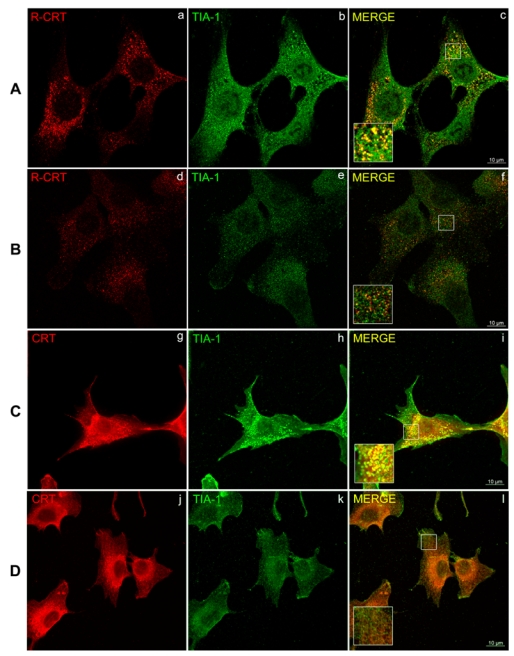
NIH 3T3 cells were cultured in the presence (A and C) or the absence (B and D) of 2 μM TG with 3 mM EGTA for 15 minutes. After treatment, cells were analyzed by double immunofluorescence using R-CRT pAb (a and d) and TIA-1 pAb (b and e) or, anti CRT pAb (g and j) and TIA-1 pAb (h and k). Co-localization of proteins was monitored by confocal microscopy. Yellow pseudo-colour in the merged images (c, f, i and l) and in the zoomed regions of interest (inserts) represent co-localization, resulting from R-CRT and CRT labeling in red and TIA-1 labeling in green.
Co-immunoprecipitation assays to examine the interaction between R-CRT and TIA-1 after TG/EGTA treatment were also performed. Once SGs formation was induced, cell lysate from NIH 3T3 cells were subjected to immunoprecipitation with TIA-1 antibody followed by SDS-PAGE and Western blotting with anti-RCRT pAb. Among the proteins immunoprecipitated by the TIA-1 antibody, R-CRT was immunodetected with anti-R-CRT pAb (Fig 5B, right lane). Immunoprecipitated proteins were also examined by Western blot using the TIA-1 antibody, which recognized a single band of 40 kD (Fig 5A, right lane). A similar analysis was performed under control conditions (unstressed cells), in which only trace amounts of R-CRT were detected among the proteins immunoprecipitated with TIA-1 antibody (Fig 5B, left lane).
Figure 5. Immunoprecipitation of arginylated calreticulin with TIA-1 antibody.
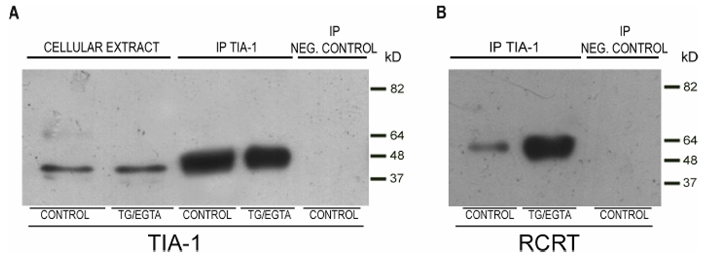
TIA-1 pAb immunoprecipitation assays on cell extracts from NIH 3T3 cells cultured in the absence (control) or the presence (TG/EGTA) of 2 μM TG plus 3 mM EGTA for 15 minutes. Immunoprecipitated proteins (IP TIA-1) and total cellular extract were fractionated by SDS PAGE and transferred to nitrocellulose membranes. The presence of TIA-1 and arginylated-CRT was then analyzed with TIA-1 pAb (A) or with R-CRT pAb (B). Negative control immunoprecipitation was performed in the absence of TIA-1 pAb.
Taken altogether, our results indicate that: a) arginylation of CRT occurs in cultured cells; b) CRT arginylation is affected by calcium levels; and c) R-CRT is localized mainly in the SGs under stress conditions.
DISCUSSION
Studies in a variety of tissues indicate the existence of several proteins that can be in vitro modified by post-translational arginylation (1, 23, 33); nevertheless physiological substrates of arginylation had remained elusive until very recently. Indeed only few proteins whose arginylation take place in vivo had been identified: the enzyme ornithine decarboxylase (34), RGS proteins (35), an N-terminal variant of G protein γ2 subunit (36) and β actin (37). In the present study we demonstrated that CRT, recently identified as an in vitro arginine acceptor by mass spectrometry (9), also is post-translational arginylated in living cells.
Calreticulin is a multifunctional Ca2+- binding protein, involved in a variety of cellular processes (10). Within the ER, Ca2+ levels regulate several functions of CRT such as its interaction with other ER chaperones and with newly synthesized proteins (27). In cytosol, Ca2+ binding to CRT regulates the binding and nuclear export of HIV-1 Rev and glucocorticoid receptor (29). In the present study we demonstrate that the incorporation of arginine in CRT is modulated by Ca2+ levels, being inversely proportional to the Ca2+ concentration. This modulation seems to be specific for this substrate, since among soluble rat brain proteins CRT was the only whose arginylation was inhibited by Ca2+. This results suggest that the arginylation system was not affected by Ca2+levels. A possible explanation to the Ca2+ influence on CRT arginylation can be related to Ca2+-binding induced conformational changes occurring in the tertiary structure of CRT. Upon Ca2+ binding, CRT adopts a more rigid and well-packed tertiary structure with increased thermal stability and increased conformational rigidity (26). This conformational change also leads to the formation of a protease resistant core, containing the N-terminal end of CRT (27). We propose that the high conformational rigidity of this core may also preclude the access of arginyl-tRNA protein transferase to the N-terminal of CRT, thus preventing the covalent binding of arginine. The CRT arginylation in NIH 3T3 cells seems to be also modulated by Ca2+. A significant increase in the labeling of R-CRT was observed after treatment of NIH 3T3 cells with TG/BAPTA-AM or TG/EGTA.
Under stress conditions, R-CRT was segregated in clusters which colocalized with the SGs marker TIA-1 (Figure 4). This result is in agreement with previous studies which showed that the disruption of normal cell homeostasis, like that occurring upon TG treatment, induces the formation of SGs (38–41). A variety of proteins are found among the components of SGs, mainly RNA-binding proteins that regulate mRNA stability (42, 32). SGs also contain some chaperones such as heat shock proteins (HSP) that seem to be required to disperse aggregated TIA-1 in living cells (43). Calreticulin is a well-known ER luminal chaperone and also an mRNA-binding protein (44–48), so the functional role of R-CRT in SGs could be related to these activities.
In summary, in the present study we demonstrate that the post-translational incorporation of arginine into CRT occurs in NIH 3T3 cells and that this modification is regulated by Ca2+. We also demonstrate that the site of arginine incorporation in CRT arises from the cleavage of the N-terminal signal peptide. In agreement with the cytosolic localization of arginyl tRNA protein transferase (8), in vivo arginylation of CRT suggests that CRT is first co-translationally translocated to the ER for the cleavage of the signal peptide and then retrotranslocated to the cytosol for the posttranslational N-terminal incorporation of arginine. Despite the KDEL ER retrieval sequence of CRT (16, 15), numerous functions of this protein have been proposed to occur outside the ER (17–19, 10). Even when biochemical and functional evidences suggest the presence of CRT in the cytosol and some mechanisms by which CRT could reach this localization have been proposed (21–22), up to now cytosolic CRT had been difficult to demonstrate. By using the anti R-CRT antibody we were able to distinguish for the first time, with immunocytochemistry, ER-lumen CRT from retro-translocated, cytosolic CRT. Further investigations will be required to establish if CRT arginylation is required for its cytosolic functions.
Acknowledgments
The authors are grateful to Drs. H. S. Barra, D. Beltramo, B.L. Caputto, G. Pilar and H. Maccioni for their invaluable and helpful discussions and G. Schachner, S. Deza, and C. Mas for excellent technical assistance. We thank Dr G. Boccaccio for the anti TIA 1 antibody. This work was supported by grants from the Agencia Nacional de Promocion Cientifica y Technologica (BID 802/OC-AR), CONICET, SECyT Uniiversidad Nacional de Cordoba and from SECyT (Argentina)-ECOS (France). M.E.H is a member of the Research career CONICET and M. B. D, M. R. G. and M. A. C are recipients of a fellowship from CONICET.
The abbreviations used are
- CRT
calreticulin
- ER
endoplasmic reticulum
- R-CRT
arginylated calreticulin
- TG
thapsigargin
- PI
protease inhibitors
References
- 1.Kaji H, Novelli GD, Kaji AA. Biochim Biophys Acta. 1963;76:474–477. [PubMed] [Google Scholar]
- 2.Soffer RL. Biochim Biophys Acta. 1968;155:228–240. doi: 10.1016/0005-2787(68)90352-3. [DOI] [PubMed] [Google Scholar]
- 3.Barra HS, Rodriguez JA, Arce CA, Caputto R. J Neurochem. 1973;20:97–108. doi: 10.1111/j.1471-4159.1973.tb12108.x. [DOI] [PubMed] [Google Scholar]
- 4.Soffer RL. J Biol Chem. 1971;246:1602–1606. [PubMed] [Google Scholar]
- 5.Bongiovanni G, Fidelio GD, Barra HS, Hallak ME. Neuroreport. 1995;7:326–328. [PubMed] [Google Scholar]
- 6.Gonda DK, Bachmair A, Wunning I, Tobias JW, Lane WS, Varshavsky A. J Biol Chem. 1989;264:16700–16712. [PubMed] [Google Scholar]
- 7.Balzi E, Choder M, Chen W, Varshavsky A, Goffeau A. J Biol Chem. 1990;265:7464–7471. [PubMed] [Google Scholar]
- 8.Kwon Y, Kashina A, Varshavsky A. Mol Cell Biol. 1999;19:182–193. doi: 10.1128/mcb.19.1.182. [DOI] [PMC free article] [PubMed] [Google Scholar]
- 9.Decca MB, Bosc C, Luche S, Brugière S, Job D, Rabilloud T, Garin J, Hallak ME. Neurochem Res. 2006;31:401–409. doi: 10.1007/s11064-005-9037-z. [DOI] [PubMed] [Google Scholar]
- 10.Michalak M, Corbett EF, Mesaeli N, Nakamura K, Opas M. Biochem J. 1999;344:281–92. [PMC free article] [PubMed] [Google Scholar]
- 11.Corbett EF, Michalak M. Trends Biochem Sci. 2000;25:307–311. doi: 10.1016/s0968-0004(00)01588-7. [DOI] [PubMed] [Google Scholar]
- 12.Liu N, Fine RE, Simons E, Johnson RJ. J Biol Chem. 1994;269:28635–28639. [PubMed] [Google Scholar]
- 13.Bastianutto C, Clementi E, Codazzi F, Podini P, De Giorgi F, Rizzuto R, Meldolesi J, Pozzan T. J Cell Biol. 1995;130:847–855. doi: 10.1083/jcb.130.4.847. [DOI] [PMC free article] [PubMed] [Google Scholar]
- 14.Denning G, Leidal KG, Holst V, Iyer S, Pearson D, Clark J, Nauseef W, Clark RA. Blood. 1997;90:372–381. [PubMed] [Google Scholar]
- 15.Fliegel L, Burns K, MacLennan DH, Reithmeier RA, Michalak M. J Biol Chem. 1989;264:21522–21528. [PubMed] [Google Scholar]
- 16.Pelham HL. Annual Rev Cell Biol. 1989;5:1–23. doi: 10.1146/annurev.cb.05.110189.000245. [DOI] [PubMed] [Google Scholar]
- 17.Holaska JM, Black BE, Love DC, Hanover JA, Leszyk J, Paschal BM. J Cell Biol. 2001;152:127–140. doi: 10.1083/jcb.152.1.127. [DOI] [PMC free article] [PubMed] [Google Scholar]
- 18.Orr AW, Elzie CA, Kucik DF, Murphy-Ullrich JE. J Cell Sci. 2003;116:2917–2927. doi: 10.1242/jcs.00600. [DOI] [PubMed] [Google Scholar]
- 19.Coppolino M, Woodside M, Demaurex N, Grinstein S, St-Arnaud R, Dedhar S. Nature. 1997;386:843–847. doi: 10.1038/386843a0. [DOI] [PubMed] [Google Scholar]
- 20.Kwon MS, Park CS, Choi K, Ahnn J, Kim JI, Eom SH, Kaufman SJ, Song WK. Mol Biol Cell. 2000;11:1433–1443. doi: 10.1091/mbc.11.4.1433. [DOI] [PMC free article] [PubMed] [Google Scholar]
- 21.Afshar N, Black B, Paschal B. Mol Cell Biol. 2005;25:8844–8853. doi: 10.1128/MCB.25.20.8844-8853.2005. [DOI] [PMC free article] [PubMed] [Google Scholar]
- 22.Shaffer KL, Sharma A, Snapp EL, Hegde RS. Dev Cell. 2005;4:545–554. doi: 10.1016/j.devcel.2005.09.001. [DOI] [PubMed] [Google Scholar]
- 23.Hallak ME, Bongiovanni G, Barra HS. J Neurochem. 1991;57:1735–1739. doi: 10.1111/j.1471-4159.1991.tb06375.x. [DOI] [PubMed] [Google Scholar]
- 24.Laemmli UK. Nature. 1970;227:680–685. doi: 10.1038/227680a0. [DOI] [PubMed] [Google Scholar]
- 25.Towbin H, Staehelin T, Gordon J. Proc Natl Acad Sci USA. 1979;76:3344–3352. doi: 10.1073/pnas.76.9.4350. [DOI] [PMC free article] [PubMed] [Google Scholar]
- 26.Li Z, Stafford WF, Bouvier M. Biochem. 2001;40:11193–11201. doi: 10.1021/bi010948l. [DOI] [PubMed] [Google Scholar]
- 27.Corbett EF, Michalak KM, Oikawa K, Johnson S, Campbell I, Eggleton P, Kay C, Michalak M. J Biol Chem. 2000;275:27177–27185. doi: 10.1074/jbc.M002049200. [DOI] [PubMed] [Google Scholar]
- 28.Treiman M, Kaspersen C, Christensen S. Trends Pharmacol Sci. 1998;19:131–135. doi: 10.1016/s0165-6147(98)01184-5. [DOI] [PubMed] [Google Scholar]
- 29.Holaska JM, Black BE, Rastinejad F, Paschal BM. Mol Cell Biol. 2002;22:6286–6297. doi: 10.1128/MCB.22.17.6286-6297.2002. [DOI] [PMC free article] [PubMed] [Google Scholar]
- 30.Caspersen C, Sten Pedersen P, Treiman M. J Biol Chem. 2000;275 (29):22363–22372. doi: 10.1074/jbc.M001569200. [DOI] [PubMed] [Google Scholar]
- 31.Waser M, Mesaeli N, Spencer C, Michalak M. J Cell Biol. 1997;138:547–557. doi: 10.1083/jcb.138.3.547. [DOI] [PMC free article] [PubMed] [Google Scholar]
- 32.Kedersha NL, Stoecklin G, Ayodele M, Yacono P, Lykke-Andersen J, Fritzler MJ, Scheuner D, Kaufman R, Golan D, Anderson P. J Cell Biol. 2005;169:871–884. doi: 10.1083/jcb.200502088. [DOI] [PMC free article] [PubMed] [Google Scholar]
- 33.Bohley P, Kopitz J, Adam G, Rist B, von Appen F, Urban S. Biomed Biochim Acta. 1991;50:343–346. [PubMed] [Google Scholar]
- 34.Murakami Y, Matsufuji S, Kameji T, Hayashi S, Igarashi K, Tamura T, Tanaka K, Ichihara A. Nature. 1992;360:597–599. doi: 10.1038/360597a0. [DOI] [PubMed] [Google Scholar]
- 35.Lee MJ, Tasaki T, Moroi K, An JY, Kimura S, Davydov IV, Kwon YT. Proc Natl Acad Sci U S A. 2005;102:15030–15035. doi: 10.1073/pnas.0507533102. [DOI] [PMC free article] [PubMed] [Google Scholar]
- 36.Hamilton MH, Cook LA, McRackan TR, Schey KL, Hildebrandt JD. Proc Natl Acad Sci USA. 2003;100:5081–5086. doi: 10.1073/pnas.0831228100. [DOI] [PMC free article] [PubMed] [Google Scholar]
- 37.Karakozova M, Kozak M, Wong CC, Bailey AO, Yates JR, 3rd, Mogilner A, Zebroski H, Kashina A. Science. 2006;313:192–196. doi: 10.1126/science.1129344. [DOI] [PubMed] [Google Scholar]
- 38.Ron D, Harding HP. Translational Control of Gene Expression. Cold Spring Harbor Laboratory; Cold Spring Harbor, NY: 2000. pp. 547–560. [Google Scholar]
- 39.Dunand-Sauthier I, Walker C, Wildkinson C, Gordon C, Crane R, Norbury C, Humphrey T. Mol Biol Cell. 2002;13:1626–1640. doi: 10.1091/mbc.01-06-0301. [DOI] [PMC free article] [PubMed] [Google Scholar]
- 40.Kedersha NL, Cho MR, Li W, Yacono PW, Chen S, Gilks N, Golan DE, Anderson P. J Cell Biol. 2000;151:1257–1268. doi: 10.1083/jcb.151.6.1257. [DOI] [PMC free article] [PubMed] [Google Scholar]
- 41.Nover L, Scharf K, Neumann D. Mol Cell Biol. 1983;9:1298–1308. doi: 10.1128/mcb.9.3.1298. [DOI] [PMC free article] [PubMed] [Google Scholar]
- 42.Gallouzi IE, Brennan CM, Stenberg MG, Swanson MS, Eversole A, Maizels N, Steitz JA. Proc Natl Acad Sci USA. 2000;97:3073–3078. doi: 10.1073/pnas.97.7.3073. [DOI] [PMC free article] [PubMed] [Google Scholar]
- 43.Anderson P, Kedersha N. J Cell Sci. 2002;115:3227–3234. doi: 10.1242/jcs.115.16.3227. [DOI] [PubMed] [Google Scholar]
- 44.Atreya C, Singh N, Nakhasi H. J Virol. 1995;6:3848–3851. doi: 10.1128/jvi.69.6.3848-3851.1995. [DOI] [PMC free article] [PubMed] [Google Scholar]
- 45.Chen M, Frey T. J Virol. 1999;73:3386–3408. doi: 10.1128/jvi.73.4.3386-3403.1999. [DOI] [PMC free article] [PubMed] [Google Scholar]
- 46.Cheng S, Nguyen T, Yang Y, Capra J, Sonheimer R. J Immunol. 1996;156:4484–4491. [PubMed] [Google Scholar]
- 47.Pugachev K, Frey T. J Virol. 1998;72:641–650. doi: 10.1128/jvi.72.1.641-650.1998. [DOI] [PMC free article] [PubMed] [Google Scholar]
- 48.Singh NK, Atreya C, Nakashi HL. Proc Natl Acad Sci USA. 1994;91:12770–12774. doi: 10.1073/pnas.91.26.12770. [DOI] [PMC free article] [PubMed] [Google Scholar]