

Abstract
Glycerol kinase (GK) is at the interface of fat and carbohydrate metabolism and has been linked to obesity and type 2 diabetes mellitus (T2DM). The purpose of this study was to investigate the role of GK in fat metabolism and insulin signaling in skeletal muscle (an important end organ tissue in T2DM). Microarray analysis determined that there were 525 genes that were differentially expressed (1.2 fold, p-value <0.05) between knockout (KO) and wild-type (WT) mice. Quantitative PCR (qPCR) confirmed the differential expression of genes including glycerol kinase (Gyk), phosphatidylinositol 3-kinase regulatory subunit, polypeptide 1 (p85 alpha) (Pik3r1), insulin-like growth factor 1 (Igf1), and growth factor receptor bound protein 2-associated protein 1 (Gab1). Network component analysis demonstrated that transcription factor activities of myogenic differentiation 1 (MYOD), myogenic regulatory factor 5 (MYF5), myogenin (MYOG), nuclear receptor subfamily 4, group A, member 1 (NUR77) are decreased in the Gyk KO whereas the activity of paired box 3 (PAX3) is increased. The activity of MYOD was confirmed using a DNA binding assay. In addition, myoblasts from Gyk KO had less ability to differentiate into myotubes compared to WT myoblasts. These findings support our previous studies in brown adipose tissue and demonstrate that the role of Gyk in muscle is due in part to its non-metabolic (moonlighting) activities.
Keywords: glycerol kinase, gene expression, skeletal muscle, network component analysis, moonlighting function
Introduction
Glycerol kinase (GK) (EC 2.7.1.30) catalyzes the phosphorylation of glycerol to glycerol 3-phosphate (G3P) and is at the interface of fat and carbohydrate metabolism [1]. G3P is important in the formation of triacylglycerol, which is the foundation for fat storage (Figure 1). When triacylglycerol is hydrolyzed to form glycerol and fatty acids, glycerol is transported to the liver where it is converted by GK to G3P, an important precursor for lipid synthesis and gluconeogenesis. GK is predominantly found in liver and kidney, but also has been found in brain, adipocytes, testis, and cardiac and skeletal muscle [1].
Figure 1.
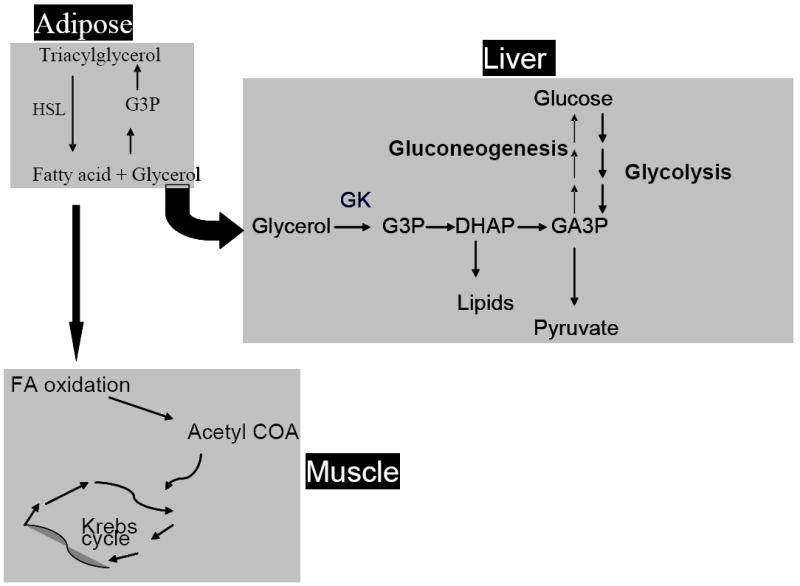
Glycerol kinase at the interface of carbohydrate and lipid metabolism. GK converts glycerol to G3P which then can be used downstream in gluconeogenesis and lipid synthesis.
Glycerol kinase deficiency (GKD) is an X-linked inborn error of metabolism that is characterized biochemically by hyperglycerolemia and glyceroluria and is due to mutations within or deletions of the GK gene Xp21 [1]. GKD can be part of a contiguous gene syndrome (the complex form) involving other genes in this area [nuclear receptor subfamily 0, group B, member 1 (NROB1), and Duchenne muscular dystrophy (DMD)] or due to mutations or deletions within the GK gene (isolated GKD). The isolated form of GKD (iGKD) can be symptomatic (juvenile form) or asymptomatic (benign adult form) [1-3]. We and others have previously shown that there is a lack of genotype-phenotype correlation in iGKD [2-4]. This includes identical DNA mutations with different phenotypes within a family [2, 3] and similar GK enzymatic activity in both symptomatic and asymptomatic individuals with iGKD [4]. This suggests that other environmental and biological factors (such as metabolic flux through related pathways or the role of modifier genes) are important in the phenotype of GKD [5]. Another possibility for this complexity is that the phenotype relates to the other nonenzymatic (moonlighting) functions of the GK protein [6, 7].
Most metabolic enzymes exhibit moonlighting functions; seven out of the ten glycolytic enzymes and seven out of the eight enzymes in the TCA cycle exhibit moonlighting functions [6]. In addition to its enzymatic role, glycerol kinase is also the ATP stimulated translocation protein (ASTP) which enhances the nuclear binding of the glucocorticoid – receptor complex [8, 9]. GK also has a role in apoptosis [10], and binds to histones and interacts with the voltage dependent anion channel in the outer mitochondrial membrane [11, 12].
There is an emerging role of GK in type 2 diabetes mellitus (T2DM). Patients with a GK missense mutation, N288D, have the asymptomatic form of GKD, increased risk for obesity, insulin resistance, and T2DM [13]. Thiazolidinediones (TZDs) are effective drugs in the treatment of type 2 diabetes [14] and have been shown to induce GK expression in adipocytes [15, 16]. We have previously shown altered gene expression in liver and brown adipose tissue of the mouse ortholog of GK, Gyk, KO mice of genes involved in lipid and carbohydrate metabolism, insulin signaling and T2DM [17, 18]. Skeletal muscle is another important end organ for insulin resistance and it has been shown that GK is functional in muscle cells and contributes to intramuscular triglyceride (TG) synthesis [19, 20].
Satellite cells are found in skeletal muscle tissue and can differentiate into myotubes to replace damaged myofibers [21]. In the past decade, many studies have used primary myoblast cultures derived from satellite cells to study muscle development [22-26]. The myogenic regulatory factors (MRFs) which are basic helix-loop-helix (bHLH) transcription factors and include MYOD, MYF5, MRF4, and myogenin (MYOG) are crucial for the determination and differentiation of skeletal muscle (for reviews, see [27, 28]). The Myod1 and Myf5 genes are expressed early in muscle cell differentiation and are required for commitment to differentiation, whereas Myog is expressed later in differentiated myotubes. MRFs and other transcription factors, such as the MEF2 family and the paired box family, control gene expression in a distinct pattern that leads to myotube formation. In this study, we tested the hypotheses that the role of GK in skeletal muscle includes its role in central carbon metabolism as well as its moonlighting activities, which include a new function in skeletal muscle differentiation.
Materials and Methods
Animal care
Animal Care: Gyk deficient mice were courtesy of W.J. Craigen (Baylor College of Medicine) [29]. The heterozygous female strain (129SvJ-C57BL/6J) was bred with WT males from the same breeding colony. The mice were kept on a normal diet (Harlan Tekland) and all procedures and experiments were per a protocol approved by the UCLA Chancellor’s Animal Research Committee.
Gene expression analysis
Day of life one (dol 1) WT and Gyk KO mice were sacrificed and skeletal muscle from hind limb was extracted. RNA isolation, microarray analysis, and quantitative PCR (qPCR) was carried out as described previously [17]. The microarray data was analyzed using the DNA-Chip analyzer (dChip) software package [30]. Differentially expressed genes were filtered with absolute fold change > 1.2 between WT and KO, absolute difference in the expression level between WT and KO > 100, student t-test p value < 0.05, and percent present call of ≥ 20%. COMBAT, an empirical Bayes method was used to adjust for batch effects [31].
Network component analysis (NCA)
NCA was carried out as previously described [17, 32, 33]. Connectivity matrices between transcription factors (TFs) important in skeletal muscle tissue and genes differentially expressed in the microarray analysis was manually constructed using PUBMED. Five TFs [myogenic differentiation 1 (MYOD), myogenic regulatory factor 5 (MYF5), myogenin (MYOG), nuclear receptor subfamily 4, group A, member 1 (NUR77), and paired box 3 (PAX3)] were used to construct the final connectivity matrix. The data matrices were decomposed and the control strengths (CS), and transcription factor activity (TFA) matrices were obtained using the NCA toolbox (http://www.seas.ucla.edu/~liaoj/downloads/htm).
Primary myocytes
Muscle tissue was isolated from hind limb of day of life three (dol 3) mice and myoblasts were cultured in DMEM/F10 media containing fetal calf serum, basic fibroblast growth factor, and penicillin/streptomycin as described [34]. 500,000 cells were seeded and after three days, the cells were counted and 200,000 cells were seeded in fusion media (DMEM, horse serum, and penicillin/streptomycin) in duplicate. Day 0 is defined as the day fusion media was added. Cells were counted again on day 5 and fusion index analysis was performed.
Fusion indices analysis
Fusion indices were measured on day 3, 4, and 5 as described previously [22]. Ten random fields were chosen per plate, photographed, and counted manually. The fusion index was calculated as the ratio of the number of nuclei in myotubes to the total number of nuclei [22]. Myotubes were defined as cells containing three or more nuclei.
MYOD activity
Skeletal muscle was isolated from dol 3 Gyk KO and WT mice and nuclear extracts were prepared using a nuclear extraction kit (Active Motif, Carlsbad, CA) per manufacturer’s instructions. MYOD activity was measured using the TransAM DNA binding assay for MYOD (Active Motif) as instructed by the manufacturer.
Results
Gene expression is altered in skeletal muscle of the Gyk KO mice
Hierarchical clustering of microarray analysis using the 4419 most varying probesets revealed that the Gyk KO samples and WT samples cluster separately (Figure 2). This unsupervised learning analysis demonstrates that Gyk KO mice have a distinct global gene expression profile in muscle compared to WT mice. Differential gene expression analysis (gene filtering) revealed 546 probesets (representing 525 genes) significantly differentially expressed between KO and WT mice. Of the 546 probesets, 323 genes were down-regulated and 223 were up-regulated.
Figure 2.
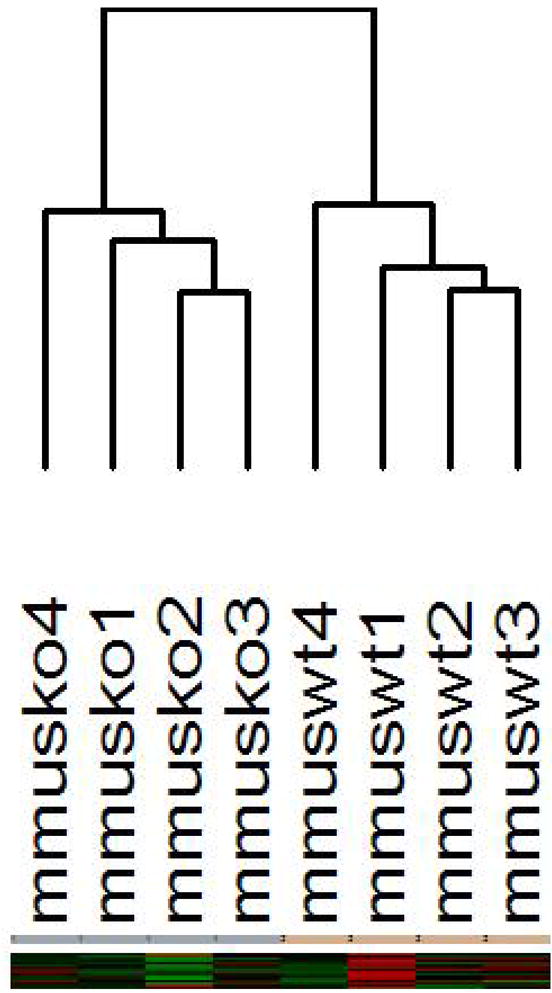
Unsupervised learning analysis of Gyk KO and WT mice samples using the 4,419 most varying genes. Average linkage hierarchical clustering tree of Gyk KO and WT samples. mmusko represents skeletal muscle from Gyk KO mice and mmuswt represents skeletal muscle from male WT mice.
Enriched biological themes in the differentially expressed genes were determined using the gene ontology analysis Expression Analysis Systematic Explorer (EASE) [35] (Table 1). Significantly (p value < 0.05) enriched biological processes and molecular functions include: ion homeostasis, cell matrix adhesion, IGF receptor signaling pathway, regulation of cell growth, lipid biosynthesis, regulation of glucose import, glucose import, protein binding, insulin-like growth factor binding, growth factor binding, nucleic acid binding, and lipoprotein kinase activity.
Table 1.
EASE analysis grouping of biological processes and molecular functions using the filtered 525 genes (546 probesets).
| Gene Category | List Hits | List Total | Population Hits | Population Total | Probability | |
|---|---|---|---|---|---|---|
| GO Biological Process | ion homeostasis | 9 | 348 | 64 | 10437 | 0 |
| cell-matrix adhesion | 7 | 348 | 57 | 10437 | 0.003 | |
| IGF receptor signaling pathway | 2 | 348 | 4 | 10437 | 0.006 | |
| regulation of cell growth | 6 | 348 | 56 | 10437 | 0.01 | |
| lipid biosynthesis | 10 | 348 | 153 | 10437 | 0.032 | |
| regulation of glucose import | 1 | 348 | 1 | 10437 | 0.033 | |
| glucose import | 1 | 348 | 1 | 10437 | 0.033 | |
| GO Molecular Function | protein binding | 103 | 358 | 1762 | 10943 | 0 |
| insulin-like growth factor binding | 4 | 358 | 17 | 10943 | 0.002 | |
| growth factor binding | 5 | 358 | 29 | 10943 | 0.002 | |
| nucleic acid binding | 96 | 358 | 2282 | 10943 | 0.004 | |
| lipoprotein lipase activity | 1 | 358 | 1 | 10943 | 0.033 |
Twenty genes (including Gyk) involved in lipid metabolism (Table 2A) were differentially expressed in the Gyk KO mice compared to the WT (fold change >1.2). Twelve of those genes were down-regulated including: adipocyte complement related protein (Acrp30), Gyk, protein kinase AMP-activated beta 2 non-catalytic subunit (Prkab2), glycerol-3-phosphate dehydrogenase 1 (Gpd1), lipoprotein lipase (Lpl), glyceronephosphate O-acyltransferase (Gnpat), testis expressed gene 261 (Tex261), monoglyceride lipase (Mgll), phosphate cytidyltransferase 1 choline alpha isoform (Pcyt1a), adiponectin receptor 1 (Adipor1), and RIKEN c DNA 4930570C03 gene (Table 2A). Eight genes were up-regulated including: 3-hydroxy-3-methylglutaryl-Coenzyme A synthase 1 (Hmgcs1), cardiolipin synthase1 (Crls1), NADH dehydrogenase (ubiquinone) 1 alpha/beta subcomplex (Ndufab1), fatty acid-Coenzyme A ligase log chain 4 (Facl4), cytochrome P450, 51 (Cyp51), phospholipase D1 (Pld1), sterol O-actyltransferase 1 (Soat1), and SA rat hypertension-associated homolog (Sah) (Table 2A). In addition, ten genes (including Gyk) involved in carbohydrate metabolism were differentially expressed in the Gyk KO mice compared to the WT (Table 2B). Eight of these were down-regulated including Gyk, hexokinase 1 (Hk1), glycogen synthase 3 (Gys3), carbohydrate sulfotransferase 14 (Chst14), Gpd1, sulfatase 2 (Sulf2), glucosamine-6-sulfatase (Gns), and aconitase 1 (Aco1). Two genes involved in carbohydrate metabolism, activating transcription factor 4 (Atf4), and glycosyltransferase 8 domain containing 1 (Glt8d1), were up-regulated (Table 2B). A total of ten genes that relate to insulin signaling, insulin resistance or diabetes were differentially expressed in muscle between Gyk KO and WT mice (Table 3). Of these, eight genes were down-regulated including: insulin-like growth factor binding protein 5 (Igfbp5), growth factor receptor bound protein 2-associated protein 1 (Gab1), glycogen synthase 1, muscle (Gys1), insulin-like growth factor 1 (Igf1), growth factor receptor bound protein 10 (Grb10), protein tyrosine phosphatase, receptor type, F (Lar), Gpd1, eukaryotic translation initiation factor 2B, subunit 1 alpha (Eif2b1). Pleckstrin homology domain interacting protein (Phip), and phosphatidylinositol 3-kinase, regulatory subunit, polypeptide 1, p85 alpha (Pik3r1) were up-regulated (Table 3).
Table 2.
| A: List of differentially expressed genes involved in lipid metabolism altered in the KO male vs. the WT male mice. * Student t test p value < 0.05. | |||||
|---|---|---|---|---|---|
| LocusLink Numbers | Gene Name | Gene Symbol | Fold Change | Lowerbound | Upperbound |
| 11450 | adipocyte complement related protein | Acrp30 | -3.41 | -1.93 | -6.9 |
| 14933 | glycerol kinase | Gyk | -3.09 | -2.46 | -3.98 |
| 108097 | protein kinase, AMP-activated, beta 2 non-catalytic subunit | Prkab2 | -1.54 | -1.31 | -1.79 |
| 14555 | glycerol-3-phosphate dehydrogenase 1 (soluble) | Gpd1 | -1.5 | -1.17 | -1.92 |
| 16956 | lipoprotein lipase | Lpl | -1.44 | -1.25 | -1.69 |
| 14712 | glyceronephosphate O-acyltransferase | Gnpat | -1.33 | -1.2 | -1.48 |
| 21766 | testis expressed gene 261 | Tex261 | -1.33 | -1.26 | -1.4 |
| 23945 | monoglyceride lipase | Mgll | -1.31 | -1.15 | -1.5 |
| 68832 | RIKEN cDNA 1110057K04 gene | 1110057K04Rik | -1.31 | -1.25 | -1.38 |
| 13026 | phosphate cytidylyltransferase 1, choline, alpha isoform | Pcyt1a | -1.26 | -1.15 | -1.39 |
| 72674 | adiponectin receptor 1 | Adipor1 | -1.23 | -1.12 | -1.35 |
| 67739 | RIKEN cDNA 4930570C03 gene | 4930570C03Rik | -1.23 | -1.15 | -1.315 |
| 208715 | 3-hydroxy-3-methylglutaryl-Coenzyme A synthase 1 | Hmgcs1 | 1.22 | 1.11 | 1.34 |
| 66586 | cardiolipin synthase 1 | Crls1 | 1.22 | 1.12 | 1.33 |
| 70316 | NADH dehydrogenase (ubiquinone) 1, alpha/beta subcomplex, 1 | Ndufab1 | 1.24 | 1.15 | 1.35 |
| 50790 | fatty acid-Coenzyme A ligase, long chain 4 | Facl4 | 1.26 | 1.14 | 1.38 |
| 13121 | cytochrome P450, 51 | Cyp51 | 1.31 | 1.14 | 1.52 |
| 18805 | phospholipase D1 | Pld1 | 1.32 | 1.18 | 1.46 |
| 20652 | sterol O-acyltransferase 1 | Soat1 | 1.5 | 1.35 | 1.67 |
| 20216 | SA rat hypertension-associated homolog | Sah | 1.61 | 1.36 | 1.88 |
| B: List of differentially expressed genes involved in carbohydrate metabolism altered in the KO male vs. the WT male mice. * Student t test p value < 0.05. | |||||
| LocusLink numbers | Gene Name | Gene Symbol | Fold Change | Lower bound | upper bound |
| 14933 | glycerol kinase | Gyk | -3.09 | -2.46 | -3.98 |
| 15275 | hexokinase 1 | Hk1 | -1.74 | -1.38 | -2.17 |
| 14937 | glycogen synthase 3, brain | Gys3 | -1.68 | -1.51 | -1.87 |
| 72136 | carbohydrate (N-acetylgalactosamine 4-0) sulfotransferase 14 | Chst14 | -1.53 | -1.36 | -1.7 |
| 14555 | glycerol-3-phosphate dehydrogenase 1 (soluble) | Gpd1 | -1.5 | -1.17 | -1.92 |
| 72043 | sulfatase 2 | Sulf2 | -1.31 | -1.24 | -1.39 |
| 75612 | glucosamine (N-acetyl)-6-sulfatase | Gns | -1.25 | -1.16 | -1.35 |
| 11428 | aconitase 1 | Aco1 | -1.24 | -1.13 | -1.35 |
| 11911 | activating transcription factor 4 | Atf4 | 1.46 | 1.21 | 1.72 |
| 76485 | glycosyltransferase 8 domain containing 1 | Glt8d1 | 1.51 | 1.3 | 1.75 |
Table 3.
Genes involved in insulin signaling and insulin resistance differentially expressed in the Gyk KO male compared to WT male mice. Student t test p value < 0.05
| Gene | Symbol | Fold Change |
|---|---|---|
| insulin-like growth factor binding protein 5 | Igfbp5 | -2.22 |
| growth factor receptor bound protein 2-associated protein 1 | Gab1 | -1.97 |
| glycogen synthase 1, muscle | Gys1 | -1.68 |
| insulin-like growth factor 1 | Igf1 | -1.58 |
| growth factor receptor bound protein 10 | GRb10 | -1.54 |
| protein tyrosine phosphatase, receptor type, F | Lar | -1.51 |
| glycerol-3-phosphate dehydrogenase 1 (soluble) | Gpd1 | -1.5 |
| eukaryotic translation initiation factor 2B, subunit 1 (alpha) | Eif2b1 | -1.24 |
| pleckstrin homology domain interacting protein | Phip | 1.27 |
| phosphatidylinositol 3-kinase, regulatory subunit, polypeptide 1 (p85 alpha) | Pik3r1 | 1.37 |
In order to confirm the microarray data, we chose to analyze the following genes using qPCR analysis; Gyk was chosen to confirm our KO status, Myod1 was chosen to confirm the myocyte differentiation role that GK has, and the other four genes (Gab1, Igf1, Pik3r1, and Eif2b1) are involved in insulin signaling. qPCR confirmed the differential expression of five out of six genes (Figure 3 and Table 4). The down-regulation of Gyk (5.5 fold), growth factor receptor bound protein Gab1 (2.0 fold), insulin-like growth factor 1 (Igf1) (1.1 fold), and Myod1 (3.87 fold), and the up-regulation of Pik3r1 (1.8 fold) were confirmed. qPCR data for (Eif2b1) did not correlate with microarray data (data not shown). Fold differences for each of the genes were calculated using the ΔΔCT method [36].
Figure 3.

qPCR data (mean ± SEM) expressed as relative mRNA levels of Gyk KO compared to WT mice. Phosphatidylinositol 3-kinase, regulatory subunit, polypeptide 1 (Pik3r1), glycerol kinase (Gyk), growth factor receptor bound protein 2-associated protein 1 (Gab1), insulin-like growth factor 1 (Igf1), myogenic differentiation factor 1 (Myod1) *p< 0.05, student t test. White bars represent Gyk KO mice and black bars represent WT mice.
Table 4.
qPCR and Microarray expression data
| Gene | RT- PCR | Microarray |
|---|---|---|
| Pik3r1 | 1.78001 | 1.37 |
| Gyk | 5.469096 | -3.09 |
| Gab1 | -2.045313 | -1.97 |
| Igf1 | -1.145992 | -1.58 |
| Myod1 | -3.872351 | -1.33 |
To further understand the metabolic role of GK in muscle, metabolic flux analysis was performed on primary myocytes from Gyk KO and WT cells. Isotopomer abundances and external fluxes of Gyk KO and WT cells were not statistically significant (Supplemental Material 1). In addition, selected internal fluxes were not statistically significant between Gyk KO and WT cells.
NCA revealed altered TF activity in skeletal muscle of the Gyk KO mice
To examine the role of Gyk in muscle cell gene expression, NCA of the microarray data was performed to identify TFAs of TFs important in skeletal muscle in the absence of Gyk. Forty-six genes and five TFs resulted from the analysis. The transcription factor activities of myogenic differentiation 1 (MYOD), myogenic regulatory factor 5 (MYF5), myogenin (MYOG), nuclear receptor subfamily 4, group A, member 1 (NUR77) were decreased in the Gyk KO; whereas the activity of paired box 3 (PAX3) is increased (Figure 4). The expression, connectivity, and CS matrices, and references used to deduce TFA and control strengths (CS) are provided as supplemental material 2.
Figure 4.
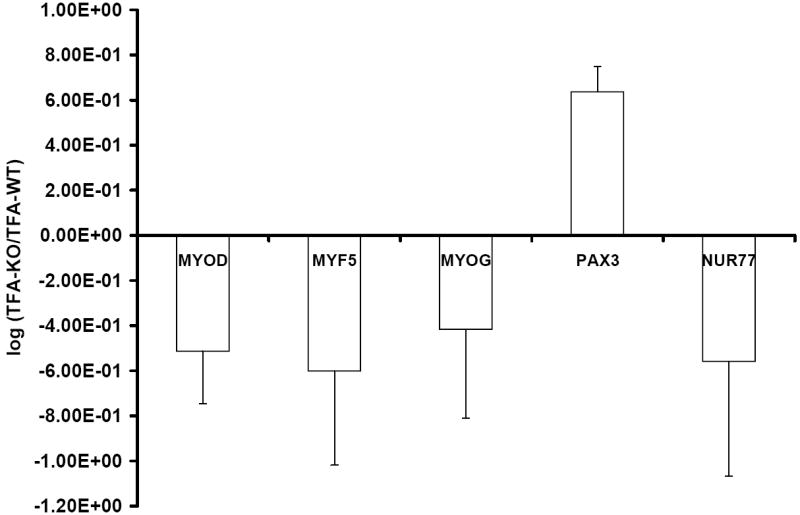
Network component analysis: Transcription factor activities of selected TFs important in muscle tissue. The transcriptional network contains 5 TF and 46 genes found in the muscle resulting from microarray analysis at ≥1.2 absolute fold change. Myogenic differentiation 1 (MYOD), myogenic regulatory factor 5 (MYF5), myogenin (MYOG), paired box 3 (PAX3), nuclear receptor subfamily 4, group A, member 1 (NUR77).
Gyk KO cells have a significantly lower fusion index and MYOD activity
NCA analysis revealed that GK affects transcription factors important in muscle differentiation, therefore, we examined the role of GK in the differentiation of the myoblast cells into myotubes. Fusion indices were calculated for primary myoblasts after induction to fuse into mature myotubes as described in Materials and Methods. Gyk KO cells had a fusion index significantly lower (0.75) than the WT cells (0.82) (p value <0.05) (Figures 5A and B). Consistent with this, MYOD activity in the skeletal muscle of Gyk KO mice is significantly decreased (p < 0.05) compared to that of WT (Figure 6).
Figure 5.
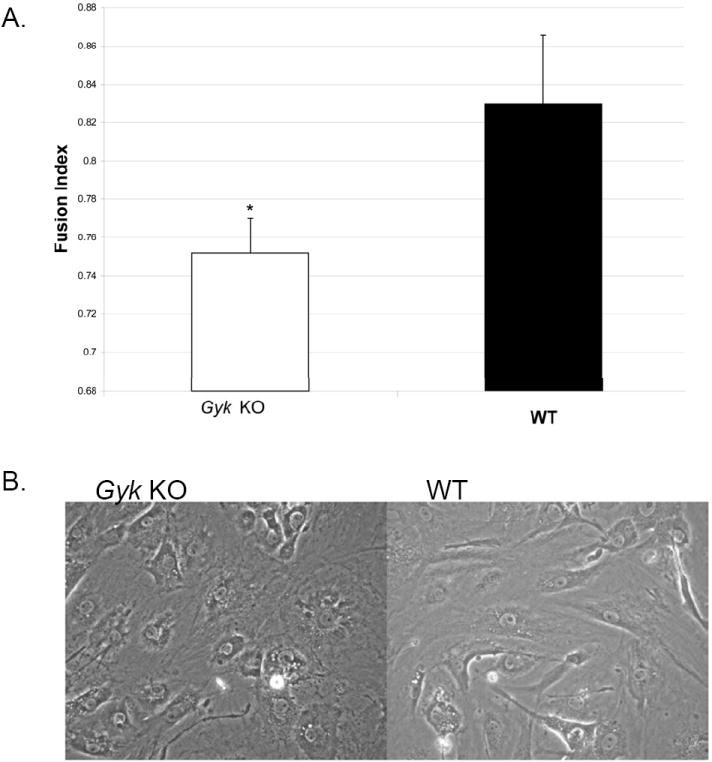
Myotube fusion index of Gyk KO and WT primary muscle cells: A. fusion index measured as the ratio of the number of nuclei in myotubes (3 or more nuclei) to the total number of nuclei counted of day 6 after the addition of fusion media as described in Materials and Methods. *p value <0.05, student t test. Black bar represents WT muscle cells and white bar represents Gyk KO muscle cells. B. Photograph of WT and Gyk KO muscle cells on day 5 after supplemented with fusion media.
Figure 6.
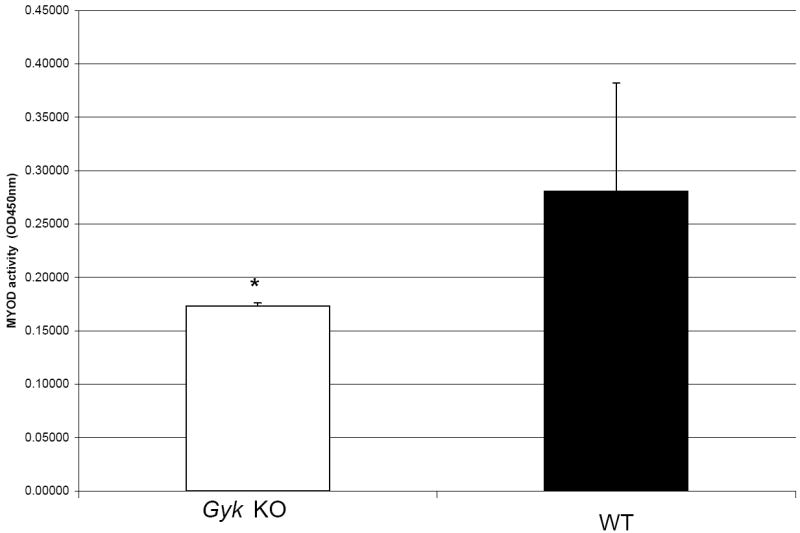
MYOD activity in skeletal muscle. MYOD activity in the nuclear extracts of skeletal muscle from hind limb of dol 3 Gyk KO (n=3) and WT (n=10) mice was measured as described in Materials and Methods. Black bar represents the WT animals and the white bar represents the Gyk KO mice. *p value <0.05, student t test.
Discussion
In this study, we demonstrate that skeletal muscle from Gyk KO mice have a distinct global gene expression pattern compared to WT. Many enriched biological groups were significantly altered including metabolism (lipid biosynthesis, glucose import, and regulation of glucose transport) and other cellular functions (ion homeostasis and cell matrix adhesion). This confirms the known metabolic role of GK and suggests that GK has other non-enzymatic (moonlighting) functions in muscle cells as it does in the liver [9].
Specifially using microarray and qPCR, we determined that Gpd1 is down-regulated. This encodes GPD1, the enzyme adjacent to GK in the enzymatic pathway (Figure 1) which is expected to be down regulated in the absence of GK. Adiponectin is down-regulated, involved in metabolism (glucose and lipid), and is altered in obese and diabetic mice and humans [37-39]. Adiponectin has insulin sensitizing activity by reducing TG content, increasing fatty acid oxidation by inducing PPARα transcriptional activity, and up-regulating insulin signaling in liver and skeletal muscle [37, 40]. Adipor1, encodes an adiponectin receptor and is down-regulated which is in contrast to our previous study in brown fat tissue of Gyk KO mice [17]. This is expected as adiponectin is secreted by adipose tissue and its role in insulin sensitization has only been reported in liver and skeletal muscle. Perhaps the Gyk KO mouse is trying to make up for the decrease of adiponectin in muscle cells by releasing more from fat. In addition, Adipor1 is regulated negatively by insulin and is down-regulated in obese mice [41, 42].
Further evaluation of genes involved in the insulin signaling pathway and insulin resistance, revealed that five docking proteins (Gab1, Grb10, Lar, Phip, and Pik3r1) are differentially expressed. Gab1 is decreased in the Gyk KO mice and it encodes a docking protein that is phosphorylated by the insulin receptor (IR) and associates with PI3-K and protein tyrosine phosphatase, non-receptor type 11 (SHP-2) in the insulin signaling pathway [43], which suggest a decrease in insulin signaling in the Gyk KO mice. Grb10 is associated with the insulin receptor and is a negative regulator of insulin signaling [44]. Deletions of Grb10 in mice improve insulin sensitivity and glucose tolerance [44, 45]. The decreased Lar expression in the Gyk KO mice is intriguing because muscle specific transgenic over-expression of Lar causes insulin resistance [46]. Both the decrease in expression of Grb10 and Lar point to insulin sensitivity, which is contrary to our hypothesis that Gyk deletions cause insulin resistance; perhaps the down regulation of these genes is a mechanism to improve insulin sensitivity in the Gyk KO mice or the insulin resistance is limited to fat and liver.
The lack of significant difference in metabolic flux analysis may be due to limitations of the methods used. First, proteinogenic amino acids are used as a surrogate for isotopomeric compositions of central carbon metabolites because amino acids are more abundant. This involves the assumption that cell metabolism is homogenous and that cells producing large amounts of protein reflect the metabolism of the entire cell population [47]. The metabolic flux presented was performed on differentiated primary cells, which may be a heterogeneous cell population making this assumption less valid which is supported by the variation in the data. Second, any true differences in metabolic flux may have been masked by the large isotopomer concentration standard deviation [9]. A third possibility is that there is no true difference in central carbon metabolism fluxes in the myoctes. In which case, studies investigating the flux in other metabolic networks, such as lipid metabolism may be needed to document changes in the metabolic flux.
NCA revealed that the TFA several muscle specific TF were altered (MYOD, MYF5, MYOG, and NUR77). Myod1 gene expression was decreased in the Gyk KO muscle tissue. However, the other TF identified with altered TFA by NCA did not have alterations in gene expression level, highlighting the role of NCA in understanding the biological significance of microarray data [17, 18, 32, 33]. The decreased Myod1 gene expression and TFA suggested that Gyk has a role in regulating transcription in muscle cells. This was validated by the lower fusion index and MYOD activity in the Gyk KO cells. MYOD is an important factor in determining skeletal muscle differentiation [48]. Since glucocorticoids decrease MYOD protein levels through the glucocorticoid receptor (GR) [49], the effect of GK on MYOD may be due in part to the GK ASTP activity. These data suggests that GK has a role in muscle specific transcriptional control and myocyte differentiation.
In this study, we examine the role (metabolic and non metabolic) of GK in skeletal muscle using transcriptomic and network component analysis. We show that Gyk deletion alters the level of expression of genes involved in metabolism and insulin signaling as has been seen in other tissues [17, 18]. In addition, GK affects gene expression in other cellular processes. In particular, we report that GK affects the activity of muscle specific transcription factors and appears to play a role in myotube differentiation. This corroborates our previous findings that GK has nonenzymatic (moonlighting) functions that are important in non metabolic processes and shows that these roles are tissue-specific. Understanding these moonlighting functions and their tissue specificity, will be important to understand the pathogenesis of GKD as well as a model system for understanding the complexity of single gene disorders.
Supplementary Material
List of Abbreviations
- Aco1
aconitase 1
- Acrp30
adipocyte complement related protein
- Adipor1
adiponectin receptor 1
- ASTP
ATP stimulated translocation protein
- Atf4
activating transcription factor 4
- ATP
adenosine-5’-triphosphate
- BHLH
basic helix-loop-helix
- Chst14
carbohydrate sulfotransferase 14
- Crls1
cardiolipin synthase1
- CS
control strength
- Cyp51
cytochrome P450, 51
- dchip
DNA-Chip analyzer
- DHAP
dihydroxyacetone phosphate
- DMD
Duchenne Muscular Dystrophy
- DMEM
Dulbecco’s Modified Eagle Medium
- dol
day of life
- EASE
Expression Analysis Systematic Explorer
- Eif2b1
eukaryotic translation initiation factor 2B, subunit 1 alphal
- Facl4
fatty acid-Coenzyme A ligase log chain 4
- G3P
glycerol 3-phosphate
- Gab1
growth factor receptor bound protein 2-associated protein 1
- GK
glycerol kinase
- GKD
glycerol kinase deficiency
- Glt8d1
glycosyltransferase 8 domain containing 1
- Gnpat
glyceronephosphate O-acyltransferase
- Gns
glucosamine-6-sulfatase
- Gpd1
glycerol-3-phosphate dehydrogenase 1
- Grb10
growth factor receptor bound protein 10
- Gyk
mouse ortholog of glycerol kinase
- Gys1
glycogen synthase 1, muscle
- Gys3
glycogen synthase 3
- Hk
hexokinase 1
- Hmgcs1
3-hydroxy-3-methylglutaryl-Coenzyme A synthase 1
- Igf1
insulin-like growth factor 1
- Igfbp5
insulin-like growth factor binding protein 5
- iGKD
isolated GKD
- KO
knockout
- Lar
protein tyrosine phosphatase, receptor type, F
- Lpl
lipoprotein lipase
- MEF2
myocyte enhancing factor 2
- Mgll
monoglyceride lipase
- MRF
myogenic regulatory factor
- Myf5
gene coding for MYF5
- MYF5
myogenic regulatory factor 5
- Myod
gene coding for MYOD
- MYOD
myogenic differentiation 1
- Myog
gene coding for MYOG
- MYOG
myogenin
- NCA
network component analysis
- Ndufab1
NADH dehydrogenase (ubiquinone) 1 alpha/beta subcomplex
- NROB1
nuclear receptor subfamily 0, group B, member 1
- NUR77
nuclear receptor subfamily 4, group A, member 1
- PAX3
paired box 3
- Pcyt1a
phosphate cytidyltransferase 1 choline alpha isoform
- Phip
Pleckstrin homology domain interacting protein
- Pik3r1
phosphatidylinositol 3-kinase regulatory subunit, polypeptide 1 (p85 alpha)
- Pld1
phospholipase D1
- PPAR
peroxisome proliferator-activated receptor
- Prkab2
protein kinase AMP-activated beta 2 non-catalytic subunit
- qPCR
quantitative PCR
- Sah
SA rat hypertension-associated homolog
- SHP-2
protein tyrosine phosphatase, non-receptor type 11
- Soat1
sterol O-actyltransferase 1
- Sulf2
sulfatase 2
- T2DM
type 2 diabetes mellitus
- TCA
tricarboxylic acid cycle
- Tex261
testis expressed gene 261
- TFA
transcription factor activity
- TFs
transcription factors
- TG
triglyceride
- TZD
thiazolidinediones
- WT
wild-type
Footnotes
Publisher's Disclaimer: This is a PDF file of an unedited manuscript that has been accepted for publication. As a service to our customers we are providing this early version of the manuscript. The manuscript will undergo copyediting, typesetting, and review of the resulting proof before it is published in its final citable form. Please note that during the production process errors may be discovered which could affect the content, and all legal disclaimers that apply to the journal pertain.
References
- 1.McCabe ER. Disorders of glycerol metabolism. In: Scriver CR, B AL, Sly WS, Valle D, Childs B, Vogelstein B, editors. The metabolic and molecular basis of inherited disease. McGraw-Hill; New York: 2001. pp. 2217–2237. [Google Scholar]
- 2.Sargent CA, Kidd A, Moore S, Dean J, Besley GTN, Affara NA. Five cases of isolated glycerol kinase deficiency, including two families: failure to find genotype:phenotype correlation. J Med Genet. 2000;37:434–441. doi: 10.1136/jmg.37.6.434. [DOI] [PMC free article] [PubMed] [Google Scholar]
- 3.D N, Blomquist HK, Gustafsson L, Hellerud C, Holme E, Holmgren G, Matsson L, Von Zweigberkgk M. Glycerol kinase deficiency in two brothers with and without clinical manifestations. Clin Genet. 1996;50:375–379. doi: 10.1111/j.1399-0004.1996.tb02391.x. [DOI] [PubMed] [Google Scholar]
- 4.Dipple KM, Zhang YH, Huang BL, McCabe LL, Dallongeville J, Inokuchi T, Kimura M, Marx HJ, Roederer GO, Shih V, Yamaguchi S, Yoshida I, McCabe ER. Glycerol kinase deficiency: evidence for complexity in a single gene disorder. Hum Genet. 2001;109:55–62. doi: 10.1007/s004390100545. [DOI] [PubMed] [Google Scholar]
- 5.Dipple KM, McCabe ER. Modifier genes convert “simple” Mendelian disorders to complex traits. Mol Genet Metab. 2000;71:43–50. doi: 10.1006/mgme.2000.3052. [DOI] [PubMed] [Google Scholar]
- 6.Sriram G, Martinez JA, McCabe ER, Liao JC, Dipple KM. Single-gene disorders: what role could moonlighting enzymes play? Am J Hum Genet. 2005;76:911–924. doi: 10.1086/430799. [DOI] [PMC free article] [PubMed] [Google Scholar]
- 7.Jeffery CJ. Moonlighting proteins. Trends Biochem Sci. 1999;24:8–11. doi: 10.1016/s0968-0004(98)01335-8. [DOI] [PubMed] [Google Scholar]
- 8.Okamoto K, Isohashi F, Horiuchi M, Sakamoto Y. An ATP-stimulated factor that enhances the nuclear binding of “activated” receptor-glucocorticoid complex. Biochem Biophys Res Commun. 1984;121:940–945. doi: 10.1016/0006-291x(84)90767-8. [DOI] [PubMed] [Google Scholar]
- 9.Sriram G, Rahib L, He J-S, Campos AE, Parr LS, Liao JC, Dipple KM. Global metabolic effects of glycerol kinase overexpression in rat hepatoma cells. Mol Genet Metab. 2008;93:145–159. doi: 10.1016/j.ymgme.2007.09.008. [DOI] [PMC free article] [PubMed] [Google Scholar]
- 10.Martinez Agosto JA, McCabe ERB. Conserved family of glycerol kinase loci in Drosophila melanogaster. Mol Genet Metab. 2006;88:334–345. doi: 10.1016/j.ymgme.2006.01.002. [DOI] [PMC free article] [PubMed] [Google Scholar]
- 11.McCabe ERB. Human glycerol kinase deficiency: An inborn error of compartmental metabolism. Biochem Med. 1983;30:215. doi: 10.1016/0006-2944(83)90088-1. [DOI] [PubMed] [Google Scholar]
- 12.Östlund A-K, Göhring U, Krause J, Brdiczka D. The binding of glycerol kinase to the outer membrane of rat liver mitochondria: Its importance in metabolic regulation. Biochem Med. 1983;30:231–245. doi: 10.1016/0006-2944(83)90089-3. [DOI] [PubMed] [Google Scholar]
- 13.Gaudet D, Arsenault S, Perusse L, Vohl MC, St-Pierre J, Bergeron J, Despres JP, Dewar K, Daly MJ, Hudson T, Rioux JD. Glycerol as a correlate of impaired glucose tolerance: dissection of a complex system by use of a simple genetic trait. Am J Hum Genet. 2000;66:1558–1568. doi: 10.1086/302903. [DOI] [PMC free article] [PubMed] [Google Scholar]
- 14.Lehmann JM, Moore LB, Smith-Oliver TA, Wilkison WO, Willson TM, Kliewer SA. An antidiabetic thiazolidinedione is a high affinity ligand for peroxisome proliferator-activated receptor gamma (PPAR gamma) J Biol Chem. 1995;270:12953–12956. doi: 10.1074/jbc.270.22.12953. [DOI] [PubMed] [Google Scholar]
- 15.Guan HP, Li Y, Jensen MV, Newgard CB, Steppan CM, Lazar MA. A futile metabolic cycle activated in adipocytes by antidiabetic agents. Nat Med. 2002;8:1122–1128. doi: 10.1038/nm780. [DOI] [PubMed] [Google Scholar]
- 16.Guan HP, Ishizuka T, Chui PC, Lehrke M, Lazar MA. Corepressors selectively control the transcriptional activity of PPAR gamma in adipocytes. Genes Dev. 2005;19:453–461. doi: 10.1101/gad.1263305. [DOI] [PMC free article] [PubMed] [Google Scholar]
- 17.Rahib L, MacLennan NK, Horvath S, Liao JC, Dipple KM. Glycerol kinase deficiency alters expression of genes involved in lipid metabolism, carbohydrate metabolism, and insulin signaling. Eur J Hum Genet. 2007;15:646–657. doi: 10.1038/sj.ejhg.5201801. [DOI] [PubMed] [Google Scholar]
- 18.MacLennan NK, Rahib L, Shin C, Fang Z, Horvath S, Dean J, Liao JC, McCabe ERB, Dipple KM. Targeted disruption of glycerol kinase gene in mice: expression analysis in liver shows alterations in network partners related to glycerol kinase activity. Hum Mol Genet. 2006;15:405–415. doi: 10.1093/hmg/ddi457. [DOI] [PubMed] [Google Scholar]
- 19.Guo Z, Jensen MD. Blood glycerol is an important precursor for intramuscular triacylglycerol synthesis. J Biol Chem. 1999;274:23702–23706. doi: 10.1074/jbc.274.34.23702. [DOI] [PubMed] [Google Scholar]
- 20.Montell E, Lerin C, Newgard CB, Gomez-Foix AM. Effects of modulation of glycerol kinase expression on lipid and carbohydrate metabolism in human muscle cells. J Biol Chem. 2002;277:2682–2686. doi: 10.1074/jbc.M107227200. [DOI] [PubMed] [Google Scholar]
- 21.Hughes SM, Blau HM. Migration of myoblasts across basal lamina during skeletal muscle development. Nature. 1990;345:350–353. doi: 10.1038/345350a0. [DOI] [PubMed] [Google Scholar]
- 22.Rando TA, Blau HM. Primary mouse myoblast purification, characterization, and transplantation for cell-mediated gene therapy. J Cell Biol. 1994;125:1275–1287. doi: 10.1083/jcb.125.6.1275. [DOI] [PMC free article] [PubMed] [Google Scholar]
- 23.Mohler WA, Blau HM. Gene expression and cell fusion analyzed by lacZ complementation in mammalian cells. Proc Natl Acad Sci U S A. 1996;93:12423–12427. doi: 10.1073/pnas.93.22.12423. [DOI] [PMC free article] [PubMed] [Google Scholar]
- 24.Dai Y, Roman M, Naviaux RK, Verma IM. Gene therapy via primary myoblasts: Long-term expression of factor IX protein following transplantation in vivo. Proceedings of the National Academy of Sciences. 1992;89:10892–10895. doi: 10.1073/pnas.89.22.10892. [DOI] [PMC free article] [PubMed] [Google Scholar]
- 25.Charlton CA, Mohler WA, Radice GL, Hynes RO, Blau HM. Fusion competence of myoblasts rendered genetically null for N-cadherin in culture. J Cell Biol. 1997;138:331–336. doi: 10.1083/jcb.138.2.331. [DOI] [PMC free article] [PubMed] [Google Scholar]
- 26.Blanco-Bose WE, Yao C-C, Kramer RH, Blau HM. Purification of mouse primary myoblasts based on alpha 7 integrin expression. Exp Cell Res. 2001;265:212–220. doi: 10.1006/excr.2001.5191. [DOI] [PubMed] [Google Scholar]
- 27.Pownall ME, Gustafsson MK, Emerson CP. Myogenic regulatory factors and the specification of muscle progenitors in vertebrate embryos. Annu Rev Cell Dev Biol. 2002;18:747–783. doi: 10.1146/annurev.cellbio.18.012502.105758. [DOI] [PubMed] [Google Scholar]
- 28.Berkes CA, Tapscott SJ. MyoD and the transcriptional control of myogenesis. Semin Cell Dev Biol. 2005;16:585–595. doi: 10.1016/j.semcdb.2005.07.006. [DOI] [PubMed] [Google Scholar]
- 29.Huq AH, Lovell RS, Ou CN, Beaudet AL, Craigen WJ. X-linked glycerol kinase deficiency in the mouse leads to growth retardation, altered fat metabolism, autonomous glucocorticoid secretion and neonatal death. Hum Mol Genet. 1997;6:1803–1809. doi: 10.1093/hmg/6.11.1803. [DOI] [PubMed] [Google Scholar]
- 30.Li C, W WH. DNA-Chip Analyzer (dChip) In: G E, Parmigiani G, Irizarry R, Zeger SL, editors. The analysis of gene expression analysis and software. springer; New York: 2003. pp. 120–141. [Google Scholar]
- 31.Johnson WE, Li C, Rabinovic A. Adjusting batch effects in microarray expression data using empirical Bayes methods. Biostat. 2007;8:118–127. doi: 10.1093/biostatistics/kxj037. [DOI] [PubMed] [Google Scholar]
- 32.Liao JC, Boscolo R, Yang YL, Tran LM, Sabatti C, Roychowdhury VP. Network component analysis: reconstruction of regulatory signals in biological systems. Proc Natl Acad Sci U S A. 2003;100:15522–15527. doi: 10.1073/pnas.2136632100. [DOI] [PMC free article] [PubMed] [Google Scholar]
- 33.Kao KC, Yang YL, Boscolo R, Sabatti C, Roychowdhury V, Liao JC. Transcriptome-based determination of multiple transcription regulator activities in Escherichia coli by using network component analysis. Proc Natl Acad Sci U S A. 2004;101:641–646. doi: 10.1073/pnas.0305287101. [DOI] [PMC free article] [PubMed] [Google Scholar]
- 34.Springer ML, Rando T, Blau HM. Gene delivery to muscle. Current protocols in human genetics supplement. 2001;31 doi: 10.1002/0471142905.hg1304s31. [DOI] [PubMed] [Google Scholar]
- 35.Hosack D, Dennis G, Sherman B, Lane H, Lempicki R. Identifying biological themes within lists of genes with EASE. Genome Biology. 2003;4:R70. doi: 10.1186/gb-2003-4-10-r70. [DOI] [PMC free article] [PubMed] [Google Scholar]
- 36.Livak KJ, Schmittgen TD. Analysis of relative gene expression data using real-time quantitative PCR and the 2(-Delta Delta C(T)) Method. Methods. 2001;25:402–408. doi: 10.1006/meth.2001.1262. [DOI] [PubMed] [Google Scholar]
- 37.Hu E, Liang P, Spiegelman BM. AdipoQ is a novel adipose-specific gene dysregulated in obesity. J Biol Chem. 1996;271:10697–10703. doi: 10.1074/jbc.271.18.10697. [DOI] [PubMed] [Google Scholar]
- 38.Yamauchi T, Kamon J, Waki H, Terauchi Y, Kubota N, Hara K, Mori Y, Ide T, Murakami K, Tsuboyama-Kasaoka N, Ezaki O, Akanuma Y, Gavrilova O, Vinson C, Reitman ML, Kagechika H, Shudo K, Yoda M, Nakano Y, Tobe K, Nagai R, Kimura S, Tomita M, Froguel P, Kadowaki T. The fat-derived hormone adiponectin reverses insulin resistance associated with both lipoatrophy and obesity. Nat Med. 2001;7:941–946. doi: 10.1038/90984. [DOI] [PubMed] [Google Scholar]
- 39.Arita Y, Kihara S, Ouchi N, Takahashi M, Maeda K, Miyagawa J-i, Hotta K, Shimomura I, Nakamura T, Miyaoka K, Kuriyama H, Nishida M, Yamashita S, Okubo K, Matsubara K, Muraguchi M, Ohmoto Y, Funahashi T, Matsuzawa Y. Paradoxical decrease of an adipose-specific protein, adiponectin, in obesity. Biochem Biophys Res Commun. 1999;257:79–83. doi: 10.1006/bbrc.1999.0255. [DOI] [PubMed] [Google Scholar]
- 40.Yoon MJ, Lee GY, Chung J-J, Ahn YH, Hong SH, Kim JB. Adiponectin increases fatty acid oxidation in skeletal muscle cells by sequential activation of AMP-activated protein kinase, p38 mitogen-activated protein kinase, and peroxisome proliferator-activated receptor alpha. Diabetes. 2006;55:2562–2570. doi: 10.2337/db05-1322. [DOI] [PubMed] [Google Scholar]
- 41.Tsuchida A, Yamauchi T, Ito Y, Hada Y, Maki T, Takekawa S, Kamon J, Kobayashi M, Suzuki R, Hara K, Kubota N, Terauchi Y, Froguel P, Nakae J, Kasuga M, Accili D, Tobe K, Ueki K, Nagai R, Kadowaki T. Insulin/Foxo1 pathway regulates expression levels of adiponectin receptors and adiponectin sensitivity. J Biol Chem. 2004;279:30817–30822. doi: 10.1074/jbc.M402367200. [DOI] [PubMed] [Google Scholar]
- 42.Yamauchi T, Nio Y, Maki T, Kobayashi M, Takazawa T, Iwabu M, Okada-Iwabu M, Kawamoto S, Kubota N, Kubota T, Ito Y, Kamon J, Tsuchida A, Kumagai K, Kozono H, Hada Y, Ogata H, Tokuyama K, Tsunoda M, Ide T, Murakami K, Awazawa M, Takamoto I, Froguel P, Hara K, Tobe K, Nagai R, Ueki K, Kadowaki T. Targeted disruption of AdipoR1 and AdipoR2 causes abrogation of adiponectin binding and metabolic actions. Nat Med. 2007;13:332–339. doi: 10.1038/nm1557. [DOI] [PubMed] [Google Scholar]
- 43.Rocchi S, Tartare-Deckert S, Murdaca J, Holgado-Madruga M, Wong AJ, Van Obberghen E. Determination of Gab1 (Grb2-Associated Binder-1) interaction with insulin receptor-signaling molecules. Mol Endocrinol. 1998;12:914–923. doi: 10.1210/mend.12.7.0141. [DOI] [PubMed] [Google Scholar]
- 44.Wang L, Balas B, Christ-Roberts CY, Kim RY, Ramos FJ, Kikani CK, Li C, Deng C, Reyna S, Musi N, Dong LQ, DeFronzo RA, Liu F. Peripheral disruption of the Grb10 gene enhances insulin signaling and sensitivity in vivo. Mol Cell Biol. 2007;27:6497–6505. doi: 10.1128/MCB.00679-07. [DOI] [PMC free article] [PubMed] [Google Scholar]
- 45.Smith FM, Holt LJ, Garfield AS, Charalambous M, Koumanov F, Perry M, Bazzani R, Sheardown SA, Hegarty BD, Lyons RJ, Cooney GJ, Daly RJ, Ward A. Mice with a disruption of the imprinted Grb10 gene exhibit altered body composition, glucose homeostasis, and insulin signaling during postnatal life. Mol Cell Biol. 2007;27:5871–5886. doi: 10.1128/MCB.02087-06. [DOI] [PMC free article] [PubMed] [Google Scholar]
- 46.Zabolotny JM, Kim Y-B, Peroni OD, Kim JK, Pani MA, Boss O, Klaman LD, Kamatkar S, Shulman GI, Kahn BB, Neel BG. Overexpression of the LAR (leukocyte antigen-related) protein-tyrosine phosphatase in muscle causes insulin resistance. Proceedings of the National Academy of Sciences. 2001;98:5187–5192. doi: 10.1073/pnas.071050398. [DOI] [PMC free article] [PubMed] [Google Scholar]
- 47.Christensen B, Gombert AK, Nielsen J. Analysis of flux estimates based on (13) C-labeling experiments. Eur J Biochem. 2002;269:2795–2800. doi: 10.1046/j.1432-1033.2002.02959.x. [DOI] [PubMed] [Google Scholar]
- 48.Sabourin LA, Girgis-Gabardo A, Seale P, Asakura A, Rudnicki MA. Reduced differentiation potential of primary MyoD-/- myogenic cells derived from sdult skeletal muscle. J Cell Biol. 1999;144:631–643. doi: 10.1083/jcb.144.4.631. [DOI] [PMC free article] [PubMed] [Google Scholar]
- 49.Sun L, Trausch-Azar JS, Muglia LJ, Schwartz AL. Glucocorticoids differentially regulate degradation of MyoD and Id1 by N-terminal ubiquitination to promote muscle protein catabolism. Proc Natl Acad Sci U S A. 2008;105:3339–3344. doi: 10.1073/pnas.0800165105. [DOI] [PMC free article] [PubMed] [Google Scholar]
Associated Data
This section collects any data citations, data availability statements, or supplementary materials included in this article.