Abstract
Glycerol kinase has several diverse activities in mammalian cells. Glycerol kinase deficiency is a complex, single-gene, inborn error of metabolism wherein no genotype-phenotype correlation has been established. Since glycerol kinase has been suggested to exhibit additional activities than glycerol phosphorylation, expression level perturbation in this enzyme may affect cellular physiology globally. To investigate this possibility, we conducted metabolic investigations of wild type and two glycerol kinase-overexpressing H4IIE rat hepatoma cell lines constructed in this study. The glycerol kinase-overexpressing cell lines exhibited a significantly higher consumption of carbon sources per cell, suggesting excess carbon expenditure. Furthermore, we quantified intracellular metabolic fluxes by employing stable isotope (13C) labeling with a mathematically designed substrate mixture, gas chromatography-mass spectrometry, and comprehensive isotopomer balancing. This flux analysis revealed that the pentose phosphate pathway flux in the glycerol kinase-overexpressing cell lines was two-fold higher than that in the wild type, in addition to subtler flux changes in other pathways of carbohydrate metabolism. Furthermore, the activity and transcript level of the lipogenic enzyme glucose-6-phosphate dehydrogenase, the rate-limiting enzyme of the pentose phosphate pathway, were also about two-fold higher than that of the wild type; these data corroborate the flux analysis results. This study shows that glycerol kinase affects carbon metabolism globally, possibly through its additional functions, and highlights glycerol kinase’s multifaceted role in cellular physiology.
Keywords: Glycerol kinase, metabolic flux, pentose phosphate pathway, isotopomer, moonlighting enzyme
Introduction
Glycerol kinase (GK)1 is an important enzyme at the interface of carbohydrate and lipid metabolism, catalyzing the interconversion of glycerol and glycerol-3-phosphate [1]. In humans, its activity is highest in the liver [2], where it functions as a lipogenic enzyme. GK is also a moonlighting enzyme, exhibiting many cellular functions unrelated to its biochemical function [3]. In rat liver, GK moonlights as the ATP-stimulated translocation promoter (ASTP), which enhances the nuclear binding of the activated glucocorticoid-receptor complex, a transcription factor [4]. Additionally, GK has been shown to bind to histones [5], to interact with porin or the voltage-dependent anion channel on the outer surface of the outer mitochondrial membrane [6], and to play a role in apoptosis [7, 8]. Studies have also suggested links between GK and insulin sensitivity; GK is overexpressed in response to thiazolidinediones, common drugs to treat type 2 diabetes mellitus [9], and this overexpression relieves insulin resistance [10, 11]. Thus, mammalian GK is a multifaceted enzyme.
The diverse cellular role of GK is underscored by the fact that glycerol kinase deficiency (GKD), an X-linked, single-gene inborn error of metabolism (IEM), exhibits complexities that are not trivially explained by lack of the enzymatic activity of GK. Isolated GKD can be either symptomatic (presenting episodes of metabolic and central nervous system decompensation that are particularly acute during childhood), or asymptomatic [1]. Previous studies have shown no correlation between genotype (mutations in the GK gene) and phenotype (symptomaticity) in affected individuals. For example, the same GKD mutation was observed in both a symptomatic and an asymptomatic individual [12], and this discrepancy was also reported in two brothers with the identical mutation [13]. The glycerol phosphorylating activity of GK in lymphoblastoid cell lines or fibroblasts from symptomatic and asymptomatic individuals was similar. Mapping of the individuals’ mutations to the three-dimensional structure of Escherichia coli GK revealed that the symptomatic individuals’ mutations were in the same region as the mutations of the asymptomatic individuals, adjacent to the active-site cleft [1]. The last two observations show that the glycerol phosphorylating activity of GK may not, by itself, explain the complexity of GKD.
Previous reviews have proposed several reasons for the existence of complexities in single-gene disorders such as GKD [3, 14–16], one of which is the role of systems dynamics, including flux through other metabolic pathways, in imparting a phenotype that is not easily deduced from the genotype. Further, the significance of direct measurement of metabolic flux in understanding IEM has been pointed out recently [17]. Therefore, the effect of GK on metabolic flux in other, apparently unrelated pathways is an important question that needs to be addressed to gain further insight into GK and GKD.
Flux quantification using stable isotope labeling and deciphering isotopomer measurements is a potent methodology to simultaneously and accurately visualize carbon flow in several metabolic pathways. In this article, we employed such a methodology to investigate the effect of GK overexpression on fluxes of carbohydrate metabolism in H4IIE rat hepatoma cells. We generated stably transformed GK-overexpressing rat hepatoma (H4IIE) cell lines, and evaluated fluxes in the wild type and GK-overexpressing cell lines by employing 13C labeling and mass isotopomer analysis. Our results show that GK overexpression significantly alters metabolic fluxes, including a substantially higher flux through the pentose phosphate pathway (PPP). These results were corroborated by measurements of enzyme activity and gene expression of glucose-6-phosphate dehydrogenase (G6PDH), the rate-limiting enzyme of the PPP.
Materials and Methods
Cell Lines and Stable Transfection of Human GK
H4IIE, a rat hepatoma cell line (American Type Culture Collection, Manassas, VA), and GK-overexpressing cell lines derived therefrom were grown at 37°C in a humidified atmosphere containing 5% CO2 in minimal essential medium (MEM) with L-glutamine (Mediatech, Herndon, VA), supplemented with 10% (v/v) fetal bovine serum (Invitrogen, Carlsbad, CA) and 1% (v/v) penicillin-streptomycin-neomycin (Invitrogen).
To stably transfect human GK into the H4IIE cells, the cDNA encoding amino acids 1 to 524 of human GK was inserted into the BamH1 and HindIII sites of the pCMV-Tag2 vector (Stratagene, La Jolla, CA). This vector (or the empty pCMV-Tag2 vector) was transfected into the H4IIE cells by using SuperFect transfection reagent as per the manufacturer’s protocol (QIAGEN, Valencia, CA). Stable cells were selected with and maintained in media containing 500 μg ml−1 G418 (Mediatech). 13C labeling experiments with the GK-overexpressing cells were performed with and without G418 in the medium, and yielded statistically identical (p > 0.05) extracellular fluxes and isotopomer abundances.
Gene Expression Assays
Gene expression of GK, G6PDH, fructose-1,6-bisphosphatase (F16bPase), pyruvate kinase (PyK), phosphoenolpyruvate carboxykinase (PEPCK), and citrate synthase (CS) was assayed by real time (RT)-PCR, as described previously [18] with 18s rRNA (Applied Biosystems, Foster City, CA) used as an endogenous control. Briefly, mRNA extracted from the cell lines was used to synthesize cDNA by using Superscript III reverse transcriptase (Invitrogen) and random primers. The PCR was performed by using TaqMan gene expression assays (Applied Biosystems) and the products were detected with the ABI PRISM 7700 sequence detection system (Applied Biosystems). Fold differences in mRNA expression were calculated using the 2−ΔΔCT method [19].
GK Activity Assay
GK activity was determined by using a radiolabel assay reported previously [20]. Two biological samples of each cell line were assayed in duplicate with 2 μg and 4 μg of total cellular protein for 20 min, assay conditions previously determined by us to be optimal for H4IIE cells (data not shown). For each assay, the scintillation count was plotted against the amount of protein, and the slope of the resultant line was recorded as the GK activity.
G6PDH Activity Assay
G6PDH activity was determined by using a spectrophotometric assay reported previously [21]. The assays were performed at room temperature with a 20 μg extract of cellular protein in a buffer consisting of 0.1 M Tris-HCl (pH 8.5), 0.2 mM NADP and 2 mM glucose-6-phosphate. NADPH production was measured at 3 min and 6 min, at 340 nm in a UV/Vis spectrophotometer (Beckman Coulter, Fullerton, CA). Assays were performed in duplicate on two biological samples of each cell line. For each assay, the NADPH produced was plotted against time, and the slope of the resultant line was recorded as the G6PDH activity.
13C Labeling Experiment
For the 13C labeling experiment, the MEM in the growth medium was replaced with Dulbecco’s modified Eagle medium (DMEM) supplemented with 1 g L−1 glucose. The supplemented glucose was composed of 50.5% 1-13C, 44.3% U-13C, and 5.2 % naturally abundant glucose (mol/mol), a mixture that was mathematically designed to allow precise and concurrent evaluation of fluxes in central carbon metabolism (see Results). Together with naturally abundant glucose present in the fetal bovine serum, the overall glucose composition in the medium was 45.9% 1-13C, 40.2% U-13C and 13.9% naturally abundant glucose (mol/mol).
During the growth experiments, cell growth was linear (cell mass increasing at a constant rate with respect to time), as is expected of hepatoma cells [22]. Cells were plated on 10 cm plates at an initial density of 4.0 × 10⁶ cells plate−1, and were grown on the aforementioned 13C glucose mixture for of 6.8 d (passage 1), then re-plated at an initial density of 12.5 × 10⁶ cells plate−1 in fresh media containing the same 13C glucose mixture, and grown for 6.1 d (passage 2). The cells were thus grown on the 13C glucose mixture for two passages to wash out any previous unlabeled carbon in the biomass and to achieve isotopic steady state. The attainment of isotopic steady state by day 6 of the second passage was verified (see Results). During both passages, the medium was replaced and extracellular fluxes were measured every 3 d. Cells were harvested at the end of both passages, and a protein fraction was extracted from each sample.
Protein Extraction, Hydrolysis, and Derivatization
Protein was extracted in a 1% KCl buffer supplemented with 1mM EDTA. During the extraction, the cells were lysed by sonicating with alternating on/off cycles of 1 min each, eight times. The extracted protein was lyophilized, and hydrolyzed for 12 h at 130°C in hydrolysis tubes (Pierce Endogen, Rockford, IL), containing 6N hydrochloric acid (100 μL HCl:100 μg protein). Before hydrolysis, the hydrolysis tube was evacuated, flushed with nitrogen to remove residual oxygen, and re-evacuated. Residual acid in the hydrolysate was evaporated by flushing with nitrogen at 70°C for 1 h. The hydrolysate was tert-butyldimethylsilyl (tBDMS)-derivatized with 50 μl N,N-dimethylformamide (Pierce Endogen) and 50 μl N-methyl-N-(tert-butyldimethylsilyl) trifluoroacetamide (Pierce Endogen), for 1 h at 70°C [23], and injected into the gas chromatograph-mass spectrometer (GC-MS) immediately.
Quantification of Mass Isotopomer Abundances by GC-MS
We employed an Agilent 6890 GC coupled to an Agilent 5973 MS (Agilent Technologies, Palo Alto, CA). The GC was equipped with an HP-5ms column of dimensions 0.25 mm × 30 m × 0.25 μm (Agilent Technologies). Five μl of each sample was injected automatically, at a split ratio of 30:1. Helium was used as the carrier gas, at a constant flow rate of 1.0 ml min−1. The oven temperature was held at 150°C for 2 min, then increased at 3°C min−1 to 250°C, and then at 10°C min−1 to 275°C, where it was held constant up to a run time of 45 min. The MS ran in electron ionization mode, with an ion source temperature of 280°C. Mass spectra were recorded in the Selected Ion Monitoring (SIM) mode. All GC-MS data were analyzed and quantified with the MSD ChemStation software (Agilent Technologies). The NIST mass spectral library (National Institute of Standards and Technology, Gaithersburg, MD) was used for identification of compounds in the mass spectra.
Mass spectra for naturally abundant isotopes of elements other than metabolic carbon, were determined using a method developed in our laboratory (Supplementary Material). [M–n]+ peaks, occurring on the mass spectrum due to loss of protons, were corrected for by employing a procedure outlined by Klapa et al. [23]. These effects were quite small (typically ~0.5% of the total signal of the mass fragment), and their contributions to the error in mass isotopomer abundances were substantially smaller than the biological error.
Quantification of Extracellular and Biomass Fluxes
Extracellular fluxes (those between the cells and the growth medium) and fluxes towards biomass were measured as described below. Glucose, triglycerides, glycerol, and lactate were determined enzymatically: glucose with the Infinity Hexokinase kit (Thermo Electron, Waltham, MA), triglycerides and glycerol with a serum triglyceride determination kit (Sigma-Aldrich, St. Louis, MO), and lactate with a lactate kit (Lactate kit, Trinity Biotech, Berkeley Heights, NJ). Glutamine and other amino acids in the growth medium were determined by tBDMS-derivatizing a lyophilized fraction of the medium, analyzing the derivatized product on a GC as explained above. The results were corrected for the spontaneous decomposition of glutamine at 37°C, which was obtained by maintaining cell-free control plates containing only media in the incubator for the period of the experiment. Total protein in the growth medium was assayed by using the Bradford assay (Bio-Rad, Hercules, CA). Cell number was quantified by counting cells with a hemacytometer. The proportion of amino acids in the cellular protein was determined by quantifying the gas chromatogram of the derivatized protein hydrolysate. For the composition of biomass, we used a published value of cellular protein content of H4IIE cells [24], our measured values of proteinogenic amino acids (~70% of carbon in the H4IIE cells), and average values of published cellular lipid and glycogen contents for rat liver [25–27].
Isotopomer Analysis and Flux Evaluation
Isotopomer analysis was performed by writing metabolite and isotopomer balances as described previously [28], and solving the balances by Boolean function mapping [29] and cumulative isotopomer balancing [30, 31]. Fluxes were quantified from the measured mass isotopomer abundances and extracellular fluxes by using comprehensive isotopomer balancing and a global optimization routine. The objective of the optimization was to evaluate a set of stoichiometrically feasible fluxes that best accounts for the measured mass isotopomer abundances and extracellular fluxes. The objective function was the χ2 error, expressed as
| (1) |
where Ixj is the measured value of the j-th measured mass isotopomer abundance, Ij is the value of this isotopomer abundance simulated from the evaluated fluxes, σj is the standard deviation of the j-th isotopomer abundance, and P is the number of mass isotopomer abundances measured.
We used a metabolic network model consisting of glycolysis, PPP, tricarboxylic acid (TCA) cycle, and anaplerotic reactions. Synthesis of (non-essential) proteinogenic amino acids and lipogenesis were also included in the metabolic model. Since the growth medium used in this study contained carbon sources other than glucose (triglycerides, glutamine and other amino acids), we included carbon entry from these into primary metabolism. These were primarily the entry of glycerol (from triglycerides) and pyruvate (from amino acids) into glycolysis, and the entry of acetyl CoA (from triglycerides through lipid oxidation) and glutamine into the TCA cycle. All fluxes were assumed bidirectional unless known to be irreversible under physiological conditions; therefore, the effect of reaction reversibility on the labeling is taken into account. Furthermore, the uniqueness of the evaluated flux solution was ascertained, and statistical analysis of the fluxes was performed as described previously [28] to obtain standard deviations for the fluxes.
Isotopomer balancing as well as evaluation and statistical analysis of fluxes were implemented through the computer program NMR2Flux [28]. For this study, the program was adapted to utilize mass isotopomer data. All isotopomer analyses and flux evaluation reported in this work were performed using this adaptation of the program.
Statistical Analyses
The Student’s t-test was used to determine significances of differences between means. Principal component analysis was performed with MATLAB (The Mathworks, Natick, MA). Standard deviations for the evaluated fluxes were calculated using a Bootstrap Monte Carlo algorithm [28, 32].
Results
Construction of GK-Overexpressing H4IIE Cell Lines
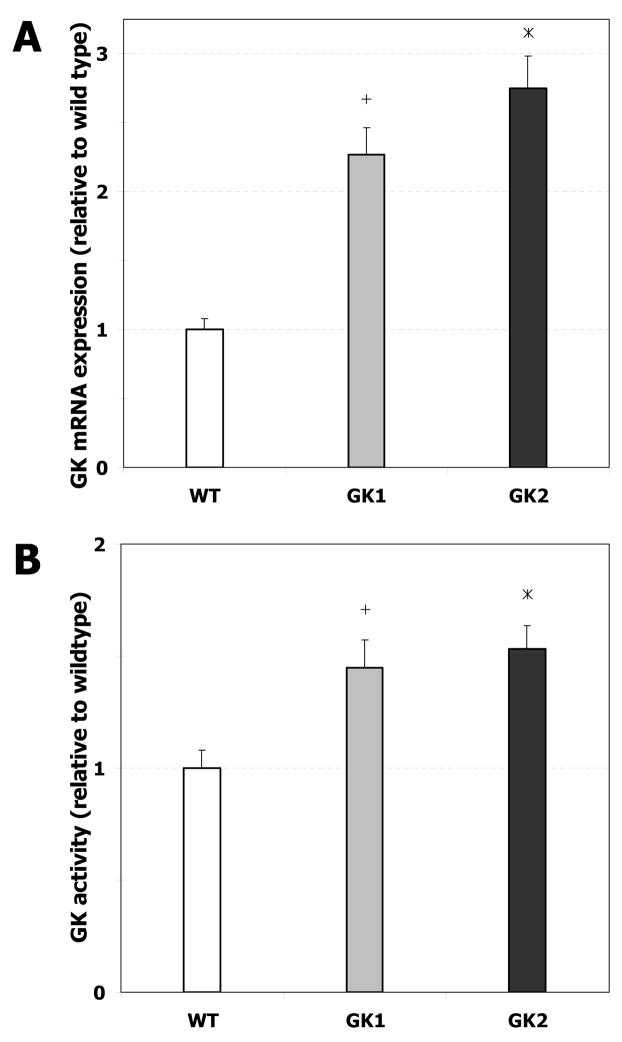
The stable transfection of human GK cDNA into H4IIE rat hepatoma cells resulted in two transgenic cell lines that overexpressed GK (GK1 and GK2). The expression of GK mRNA in GK1 was 2.27 (± 0.19) fold that of the wild type, whereas that in GK2 was 2.75 (± 0.23) fold that of the wild type (Fig. 1A; p < 0.05). The GK enzymatic activity of GK1 was 1.45 (± 0.12) fold that of the wild type, whereas that of GK2 was 1.53 (± 0.11) fold that of the wild type (Fig. 1B; p < 0.05).
Fig. 1. GK expression and enzymatic activity in wild type (WT) and GK-overexpressing (GK1 and GK2) H4IIE cell lines.
A. GK mRNA expression, quantified as described in Materials and Methods, is reported relative to wild type. Error bars represent standard deviation between biological replicates. ‘+’ denotes significant difference (p < 0.05) between GK1 and the wild type, ‘*’ denotes significant difference (p < 0.05) between GK2 and the wild type. B. GK enzymatic activity, determined as described in Materials and Methods, is reported relative to wild type. Error bars represent standard deviation between biological replicates. ‘+’ denotes significant difference (p < 0.05) between GK1 and the wild type, ‘*’ denotes significant difference (p < 0.05) between GK2 and the wild type.
GK-Overexpressing Cell Lines Exhibit Higher Consumption of Carbon Sources Per Cell
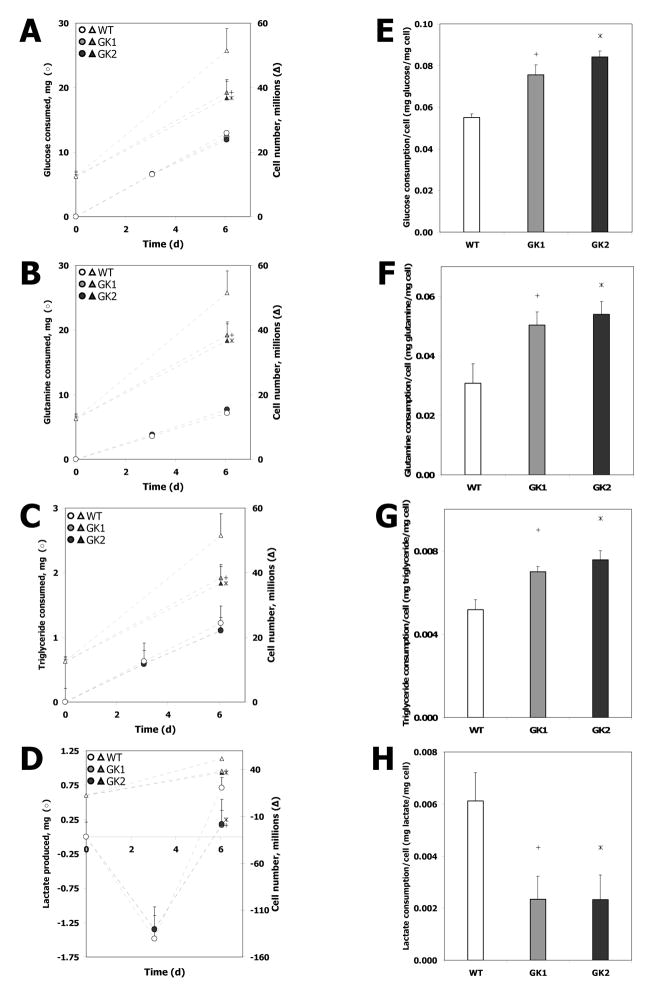
Metabolic investigations revealed that the GK-overexpressing cell lines exhibited a significantly higher consumption of carbon sources, on a per cell basis. Cells were grown on 10 cm plates for 6 d, with the media replaced every 3 d. Cell growth as well as the consumption of the three primary carbon sources (glucose, glutamine and triglycerides) utilized by the cells were measured on day 3 and day 6 of culture (Fig. 2). Both GK-overexpressing cell lines consumed the major carbon sources glucose (Fig. 2A), glutamine (Fig. 2B), and triglycerides (Fig. 2C) at rates that were nearly equal to that of the wild type. Interestingly, the growth rates of the GK-overexpressing cell lines GK1 (4.30 ± 0.7 × 10⁶ cells d−1 plate−1 or 1.36 ± 0.21 mg d−1 plate−1) and GK2 (4.01 ± 0.8 × 10⁶ cells d−1 plate−1 or 1.27 ± 0.27 mg d−1 plate−1) were significantly lower than that of the wild type (6.45 ± 1.1 × 10⁶ cells d−1 plate−1 or 2.04 ± 0.36 mg d−1 plate−1) (p < 0.05; Fig. 2A,B,C). Therefore, the consumption of glucose (Fig. 2D), glutamine (Fig. 2E) and triglycerides (Fig. 2F) on a per cell basis was significantly higher (p < 0.05) in the GK-overexpressing cell lines than in the wild type. Furthermore, the lactate production rates of GK1 (0.06 ± 0.02 mg d−1 plate−1) and GK2 (0.06 ± 0.02 mg d−1 plate−1) between 3 d and 6 d, although substantially lower than the cell growth or carbon source consumption rates, were also significantly lower than that of the wild type (0.24 ± 0.04 mg d−1 plate−1) (p < 0.05; data not shown). Therefore, the GK-overexpressing cell lines consume higher amounts of carbon sources per cell than the wild type, while not producing additional lactate. This suggests that GK overexpression in rat hepatoma cells results in excess carbon expenditure.
Fig. 2. Carbon source consumption in wild type (WT) and GK-overexpressing (GK1 and GK2) H4IIE cell lines.
(A) Glucose consumption, (B) glutamine consumption, (C) triglyceride consumption, and (D) lactate production by the wild type and cell lines GK1, and GK2 (circles, left axis). The corresponding increase in cell number (triangles, right axis) is shown on all three plots for reference. The consumption/production on a per cell basis is also shown: (E) glucose, (F) glutamine, (G) triglycerides, and (H) lactate. The numbers in panels E–H were obtained from panels A–D by dividing the carbon source consumption per day by the increase in cells (converted to mg) per day. Hollow circles, triangles, and bars: WT, gray circles, triangles, and bars: GK1, black circles, triangles, and bars: GK2. Error bars represent standard deviation between biological replicates. ‘+’ denotes significant difference (p < 0.05) between GK1 and the wild type, ‘*’ denotes significant difference (p < 0.05) between GK2 and the wild type.
Design of 13C Labeling Experiment
To investigate which metabolic pathways contributed to the excess carbon expenditure observed in the GK-overexpressing cells, we designed a 13C labeling experiment to precisely and simultaneously evaluate fluxes in central carbon metabolism. Toward this objective, we determined the best possible mixture of 1-13C and U-13C glucose that yielded precise determinations of fluxes in glycolysis, the pentose phosphate pathway (PPP), the tricarboxylic acid (TCA) cycle, and the anaplerotic pathways, by using a reported methodology [33] and our adaptation (see Materials and Methods) of the flux evaluation program NMR2Flux [28].
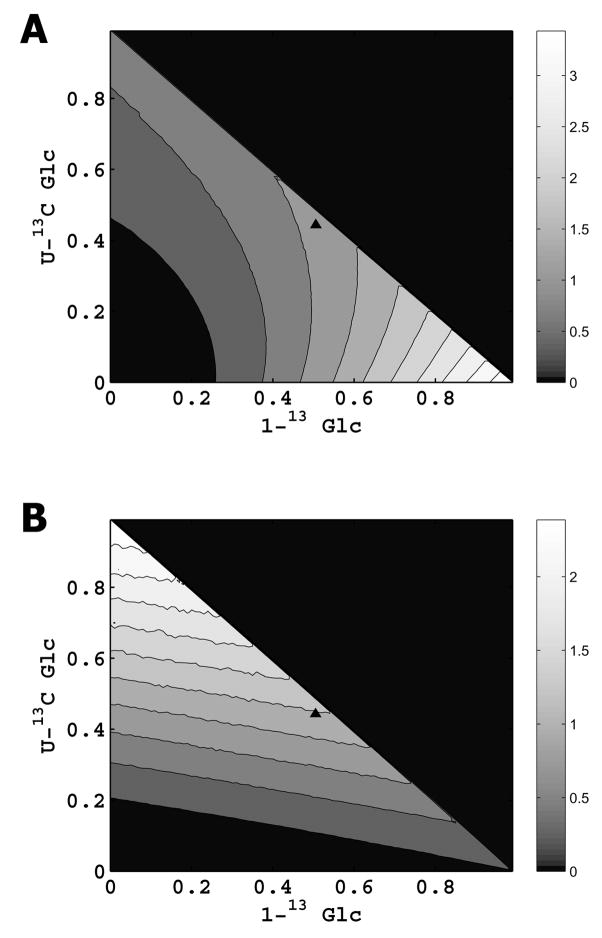
Simulations showed that when only glycolysis and the PPP are considered, the labeling experiment is most precise when 100% 1-13C glucose is used (Fig. 3A). Conversely, when only the TCA cycle, anaplerotic pathways, and carbon entry from glutamine, amino acids, and lipids are considered, the labeling experiment is most precise when 100% U-13C glucose is used (Fig. 3B). Therefore, in this work, we used a mixture approximately midway between these extremes (50.5 mol% 1-13C glucose, 44.3 mol% U-13C glucose and 5.2 mol% naturally abundant glucose), that had the highest precision to simultaneously measure fluxes in all the above pathways. Together with naturally abundant glucose present in the fetal bovine serum, the overall glucose composition in the medium was 45.9% 1-13C, 40.2% U-13C and 13.9% naturally abundant glucose (mol/mol).
Fig. 3. Mathematical design of 13C labeling experiment.
A. Precision of 13C labeling experiment in determining glycolysis and PPP fluxes, when a mixture of 1-13C glucose, U-13C glucose, and naturally abundant glucose is supplied. Dark color indicates low precision, and light color indicates high precision, as shown in the adjoining color map. The 1-13C/U-13C glucose combination used in this work is indicated by ‘▲’. B. Precision of 13C labeling experiment in determining TCA cycle, anaplerotic, and associated carbon source entry fluxes, when a mixture of 1-13C glucose, U-13C glucose, and naturally abundant glucose is supplied. Dark color indicates low precision, and light color indicates high precision, as shown in the adjoining color map. The 1-13C/U-13C glucose combination used in this work is indicated by ‘▲’.
Mass Isotopomer Abundances
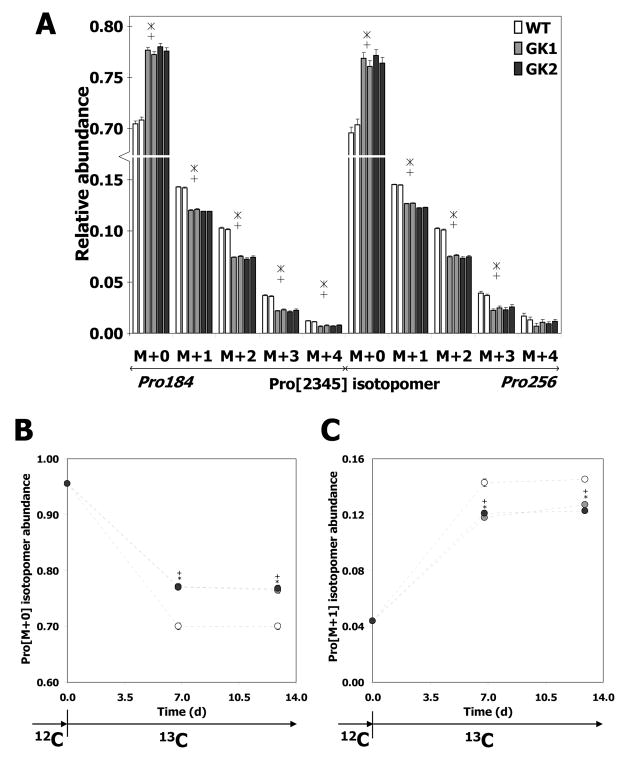
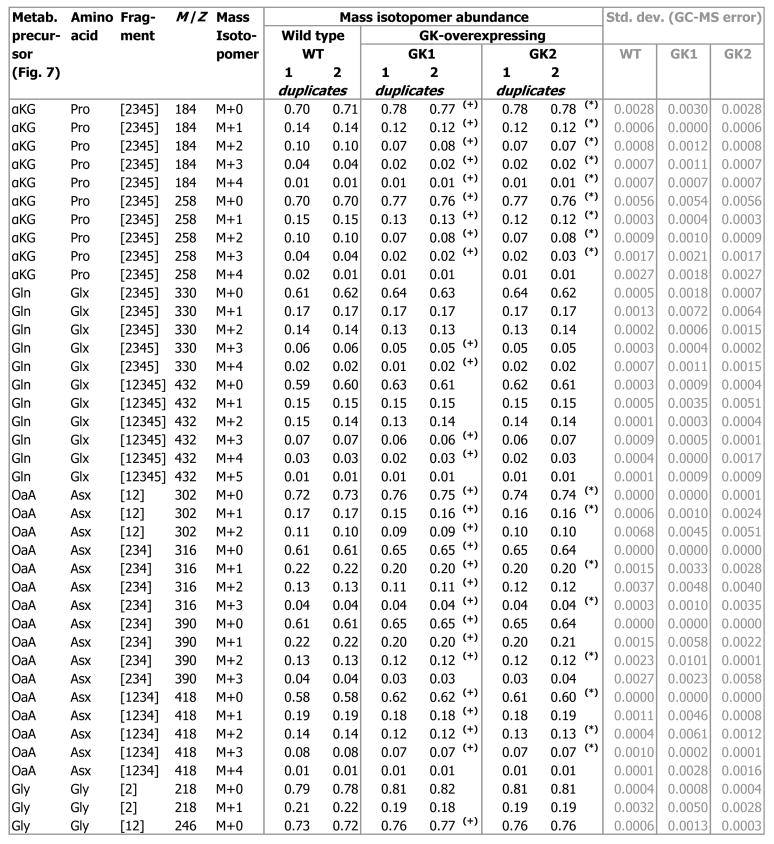
We performed a 13C labeling experiment by growing the wild type and GK-overexpressing cell lines on the mixture of 13C glucose isotopomers designed above. Subsequently, we measured mass isotopomer abundances of proteinogenic amino acids (comprising ~70% of carbon in the H4IIE cells) synthesized from the supplied 13C glucose. Mass isotopomer abundances were quantified by analyzing hydrolyzed, derivatized protein from the 13C glucose-grown cells on a GC-MS. In the resulting chromatograms, we identified 16 proteinogenic amino acids by their known, unique mass fragmentation patterns (data not shown). The mass spectrum of each amino acid contained fragment ions of that amino acid, whose isotopic compositions were quantified and corrected for natural abundances of elements other than metabolic carbon (Supplementary Material), to obtain mass isotopomer abundances. Fig. 4A depicts the mass isotopomer abundances of an illustrative amino acid fragment Pro[2345], corresponding to carbon atoms C2 through C5 of proline (Pro). These were obtained from two mass spectral fragments (Pro184 [m/z 184], Pro256 [m/z 256]). Most of the Pro[2345] mass isotopomer abundances of lines GK1 and GK2 were significantly different from those of the wild type (p < 0.03, Fig. 4A).
Fig. 4. Pro[2345] (proline) mass isotopomer abundances of wild type (WT) and GK-overexpressing (GK1 and GK2) H4IIE cells.
A. Hollow bars: wild type, gray bars: GK1, black bars: GK2. The two bars corresponding to each cell line represent biological replicates. Error bars represent standard deviation between replicate GC-MS injections. ‘+’ denotes significant difference (p < 0.03) between line GK1 and the wild type, ‘*’ denotes significant difference (p < 0.03) between line GK2 and the wild type. B, C. Wild type and GK-overexpressing H4IIE cells were cultured on a 13C glucose mixture for two passages of 6 d each, and isotopomer abundances were measured at the end of passage 1 (day 6) and passage 2 (day 12). B. Mass [M+0]. C. Mass [M+1]. Hollow circles: WT, gray circles: GK1, black circles: GK2. Error bars represent standard deviation between biological replicates. ‘+’ denotes p < 0.05 between GK1 and the wild type, ‘*’ denotes p < 0.05 between GK2 and wild type. The isotopomer abundances were corrected for natural abundances of elements other than metabolic carbon as explained in Supplementary Material.
The attainment of isotopic steady state is essential for the evaluation of fluxes from labeling data. To verify isotopic steady state, we cultured the H4IIE cells on the aforementioned 13C glucose mixture for two passages of ~6 d each, and measured 13C isotopomers of non-essential proteinogenic amino acids at the end of passage 1 (after 6.8 d in 13C label) and passage 2 (after 12.9 d in 13C label). The mass isotopomer abundances of an illustrative amino acid fragment Pro[2345] (derived from Pro184 [m/z 184]) are depicted in Fig. 4B,C. Clearly, the isotopomer abundances at 6.8 d are identical (99% ± 1%) to those at 12.9 d, for both the wild type and GK-overexpressing cells. This verifies that isotopic steady state was attained in both the wild type and GK-overexpressing cells, and that the differences between the mass isotopomer abundances of the wild type and GK-overexpressing cell lines (Fig. 4A) were not due to the difference in their growth rates. Furthermore, this result also shows that the metabolism of these cells does not change during the course of the labeling experiment.
In addition, we verified that the isotopomer abundances and the extracellular fluxes of the GK-overexpressing cells were identical whether grown in the presence or absence on G418 (data not shown), so that the observed metabolic differences between the wild type and GK-overexpressing cell lines are not due to the presence of G418 in the medium of the GK-overexpressing cells. We also verified that the isotopomer abundances and the extracellular fluxes of the wild type cells were similar to those of empty pCMV-Tag2 vector-transfected H4IIE cells (data not shown), so that the transfection of the vector causes negligible metabolic flux changes in the cells.
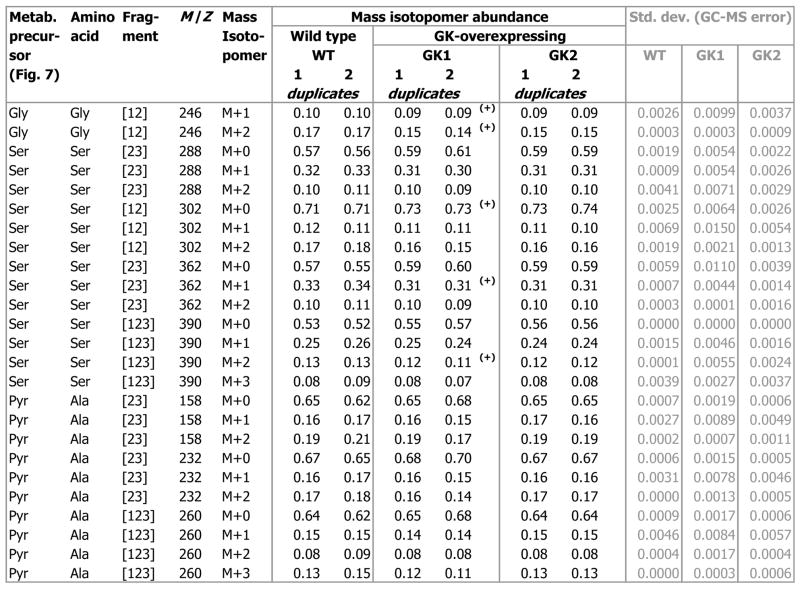
From the isotopomer data collected at 6.8 d and 12.9 d, we calculated the steady state isotopomer abundances (at t = ∞), by using methods published previously [34], and validated that the isotopomer abundances at the end of passage 2 (12.9 d) were 98 ± 2% of their steady state value. Fig. 5 lists the steady-state mass isotopomer abundances of the non-essential amino acids Pro, glutamate and glutamine (Glx), aspartate and asparagine (Asx), glycine (Gly), serine (Ser), and alanine (Ala), at the end of passage 2. The mass isotopomers of amino acid fragments including Gly[12], Ser[12], Ser[23], Ser[123], Asx[12], Asx[234], and Asx[1234], displayed significant differences (4.0 to 6.0 times the biological standard error) between the GK-overexpressing cell lines and the wild type (p < 0.03, Fig. 5).
Fig. 5. Steady state mass isotopomer abundances of proteinogenic amino acid fragments from wild type (WT) and GK-overexpressing (GK1 and GK2) H4IIE cells.
These were determined from measurements of (natural abundance-corrected) mass isotopomer abundances from 13C glucose-grown H4IIE cells harvested on day 6 and day 12 (e.g. Fig. 4). ‘(+)’ denotes significant difference (p < 0.03) between GK1 and the wild type, ‘(*)’ denotes significant difference (p < 0.03) between GK2 and the wild type.
Carbohydrate Metabolism in the GK-Overexpressing Cell Lines is Significantly Different from that in the Wild Type
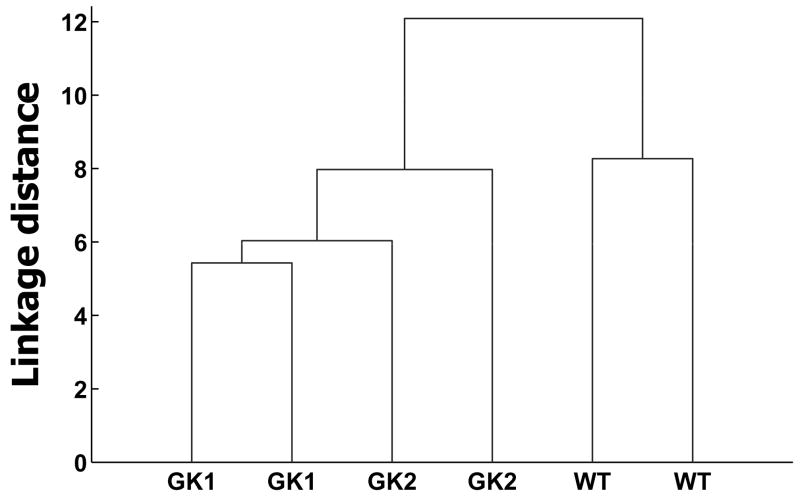
We employed principal component analysis as a metabolic network-independent technique of visualizing differences in carbohydrate metabolism between the cell lines [35]. Unsupervised principal component analysis of the mass isotopomer abundances (listed in Fig. 5) and extracellular fluxes (growth rate, lactate production rate, carbon source consumption rate; Fig. 2) revealed that the three cell lines clustered separately, with the GK-overexpressing cell lines clustering away from the wild type (Fig. 6). Since the mass isotopomer distributions of proteinogenic amino acids contain information on fluxes in central carbon metabolism [36, 37], this result implies that carbohydrate metabolism in the GK-overexpressing cell lines is significantly different from that in the wild type.
Fig. 6. Principal component analysis of proteinogenic amino acid mass isotopomer abundances and extracellular fluxes of wild type (WT) and GK-overexpressing (GK1 and GK2) H4IIE cells.
Hierarchical clustering dendrogram. The two points or lines corresponding to each cell line represent biological replicates.
Oxidative Pentose Phosphate Pathway Flux is Higher in the GK-Overexpressing Cell Lines
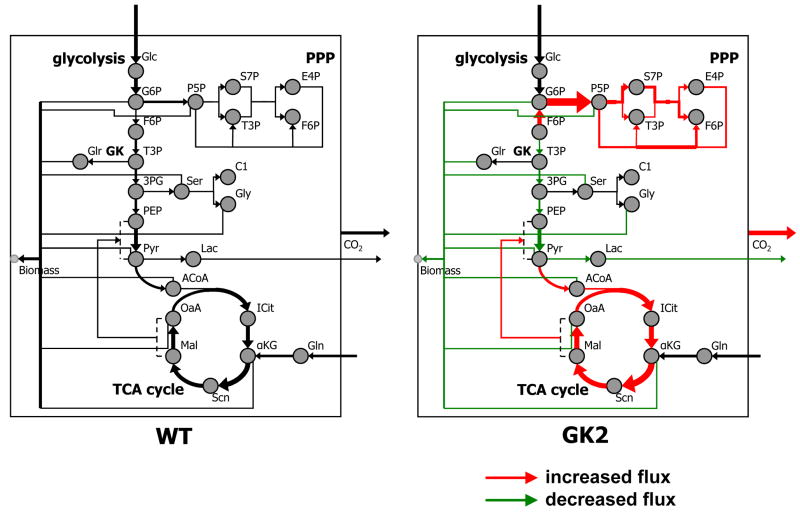
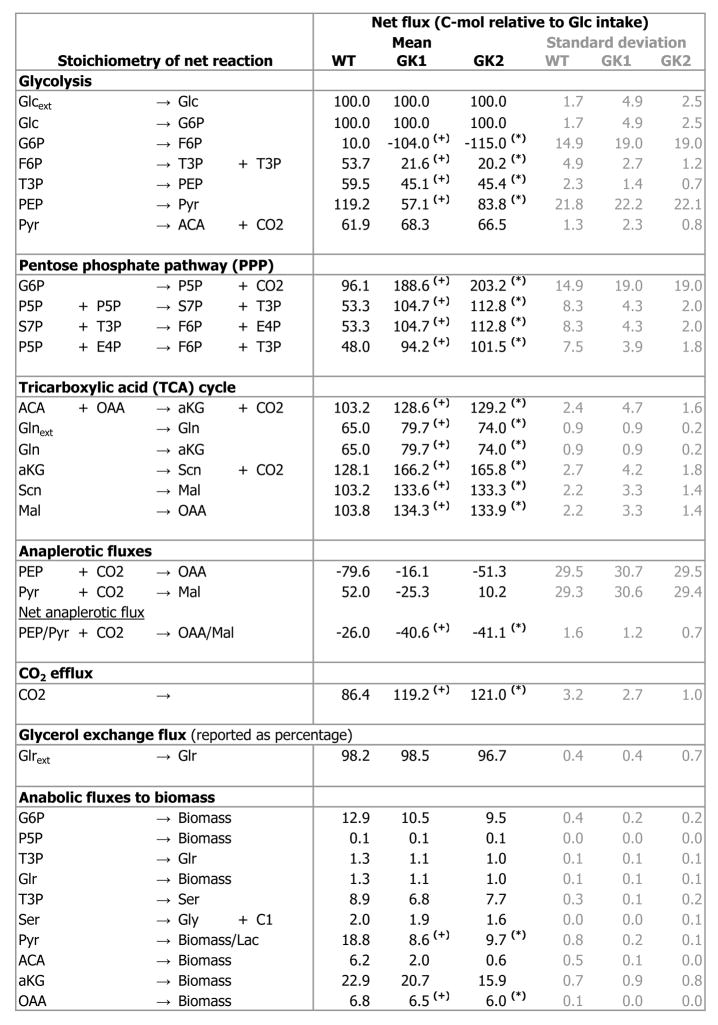
We evaluated metabolic fluxes in the wild type and GK-overexpressing cell lines by a computer-aided tool for systemwide flux evaluation [28] that employs mathematical metabolic network modeling, comprehensive isotopomer balancing, and global optimization. This rigorous flux evaluation enabled the evaluation of fluxes through central carbon metabolism including glycolysis, the PPP, the TCA cycle, anaplerotic pathways, and anabolic fluxes toward biomass (Fig. 7, 8). All net fluxes were identified unequivocally; however, the two individual anaplerotic fluxes (phosphoenolpyruvate, PEP ↔ oxaloacetate, OaA; pyruvate, Pyr ↔ malate, Mal) could not be distinguished, and only a net anaplerotic flux is reported.
Fig. 7. Metabolic flux maps of wild type (WT) and GK-overexpressing cell line GK2, grown on a mixture of U-13C glucose, 1-13C glucose, and naturally abundant glucose.
Line widths are directly proportional to fluxes. Black lines denote intracellular fluxes, and gray lines denote anabolic fluxes contributing to biomass formation. Intracellular metabolites are shown as gray circles. The F6P and T3P pools appear twice (once each in glycolysis and PPP) to avoid excessive intersections of lines. The canonical pathways glycolysis, PPP, and TCA cycle are shown in italics, and the reaction sequence in which GK participates is shown in bold. Some reactions in the pathways are lumped; however the lumping retained the net carbon skeleton rearrangements of the reactions, and therefore did not affect the results. Since individual anaplerotic fluxes were not distinguishable, only the net anaplerotic flux (OaA/Mal → PEP/Pyr) is shown. Triglyceride intake flux, glycerol exchange flux, and acetyl CoA intake/lipogenesis are not shown for clarity. A list of all evaluated net fluxes is available in Fig. 8. Abbreviations: GK, glycerol kinase; PPP, pentose phosphate pathway; TCA, tricarboxylic acid; Glc, glucose; G6P, glucose-6-phosphate; F6P, fructose-6-phosphate; T3P, triose-3-phosphate; P5P, pentose-5-phosphate; S7P, sedoheptulose-7-phosphate; E4P, erythrose-4-phosphate; 3PG, 3-phosphoglycerate; Glr: glycerol; Ser, serine; Gly, glycine; C1: 1-carbon units participating in C-1 metabolism; PEP, phosphoenolpyruvate; Pyr, pyruvate; Lac, lactate; ACoA, acetyl CoA; ICit, isocitrate; αKG, α-ketoglutarate; Gln, glutamine; Scn, succinate; Mal, malate; OaA, oxaloacetate.
Fig. 8. Metabolic fluxes in wild type and GK-overexpressing cell lines GK1 and GK2, grown on a mixture of U-13C glucose, 1-13C glucose, and naturally abundant glucose.
Fluxes are expressed in carbon mol relative to glucose uptake, with the glucose uptake arbitrarily set to 100 carbon mol. Fluxes are normalized by the number of carbon atoms participating in the reaction, so that the carbon moles at any metabolic node are balanced. This is the numerical equivalent of Fig. 7. Only net metabolic fluxes are listed. However, reaction reversibilities and extents of dilution by carbon sources other than glucose (glutamine, triglycerides) were also considered and determined during flux evaluation. ‘(+)’ denotes significant difference (p < 0.05) between GK1 and the wild type, ‘(*)’ denotes significant difference (p < 0.05) between GK2 and the wild type.
Fluxes through several pathways were altered in the GK-overexpressing cell lines (Figs. 7, 8). The most substantial of these flux alterations was in the PPP. There was increased flux through the PPP in the GK-overexpressing cell lines compared to the wild type (p < 0.05; Figs. 7, 8). The oxidative pentose phosphate pathway (oxPPP) flux in the GK-overexpressing cell lines GK2 (203.2 ± 19.0 Cmol relative to 100 Cmol of glucose intake) and GK1 (188.6 ± 19.0 Cmol per 100 Cmol of glucose intake) was significantly higher than that in the wild type (96.1 ± 14.9 Cmol per 100 Cmol of glucose intake) (p < 0.05; Figs. 7, 8). In addition, subtler but statistically significant flux changes were observed in other metabolic pathways. The net TCA cycle flux from isocitrate (ICit) to α-ketoglutarate (αKG) was significantly higher in the GK-overexpressing cell lines GK2 (129.2 ± 1.6 Cmol per 100 Cmol of glucose intake) and GK1 (128.6 ± 4.7 Cmol per 100 Cmol of glucose intake) than that in the wild type (103.2 ± 2.4 Cmol per 100 Cmol of glucose intake) (p < 0.05; Figs. 7, 8). Flux through the net anaplerotic pathway and the efflux of CO2 were both significantly higher in the GK-overexpressing cell lines compared to the wild type (p < 0.05; Figs. 7, 8), whereas Pyr efflux towards biomass and lactate and OaA efflux toward biomass were both significantly lower in the GK-overexpressing cell lines (p < 0.05; Figs. 7, 8).
G6PDH Activity is Higher in the GK-Overexpressing Cell Lines
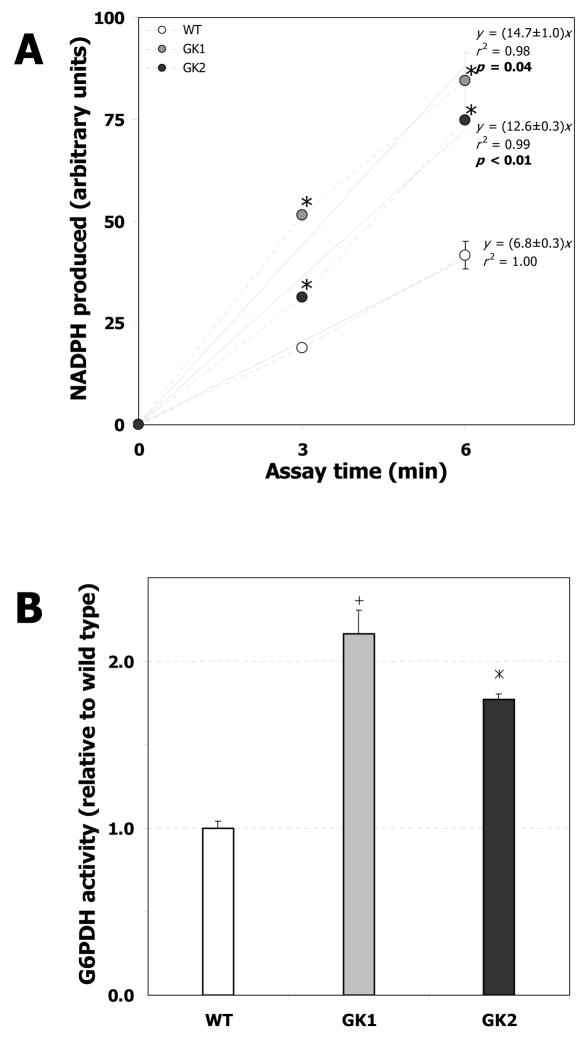
To further investigate the mechanism through which GK overexpression affects the PPP, we quantified the activity of G6PDH, which is the rate-limiting enzyme of the PPP [38], the pathway through which the most substantial flux change (~two-fold) was observed. G6PDH activity was measured by exposing identical amounts of cell protein extracts from the wild type and GK-overexpressing H4IIE cell lines, to G6P and NADPH under assay conditions described previously [21]. The NADPH produced per unit assay time is directly proportional to the G6PDH activity. Clearly, this value is substantially higher for the GK-overexpressing line GK1 (14.7 ± 1.0) or GK2 (12.6 ± 0.3) compared to the wild type (6.8 ± 0.3) (p < 0.05; Fig. 9A). Thus the G6PDH activity of line GK1 (2.16 ± 0.15 times that of the wild type) or GK2 (1.77 ± 0.03 times that of the wild type) was significantly higher than that of the wild type (p < 0.05; Fig. 9B), which substantiates the results of the flux analysis.
Fig. 9. G6PDH enzymatic activity in wild type (WT) and GK-overexpressing H4IIE cell lines (GK1 and GK2).
G6PDH activity was measured from 20 μg protein extracts from the wild type and cell lines GK1 and GK2. A. NADPH produced as a function of assay time; the slopes of the lines are directly proportional to G6PDH activity. Error bars represent standard deviation between biological replicates. ‘+’ denotes significant difference (p < 0.02) between GK1 and WT, ‘*’ denotes significant difference (p < 0.02) between GK2 and the wild type (for individual points [3 and 6 min]). For the trendlines, p values < 0.05 indicate that the slope of the trendline (for the GK-overexpressing cells) is significantly different from the wild type trendline. B. G6PDH activity reported relative to wild type, derived from panel A. Error bars represent standard deviation between biological replicates. ‘+’ denotes significant difference (p < 0.05) between GK1 and the wild type, ‘*’ denotes significant difference (p < 0.05) between GK2 and the wild type.
G6PDH is Transcriptionally Up-Regulated in the GK-Overexpressing Cells
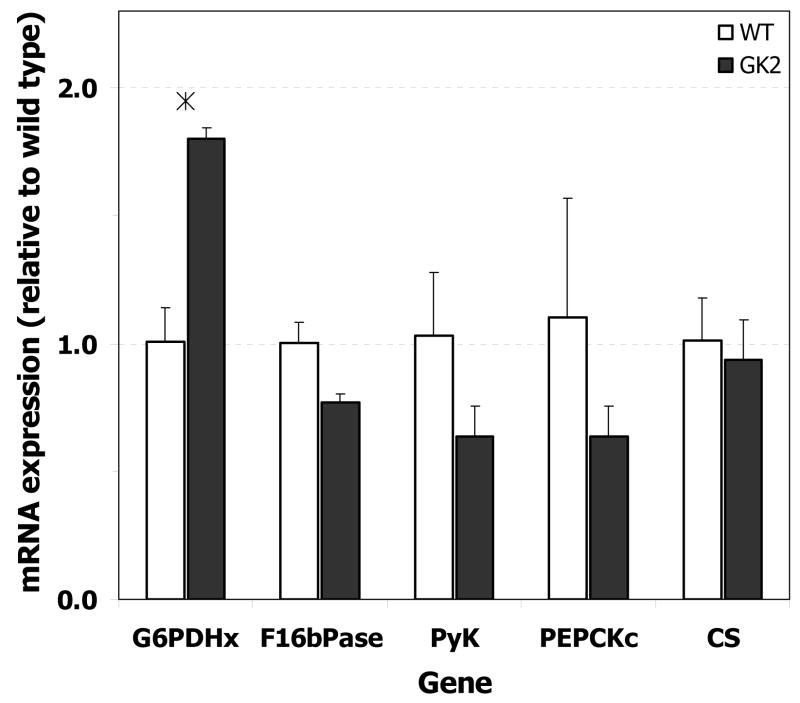
To examine if the observed flux changes (Figs. 7, 8) were the result of transcriptional regulation, we quantified the mRNA expression levels of key genes in the pathways that exhibited altered flux in the GK-overexpressing cell lines. The mRNA expression of G6PDH in the GK-overexpressing line GK2 was 1.80 (± 0.04) times that in the wild type (Fig. 10), indicating that transcriptional regulation of this gene was at least partially responsible for the observed increase in flux through the PPP. The expression of F16bPase (gluconeogenic pathway), PyK (lower glycolysis), PEPCK (anaplerotic pathway), and CS (TCA cycle) in line GK2 were not significantly different from that in the wild type.
Fig. 10. mRNA expression of G6PDH, F16bPase, PyK, PEPCK, and CS in wild type (WT) and GK-overexpressing H4IIE cell line GK2.
A. mRNA levels, quantified by RT-PCR as described in Materials and Methods, are reported relative to wild type. Error bars represent standard deviation between biological replicates. ‘*’ denotes p < 0.05 between GK2 and wild type. Abbreviations: G6PDHx, X-linked glucose-6-phosphate dehydrogenase; F16bPase, fructose-1,6-bisphosphatase; PyK, pyruvate kinase; PEPCK, phosphoenolpyruvate carboxykinase; CS, citrate synthase.
Discussion
Metabolic flux is an important determinant of cell physiology [39, 40] and fluxes collectively represent the phenotype of an organism, so that the systemwide measurement of fluxes can serve as a powerful investigative tool in systems biology. 13C labeling and isotopomer analysis is an effective methodology to quantify fluxes in mammalian metabolic pathways, as evidenced by several research articles and reviews [41–52]. There has been increasing emphasis on comprehensive isotopomer balancing, global optimization, and meticulous selection of a 13C carbon source mixture [28, 30, 33, 36] in the accurate interpretation of 13C labeling data and evaluation of fluxes. In this work, we incorporated these methods toward flux evaluation, to better understand multifunctional enzymes such as GK, and inborn metabolic disorders such as GKD.
We observed that GK-overexpressing H4IIE cell lines exhibited higher consumption of carbon sources per cell. To investigate which metabolic pathways contributed to this excess carbon expenditure, we performed a 13C labeling based comprehensive flux analysis after culturing the cell lines on a computationally designed 13C glucose mixture to steady state. This flux analysis revealed that the flux through the PPP in the GK-overexpressing cell lines was approximately two-fold higher than that in the wild type. This result explains the higher carbon expenditure observed in the GK-overexpressing cells, as a sixth of the carbon that is shunted through the PPP is lost as CO2. The alteration in PPP flux was also accompanied by subtler, although significant, changes in flux through other pathways. Interestingly, however, the glycerol exchange flux (partially indicative of flux through GK) was the same in the wild type and GK-overexpressing cell lines. Given that the GK-overexpressing cell lines had demonstrable increases in GK mRNA levels that were considerably higher than the increases in GK activity (as determined by glycerol phosphorylation), the observed flux alterations in carbohydrate metabolism are likely due to GK’s moonlighting activities.
We have thus shown that alteration of GK expression impacts carbon trafficking in rat liver cells. In a previous study [2], we found that GK knockout mice differ from wild type mice in the hepatic expression of over 100 genes in several functional categories. Furthermore, GK deletion is lethal to mice [2]. Together, these studies strengthen our hypothesis that GK may have systemwide biochemical and regulatory effects, and that metabolic flux and systems dynamics could explain complex single-gene disorders such as GKD [16].
We corroborated the most substantial flux alteration (that in the PPP) in the GK-overexpressing cell lines by measuring the enzymatic activity of G6PDH, which is known to be the rate-limiting enzyme of the PPP [53]. The G6PDH activity of the GK-overexpressing cell lines was approximately two-fold that of the wild type. Furthermore, we measured the expression of several genes in one the GK-overexpressing cell lines (GK2) and found that G6PDH expression was 1.8-fold higher than that in the wild type. Therefore, the increased PPP flux in the GK-overexpressing cell lines is due at least in part to transcriptional up-regulation of G6PDH.
This suggests that GK and the PPP may be interconnected through a regulatory network, which could involve peroxisome proliferator activated receptor α (PPARα), sterol regulatory element-binding protein (SREBP) 1c, and SREBP 2. PPARs are transcription factors of the nuclear receptor superfamily, and regulate gene expression of various genes (including GK) in response to fatty acids [54, 55]. Our previous study [2] showed, by using transcriptome profiling and network component analysis [56], that GK deletion affects the transcription factor activity of PPARα, SREBP1c, and SREBP2 in mouse liver. Further, a PathwayAssist analysis revealed that GK is closely linked to PPARα and SREBPs [2]. Recent studies have shown that G6PDH is a target gene for both PPARα, SREBP1c, and SREBP2 in liver [50, 57–59]. Together, these data indicate that it is likely that GK mediates the PPP through its network partners PPARα, SREBP1c, and SREBP2.
The oxPPP is the principal source for cytosolic NADPH in the liver [60], and its activity correlates linearly with the NADPH/NADP+ ratio in rat liver [61]. The higher oxPPP flux in the GK-overexpressing cell lines therefore suggests that GK overexpression causes a higher cytosolic NADPH demand. There are at least two explanations for this. First, cytosolic NADPH is utilized in the liver by anabolic pathways such as lipid and protein synthesis. As GK catalyzes the reaction at the intersection of lipid and carbohydrate metabolism, it is reasonable to expect a higher demand for cytosolic NADPH from the lipid-synthesizing pathways in the GK-overexpressing cell lines. Second, cytosolic NADPH provided by the oxPPP is also required for the regulation of 11β-hydroxysteroid dehydrogenase type 1, which catalyzes the conversion of biologically inactive 11 keto derivatives to active glucocorticoids in liver, fat, and other tissues [62, 63]. GK overexpression may be closely linked to glucocorticoid activity, since GK also functions as ASTP by enhancing the nuclear binding of the activated glucocorticoid-receptor complex [4, 64], which regulates the transcription of several genes. This leads to the interesting hypothesis that the enhanced oxPPP in the GK-overexpressing cell lines may contribute toward activating glucocorticoids and therefore toward the ASTP activity of GK. Finally, the hepatic levels of GSH, the principal intracellular antioxidant in the mammalian liver, are mainly dependent on NADPH generation by the oxPPP [60]. However, whether this has a connection with GK requires further investigation.
In conclusion, we have used 13C labeling, mass isotopomer analysis and network-wide flux evaluation to demonstrate that GK overexpression in H4IIE rat hepatoma cells results in a significant reorganization of carbohydrate metabolism. The most substantial flux alteration (that through the PPP) was also supported by increases in the activity and mRNA expression of the rate-limiting enzyme of the PPP. This study therefore illustrates the complex role of GK in liver metabolism, and reinforces the hypothesis [16] that metabolic flux and systems dynamics could explain the complexity of inherited single-gene disorders such as GKD. In particular, GK overexpression substantially increased the oxPPP flux, which could be mediated by GK or its network partners such as PPARs. The higher oxPPP flux also suggests higher NADPH demand in the GK-overexpressing cell lines, possibly due to increased lipid synthesis or ASTP activity of GK. Ongoing studies in our laboratory, including the examination of flux effects of GK on lipid metabolic pathways, and transcriptome profiling, will lead to a better understanding of the biochemical and regulatory role of GK and give insight into the pathology of GKD. Our work demonstrates the ability of flux quantification to provide insight on the study of multifunctional enzymes and IEM, and this methodology can also be applied to investigations of other disorders.
Supplementary Material
Acknowledgments
This work was supported by National Institute of Health grants K08DK60055 (KMD) and R01GM 67929 (KMD), and R33DK076328 (JCL).
Footnotes
The abbreviations used are: GK, glycerol kinase; ASTP, ATP-stimulated translocation protein; GKD, glycerol kinase deficiency; IEM, inborn error(s) of metabolism; PPP, pentose phosphate pathway; G6PDH, glucose-6-phosphate dehydrogenase; MEM, minimal essential medium; F16bPase, fructose-1,6-bisphosphatase; PyK, pyruvate kinase; PEPCK, phosphoenolpyruvate carboxykinase; CS, citrate synthase; RT-PCR, real time PCR; DMEM, Dulbecco’s modified Eagle medium; tBDMS, tert-butyldimethylsilyl; GC, gas chromatography; MS, mass spectrometer/mass spectrometry; SIM, selected ion monitoring; TCA, tricarboxylic acid; Pro, proline; Glx, glutamate and glutamine; Asx, aspartate and asparagine; Gly, glycine; Ser, serine; Ala, alanine; PEP, phosphoenolpyruvate; OaA, oxaloacetate; Pyr, pyruvate; Mal, malate; oxPPP, oxidative pentose phosphate pathway; Cmol, carbon mol; F6P, fructose-6-phosphate; G6P, glucose-6-phosphate; ICit, isocitrate; αKG, α-ketoglutarate; PPAR, peroxisome proliferator activated receptor; SREBP, sterol receptor element binding protein; T3P, triose-3-phosphate; P5P, pentose-5-phosphate; S7P, sedoheptulose-7-phosphate; E4P, erythrose-4-phosphate; 3PG, 3-phosphoglycerate; Glr: glycerol; C1: 1-carbon units participating in C-1 metabolism; Lac, lactate; ACoA, acetyl CoA; Scn, succinate.
Publisher's Disclaimer: This is a PDF file of an unedited manuscript that has been accepted for publication. As a service to our customers we are providing this early version of the manuscript. The manuscript will undergo copyediting, typesetting, and review of the resulting proof before it is published in its final citable form. Please note that during the production process errors may be discovered which could affect the content, and all legal disclaimers that apply to the journal pertain.
References
- 1.Dipple KM, Zhang YH, Huang BL, McCabe LL, Dallongeville J, Inokuchi T, Kimura M, Marx HJ, Roederer GO, Shih V, et al. Glycerol kinase deficiency: evidence for complexity in a single gene disorder. Hum Genet. 2001;109:55–62. doi: 10.1007/s004390100545. [DOI] [PubMed] [Google Scholar]
- 2.Maclennan NK, Rahib L, Shin C, Fang Z, Horvath S, Dean J, Liao JC, McCabe ER, Dipple KM. Targeted disruption of glycerol kinase gene in mice: expression analysis in liver shows alterations in network partners related to glycerol kinase activity. Hum Mol Genet. 2006;15:405–415. doi: 10.1093/hmg/ddi457. [DOI] [PubMed] [Google Scholar]
- 3.Sriram G, Martinez JA, McCabe ERB, Liao JC, Dipple KM. Single-gene disorders: What role could moonlighting enzymes play? Am J Hum Genet. 2005;76:911–924. doi: 10.1086/430799. [DOI] [PMC free article] [PubMed] [Google Scholar]
- 4.Okamoto K, Isohashi F, Horiuchi M, Sakamoto Y. An ATP-stimulated factor that enhances the nuclear binding of “activated” receptor-glucocorticoid complex. Biochem Biophys Res Commun. 1984;121:940–945. doi: 10.1016/0006-291x(84)90767-8. [DOI] [PubMed] [Google Scholar]
- 5.Okamoto K, Isohashi F, Ueda K, Sakamoto Y. Properties of an adenosine triphosphate-stimulated factor that enhances the nuclear binding of activated glucocorticoid-receptor complex: binding to histone-agarose. Endocrinology. 1989;124:675–680. doi: 10.1210/endo-124-2-675. [DOI] [PubMed] [Google Scholar]
- 6.Ostlund AK, Gohring U, Krause J, Brdiczka D. The binding of glycerol kinase to the outer membrane of rat liver mitochondria: its importance in metabolic regulation. Biochem Med. 1983;30:231–245. doi: 10.1016/0006-2944(83)90089-3. [DOI] [PubMed] [Google Scholar]
- 7.Martinez JA, McCabe ER. Apoptosis in glycerol kinase deficiency: Investigations in Drosophila melangaster; American Society of Human Genetics Annual Meeting; Toronto. 2004. p. 32. [Google Scholar]
- 8.Agosto JAM, McCabe ERB. Conserved family of glycerol kinase loci in Drosophila melanogaster. Molecular Genetics and Metabolism. 2006;88:334–345. doi: 10.1016/j.ymgme.2006.01.002. [DOI] [PMC free article] [PubMed] [Google Scholar]
- 9.Lee DH, Park DB, Lee YK, An CS, Oh YS, Kang JS, Kang SH, Chung MY. The effects of thiazolidinedione treatment on the regulations of aquaglyceroporins and glycerol kinase in OLETF rats. Metabolism. 2005;54:1282–1289. doi: 10.1016/j.metabol.2005.04.015. [DOI] [PubMed] [Google Scholar]
- 10.Guan HP, Li Y, Jensen MV, Newgard CB, Steppan CM, Lazar MA. A futile metabolic cycle activated in adipocytes by antidiabetic agents. Nat Med. 2002;8:1122–1128. doi: 10.1038/nm780. [DOI] [PubMed] [Google Scholar]
- 11.Tordjman J, Chauvet G, Quette J, Beale EG, Forest C, Antoine B. Thiazolidinediones block fatty acid release by inducing glyceroneogenesis in fat cells. J Biol Chem. 2003;278:18785–18790. doi: 10.1074/jbc.M206999200. [DOI] [PubMed] [Google Scholar]
- 12.Sargent CA, Kidd A, Moore S, Dean J, Besley GT, Affara NA. Five cases of isolated glycerol kinase deficiency, including two families: failure to find genotype:phenotype correlation. J Med Genet. 2000;37:434–441. doi: 10.1136/jmg.37.6.434. [DOI] [PMC free article] [PubMed] [Google Scholar]
- 13.Blomquist HK, Dahl N, Gustafsson L, Hellerud C, Holme E, Holmgren G, Matsson L, von Zweigbergk M. Glycerol kinase deficiency in two brothers with and without clinical manifestations. Clin Genet. 1996;50:375–379. doi: 10.1111/j.1399-0004.1996.tb02391.x. [DOI] [PubMed] [Google Scholar]
- 14.Dipple KM, McCabe ER. Phenotypes of patients with “simple” Mendelian disorders are complex traits: thresholds, modifiers, and systems dynamics. Am J Hum Genet. 2000;66:1729–1735. doi: 10.1086/302938. [DOI] [PMC free article] [PubMed] [Google Scholar]
- 15.Dipple KM, McCabe ER. Modifier genes convert “simple” Mendelian disorders to complex traits. Mol Genet Metab. 2000;71:43–50. doi: 10.1006/mgme.2000.3052. [DOI] [PubMed] [Google Scholar]
- 16.Dipple KM, Phelan JK, McCabe ER. Consequences of complexity within biological networks: robustness and health, or vulnerability and disease. Mol Genet Metab. 2001;74:45–50. doi: 10.1006/mgme.2001.3227. [DOI] [PubMed] [Google Scholar]
- 17.Lanpher B, Brunetti-Pierri N, Lee B. Inborn errors of metabolism: the flux from Mendelian to complex diseases. Nat Rev Genet. 2006;7:449–460. doi: 10.1038/nrg1880. [DOI] [PubMed] [Google Scholar]
- 18.Rahib L, MacLennan NK, Horvath S, Liao JC, Dipple KM. Glycerol kinase deficiency alters expression of genes involved in lipid metabolism, carbohydrate metabolism, and insulin signaling. Eur J Hum Genet. 2006 doi: 10.1038/sj.ejhg.5201801. (In press) [DOI] [PubMed] [Google Scholar]
- 19.Livak KJ, Schmittgen TD. Analysis of relative gene expression data using real-time quantitative PCR and the 2−ΔΔCT method. Methods. 2001;25:402–408. doi: 10.1006/meth.2001.1262. [DOI] [PubMed] [Google Scholar]
- 20.McCabe ER, Fennessey PV, Guggenheim MA, Miles BS, Bullen WW, Sceats DJ, Goodman SI. Human glycerol kinase deficiency with hyperglycerolemia and glyceroluria. Biochem Biophys Res Commun. 1977;78:1327–1333. doi: 10.1016/0006-291x(77)91437-1. [DOI] [PubMed] [Google Scholar]
- 21.Graeve K, von Schaewen A, Scheibe R. Purification, characterization, and cDNA sequence of glucose-6-phosphate dehydrogenase from potato. Plant J. 1994;5:353–361. doi: 10.1111/j.1365-313x.1994.00353.x. [DOI] [PubMed] [Google Scholar]
- 22.Wolfrom C. Evidence for deterministic chaos in aperiodic oscillations of proliferative activity in long-term cultured Fao hepatoma cells. 2000 doi: 10.1242/jcs.113.6.1069. [DOI] [PubMed] [Google Scholar]
- 23.Klapa MI, Aon JC, Stephanopoulos G. Ion-trap mass spectrometry used in combination with gas chromatography for high-resolution metabolic flux determination. Biotechniques. 2003;34:832–836. 838–840 . doi: 10.2144/03344pt02. passim. [DOI] [PubMed] [Google Scholar]
- 24.Warskulat U, Wettstein M, Haussinger D. Osmoregulated taurine transport in H4IIE hepatoma cells and perfused rat liver. Biochem J. 1997;321:683–690. doi: 10.1042/bj3210683. [DOI] [PMC free article] [PubMed] [Google Scholar]
- 25.Leander P, Mansson S, Pettersson G. Glycogen content in rat liver. Importance for CT and MR imaging. Acta Radiol. 2000;41:92–96. [PubMed] [Google Scholar]
- 26.Aranda A, Montoya E, Herrera E. Effects of hypo- and hyper-thyroidism on liver composition, blood glucose, ketone bodies and insulin in the male rat. Biochem J. 1972;128:597–604. doi: 10.1042/bj1280597. [DOI] [PMC free article] [PubMed] [Google Scholar]
- 27.Dickerson RN, Karwoski CB. Endotoxin-mediated hepatic lipid accumulation during parenteral nutrition in rats. J Am Coll Nutr. 2002;21:351–356. doi: 10.1080/07315724.2002.10719234. [DOI] [PubMed] [Google Scholar]
- 28.Sriram G, Fulton DB, Iyer VV, Peterson JM, Zhou R, Westgate ME, Spalding MH, Shanks JV. Quantification of compartmented metabolic fluxes in developing soybean embryos by employing biosynthetically directed fractional 13C labeling, two-dimensional [13C, 1H] nuclear magnetic resonance, and comprehensive isotopomer balancing. Plant Physiol. 2004;136:3043–3057. doi: 10.1104/pp.104.050625. [DOI] [PMC free article] [PubMed] [Google Scholar]
- 29.Sriram G, Shanks JV. Improvements in metabolic flux analysis using carbon bond labeling experiments: bondomer balancing and Boolean function mapping. Metab Eng. 2004;6:116–132. doi: 10.1016/j.ymben.2004.02.003. [DOI] [PubMed] [Google Scholar]
- 30.Wiechert W, Möllney M, Isermann N, Wurzel M, de Graaf AA. Bidirectional reaction steps in metabolic networks: III. Explicit solution and analysis of isotopomer labeling systems. Biotechnol Bioeng. 1999;66:69–85. [PubMed] [Google Scholar]
- 31.Wiechert W, Wurzel M. Metabolic isotopomer labeling systems: Part I: global dynamic behavior. Math Biosci. 2001;169:173. doi: 10.1016/s0025-5564(00)00059-6. [DOI] [PubMed] [Google Scholar]
- 32.Press WH, Teukolsky SA, Wetterling WT, Flannery BP. Numerical Recipes in C: The Art of Scientific Computing. 2. Cambridge, UK: Cambridge University Press; 1992. [Google Scholar]
- 33.Möllney M, Wiechert W, Kownatzki D, de Graaf AA. Bidirectional steps in metabolic networks. IV. Optimal design of isotopomer labeling experiments. Biotech Bioeng. 1999;66:86–103. doi: 10.1002/(sici)1097-0290(1999)66:2<86::aid-bit2>3.0.co;2-a. [DOI] [PubMed] [Google Scholar]
- 34.van Winden W, Schipper D, Verheijen P, Heijnen J. Innovations in generation and analysis of 2D [13C,1H] COSY NMR spectra for metabolic flux analysis purposes. Metab. Eng. 2001;3:322–343. doi: 10.1006/mben.2001.0193. [DOI] [PubMed] [Google Scholar]
- 35.Zamboni N, Sauer U. Model-independent fluxome profiling from 2H and 13C experiments for metabolic variant discrimination. Genome Biol. 2004;5:R99. doi: 10.1186/gb-2004-5-12-r99. [DOI] [PMC free article] [PubMed] [Google Scholar]
- 36.Klapa MI, Aon JC, Stephanopoulos G. Systematic quantification of complex metabolic flux networks using stable isotopes and mass spectrometry. Eur J Biochem. 2003;270:3525–3542. doi: 10.1046/j.1432-1033.2003.03732.x. [DOI] [PubMed] [Google Scholar]
- 37.Wittmann C, Heinzle E. Mass spectrometry for metabolic flux analysis. Biotechnol Bioeng. 1999;62:739–750. doi: 10.1002/(sici)1097-0290(19990320)62:6<739::aid-bit13>3.0.co;2-e. [DOI] [PubMed] [Google Scholar]
- 38.Amir-Ahmady B, Salati LM. Regulation of the Processing of Glucose-6-phosphate Dehydrogenase mRNA by Nutritional Status. Journal of Biological Chemistry. 2001;276:10514–10523. doi: 10.1074/jbc.M010535200. [DOI] [PubMed] [Google Scholar]
- 39.Sauer U. High-throughput phenomics: experimental methods for mapping fluxomes. Curr. Opin. Biotechnol. 2004;15:58–63. doi: 10.1016/j.copbio.2003.11.001. [DOI] [PubMed] [Google Scholar]
- 40.Stephanopoulos G. Metabolic fluxes and metabolic engineering. Metab Eng. 1999;1:1–11. doi: 10.1006/mben.1998.0101. [DOI] [PubMed] [Google Scholar]
- 41.Cline GW, Lepine RL, Papas KK, Kibbey RG, Shulman GI. 13C NMR isotopomer analysis of anaplerotic pathways in INS-1 cells. J Biol Chem. 2004;279:44370–44375. doi: 10.1074/jbc.M311842200. [DOI] [PubMed] [Google Scholar]
- 42.Turner SM, Linfoot PA, Neese RA, Hellerstein MK. Sources of plasma glucose and liver glycogen in fasted ob/ob mice. Acta Diabetol. 2005;42:187–193. doi: 10.1007/s00592-005-0201-3. [DOI] [PubMed] [Google Scholar]
- 43.Tserng KY, Griffin RL. Phosphatidylcholine de novo synthesis and modification are carried out sequentially in HL60 cells: evidence from mass isotopomer distribution analysis. Biochemistry. 2004;43:8125–8135. doi: 10.1021/bi036204k. [DOI] [PubMed] [Google Scholar]
- 44.Hellerstein MK. New stable isotope-mass spectrometric techniques for measuring fluxes through intact metabolic pathways in mammalian systems: introduction of moving pictures into functional genomics and biochemical phenotyping. Metab Eng. 2004;6:85–100. doi: 10.1016/j.ymben.2003.10.005. [DOI] [PubMed] [Google Scholar]
- 45.Burgess SC, Weis B, Jones JG, Smith E, Merritt ME, Margolis D, Dean Sherry A, Malloy CR. Noninvasive evaluation of liver metabolism by 2H and 13C NMR isotopomer analysis of human urine. Anal Biochem. 2003;312:228–234. doi: 10.1016/s0003-2697(02)00465-7. [DOI] [PubMed] [Google Scholar]
- 46.Wong MS, Raab RM, Rigoutsos I, Stephanopoulos GN, Kelleher JK. Metabolic and transcriptional patterns accompanying glutamine depletion and repletion in mouse hepatoma cells: a model for physiological regulatory networks. Physiol Genomics. 2004;16:247–255. doi: 10.1152/physiolgenomics.00088.2003. [DOI] [PubMed] [Google Scholar]
- 47.Kelleher JK. Flux estimation using isotopic tracers: common ground for metabolic physiology and metabolic engineering. Metab Eng. 2001;3:100–110. doi: 10.1006/mben.2001.0185. [DOI] [PubMed] [Google Scholar]
- 48.Yoo H, Stephanopoulos G, Kelleher JK. Quantifying carbon sources for de novo lipogenesis in wild-type and IRS-1 knockout brown adipocytes. J Lipid Res. 2004;45:1324–1332. doi: 10.1194/jlr.M400031-JLR200. [DOI] [PubMed] [Google Scholar]
- 49.Hausler N, Browning J, Merritt M, Storey C, Milde A, Jeffrey FM, Sherry AD, Malloy CR, Burgess SC. Effects of insulin and cytosolic redox state on glucose production pathways in the isolated perfused mouse liver measured by integrated 2H and 13C NMR. Biochem J. 2006;394:465–473. doi: 10.1042/BJ20051174. [DOI] [PMC free article] [PubMed] [Google Scholar]
- 50.Xu J, Chang V, Joseph SB, Trujillo C, Bassilian S, Saad MF, Lee WN, Kurland IJ. Peroxisomal proliferator-activated receptor α deficiency diminishes insulin-responsiveness of gluconeogenic/glycolytic/pentose gene expression and substrate cycle flux. Endocrinology. 2004;145:1087–1095. doi: 10.1210/en.2003-1173. [DOI] [PubMed] [Google Scholar]
- 51.Marin S, Lee WN, Bassilian S, Lim S, Boros LG, Centelles JJ, Fernandez-Novell JM, Guinovart JJ, Cascante M. Dynamic profiling of the glucose metabolic network in fasted rat hepatocytes using [1,2-13C2]glucose. Biochem J. 2004;381:287–294. doi: 10.1042/BJ20031737. [DOI] [PMC free article] [PubMed] [Google Scholar]
- 52.Hellerstein MK, Murphy E. Stable isotope-mass spectrometric measurements of molecular fluxes in vivo: emerging applications in drug development. Curr Opin Mol Ther. 2004;6:249–264. [PubMed] [Google Scholar]
- 53.Kotaka M, Gover S, Vandeputte-Rutten L, Au SW, Lam VM, Adams MJ. Structural studies of glucose-6-phosphate and NADP+ binding to human glucose-6-phosphate dehydrogenase. Acta Crystallogr D Biol Crystallogr. 2005;61:495–504. doi: 10.1107/S0907444905002350. [DOI] [PubMed] [Google Scholar]
- 54.Kersten S, Desvergne B, Wahli W. Roles of PPARs in health and disease. Nature. 2000;405:421–424. doi: 10.1038/35013000. [DOI] [PubMed] [Google Scholar]
- 55.Patsouris D, Mandard S, Voshol PJ, Escher P, Tan NS, Havekes LM, Koenig W, Marz W, Tafuri S, Wahli W, et al. PPARα governs glycerol metabolism. J Clin Invest. 2004;114:94–103. doi: 10.1172/JCI20468. [DOI] [PMC free article] [PubMed] [Google Scholar]
- 56.Liao JC, Boscolo R, Yang YL, Tran LM, Sabatti C, Roychowdhury VP. Network component analysis: reconstruction of regulatory signals in biological systems. Proc Natl Acad Sci U S A. 2003;100:15522–15527. doi: 10.1073/pnas.2136632100. [DOI] [PMC free article] [PubMed] [Google Scholar]
- 57.Horton JD, Goldstein JL, Brown MS. SREBPs: activators of the complete program of cholesterol and fatty acid synthesis in the liver. J Clin Invest. 2002;109:9. doi: 10.1172/JCI15593. [DOI] [PMC free article] [PubMed] [Google Scholar]
- 58.Lee CH, Olson P, Hevener A, Mehl I, Chong LW, Olefsky JM, Gonzalez FJ, Ham J, Kang H, Peters JM, et al. PPARδ regulates glucose metabolism and insulin sensitivity. Proc Natl Acad Sci U S A. 2006;103:3444–3449. doi: 10.1073/pnas.0511253103. [DOI] [PMC free article] [PubMed] [Google Scholar]
- 59.Ono H, Shimano H, Katagiri H, Yahagi N, Sakoda H, Onishi Y, Anai M, Ogihara T, Fujishiro M, Viana AYI. Hepatic Akt Activation Induces Marked Hypoglycemia, Hepatomegaly, and Hypertriglyceridemia With Sterol Regulatory Element Binding Protein Involvement. Am Diabetes Assoc. 2003 doi: 10.2337/diabetes.52.12.2905. [DOI] [PubMed] [Google Scholar]
- 60.Diaz-Flores M, Ibanez-Hernandez MA, Galvan RE, Gutierrez M, Duran-Reyes G, Medina-Navarro R, Pascoe-Lira D, Ortega-Camarillo C, Vilar-Rojas C, Cruz M, et al. Glucose-6-phosphate dehydrogenase activity and NADPH/NADP+ ratio in liver and pancreas are dependent on the severity of hyperglycemia in rat. Life Sci. 2006;78:2061–2067. doi: 10.1016/j.lfs.2005.10.022. [DOI] [PubMed] [Google Scholar]
- 61.Fabregat I, Vitorica J, Satrustegui J, Machado A. The pentose phosphate cycle is regulated by NADPH/NADP ratio in rat liver. Arch Biochem Biophys. 1985;236:110–118. doi: 10.1016/0003-9861(85)90610-1. [DOI] [PubMed] [Google Scholar]
- 62.McCormick KL, Wang X, Mick GJ. Evidence that the 11 β-hydroxysteroid dehydrogenase (11 β-HSD1) is regulated by pentose pathway flux. Studies in rat adipocytes and microsomes. J Biol Chem. 2006;281:341–347. doi: 10.1074/jbc.M506026200. [DOI] [PubMed] [Google Scholar]
- 63.Hewitt KN, Walker EA, Stewart PM. Minireview: hexose-6-phosphate dehydrogenase and redox control of 11β-hydroxysteroid dehydrogenase type 1 activity. Endocrinology. 2005;146:2539–2543. doi: 10.1210/en.2005-0117. [DOI] [PubMed] [Google Scholar]
- 64.Huq AH, Lovell RS, Sampson MJ, Decker WK, Dinulos MB, Disteche CM, Craigen WJ. Isolation, mapping, and functional expression of the mouse X chromosome glycerol kinase gene. Genomics. 1996;36:530–534. doi: 10.1006/geno.1996.0500. [DOI] [PubMed] [Google Scholar]
Associated Data
This section collects any data citations, data availability statements, or supplementary materials included in this article.


