

Abstract
Aim
To determine the human Y-chromosome haplogroup backgrounds of intermediate-sized variant alleles displayed by short tandem repeat (STR) loci DYS392, DYS449, and DYS385, and to evaluate the potential of each intermediate variant to elucidate new phylogenetic substructure within the human Y-chromosome haplogroup tree.
Methods
Molecular characterization of lineages was achieved using a combination of Y-chromosome haplogroup defining binary polymorphisms and up to 37 short tandem repeat loci. DNA sequencing and median-joining network analyses were used to evaluate Y-chromosome lineages displaying intermediate variant alleles.
Results
We show that DYS392.2 occurs on a single haplogroup background, specifically I1*-M253, and likely represents a new phylogenetic subdivision in this European haplogroup. Intermediate variants DYS449.2 and DYS385.2 both occur on multiple haplogroup backgrounds, and when evaluated within specific haplogroup contexts, delineate new phylogenetic substructure, with DYS449.2 being informative within haplogroup A-P97 and DYS385.2 in haplogroups D-M145, E1b1a-M2, and R1b*-M343. Sequence analysis of variant alleles observed within the various haplogroup backgrounds showed that the nature of the intermediate variant differed, confirming the mutations arose independently.
Conclusions
Y-chromosome short tandem repeat intermediate variant alleles, while relatively rare, typically occur on multiple haplogroup backgrounds. This distribution indicates that such mutations arise at a rate generally intermediate to those of binary markers and Y-STR loci. As a result, intermediate-sized Y-STR variants can reveal phylogenetic substructure within the Y-chromosome phylogeny not currently detected by either binary or Y-STR markers alone, but only when such variants are evaluated within a haplogroup context.
The non-recombining portion of the Y-chromosome is particularly useful in modern human evolutionary studies due to its patrilineal inheritance and sensitivity to genetic drift (1,2). Two marker systems widely used in Y-chromosome analysis are single nucleotide polymorphism (SNP) markers and short tandem repeat (STR) loci. SNP markers, due to their low mutation rates, form the basis of a detailed and well developed Y-chromosome phylogeny (3-5). In contrast, the exceptionally high mutation rates of Y-STR markers make them useful for forensic identification (6), genealogical pursuits (7), and evaluating population diversity (8) and temporality (9) in SNP-defined Y-chromosome haplogroups.
Non-consensus Y-STR mutations have been successfully used in previous studies to infer common ancestry among Y-chromosome haplotypes. Examples include large scale deletions (10), unusually short alleles (11,12), and partial deletion/insertion (intermediate variant) alleles (13,14). Such non-conforming alleles show decreased mutagenicity and hence can be informative for indentifying phylogenetic substructure within the binary Y-chromosome gene tree. However, the susceptibility of Y-STR loci to recurrent mutations can also lead to false associations when these mutations are not evaluated in combination with binary markers (14-16).
Among the different types of non-consensus Y-STR mutations, partial insertion/deletion mutations or intermediate-sized variants (17), appear most abundantly in public Y-chromosome databases. While rare overall, their informative frequencies combined with a decreased mutagenicity make them attractive for contributing an additional level of resolution to the Y-chromosome phylogeny. However, the possibility of recurrent mutations, resulting in identical intermediate variant allele sizes produced during quantitative fragment analysis, undermines the reliability of any conclusions based on these loci alone.
Herein, by analyzing on a case by case basis, both haplogroup and sequence contexts we investigate Y-STR intermediate-sized variant alleles potentially useful for adding further levels of resolution to the Y-chromosome haplogroup tree. Candidate alleles were identified from the Sorenson Molecular Genealogy Foundation (SMGF) Y-chromosome database. Intermediate alleles displayed by Y-STR loci DYS392, DYS449, and DYS385 appeared at appreciable frequencies and were subsequently analyzed to determine those sharing common ancestry. These loci are of particular interest because they are included in most public genealogy databases and DYS392 and DYS385 are also included in Y-STR sets used extensively in forensic analyses and evolutionary studies (16). Each variant allele was evaluated for its haplogroup membership to determine mutations potentially representing new branches within the Y-chromosome tree. Sequence analysis was performed on selected samples to determine the precise nature of the intermediate variant mutations.
Materials and methods
Samples were collected by the Sorenson Molecular Genealogy Foundation (SMGF) according to approved informed consent protocols. The SMGF Y-chromosome inventory consists of Y-STR haplotypes of up to 37 loci from over 130 countries (www.smgf.org). Y-STR haplotypes were determined by custom designed amplification panels of multiplexed loci using fluorescent-labeled primers, capillary electrophoresis analyzers with internal size standards, and quantitative fragment analysis software. Conversion of absolute fragment size to a number of allele repeats was achieved using the results obtained from sequencing both strands of control samples independently amplified with unlabeled primers.
Haplogroup membership was achieved by hierarchically genotyping haplogroup-defining binary polymorphisms using Taqman assays, denaturing high pressure liquid chromatography, or direct sequencing for markers M9, M21 (17), P97 (18), M96, M35, M174, M179, M227, M214, M45 (19), M258 (20), M253, M343, M242 (11), M3 (17), M269 (21), U106, U152 (22), M2 (23).
Direct sequencing was conducted on selected samples on loci DYS392, DYS449, and DYS385 to determine the precise motif repeat structure and circumstance within amplified fragments. DYS385A and B alleles were differentially amplified according to published protocols (24). Allele frequency distributions were calculated using the simple direct counting method.
Median-Joining networks (25) were constructed using Network 4.5.1.0 (http://www.fluxus.engineering.com) by processing haplotypes with the reduced-median method followed by the median-joining method (26). Networks for DYS449 and DYS385 were generated without weighting STR loci. Networks for Hg I were constructed with each Y-STR locus weighted proportionally to the inverse of the repeat variance observed within the Hg I data set. For Hg I networks displaying a high degree of reticulation, Y-STR loci showing the highest variances (>0.3) were removed.
Results
The SMGF Y-chromosome database, containing 30 362 haplotypes of up to 37 Y-STR loci from over 130 counties, was screened for partial repeats to reveal 2009 haplotypes carrying intermediate variant alleles. Variants occurred in 22 of the 37 loci examined and were present in loci composed of di-, tri-, tetra-, penta- and hexamer nucleotide repeat motifs. Of the 27 variant types observed, 19 demonstrated frequencies of at least 0.01% (Table 1). The 0.2 variant of locus DYS458 (DYS458.2) was the most frequent intermediate variant in the SMGF database at 1.26%. This variant has been characterized previously and was not studied further (14).
Table 1.
Y-chromosome short tandem repeat (Y-STR) intermediate-sized allele frequencies by locus*
| STR locus | Repeat motif | Sample size | Variant allele† (%) |
|||
|---|---|---|---|---|---|---|
| 0.1 | 0.2 | 0.3 | 0.4 | |||
| DYS385‡ | tetramer | 27330 | 0 | 0.07 | 0 | 0 |
| DYS388 | trimer | 27357 | 0 | 0.01 | 0 | 0 |
| DYS389I | tetramer | 26670 | 0 | 0 | 0 | 0 |
| DYS389B | tetramer | 26123 | 0 | 0 | 0 | 0 |
| DYS390 | tetramer | 27631 | 0 | 0 | 0 | 0 |
| DYS391 | tetramer | 27615 | 0 | 0 | 0 | 0 |
| DYS392 | trimer | 27136 | 0.01 | 0.03 | 0 | 0 |
| DYS393 | tetramer | 27655 | 0 | 0 | 0 | 0 |
| DYS19 | tetramer | 28102 | 0 | 0.01 | 0 | 0 |
| DYS426 | trimer | 27522 | 0 | 0.01 | 0 | 0 |
| DYS437 | tetramer | 27878 | 0.01 | 0 | 0 | 0 |
| DYS438 | pentamer | 27574 | 0 | 0 | 0 | 0 |
| DYS439 | tetramer | 27533 | 0 | 0 | 0 | 0 |
| DYS441 | tetramer | 27101 | 0.04 | 0 | 0.01 | 0 |
| DYS442 | tetramer | 28189 | 0.01 | 0 | 0 | 0 |
| DYS444 | tetramer | 27890 | 0 | 0 | 0.01 | 0 |
| DYS445 | tetramer | 27921 | 0.03 | 0 | 0 | 0 |
| DYS446 | pentamer | 27974 | 0.04 | 0 | 0 | 0 |
| DYS447 | pentamer | 25633 | 0 | 0.01 | 0 | 0.09 |
| DYS448 | hexamer | 27295 | 0 | 0.09 | 0 | 0.02 |
| DYS449 | tetramer | 27587 | 0.01 | 0.1 | 0.01 | 0 |
| DYS452 | pentamer | 26909 | 0 | 0 | 0 | 0 |
| DYS454 | tetramer | 27615 | 0 | 0 | 0.01 | 0 |
| DYS455 | tetramer | 27602 | 0 | 0 | 0 | 0 |
| DYS456 | tetramer | 27936 | 0 | 0 | 0 | 0 |
| DYS458 | tetramer | 27664 | 0.01 | 1.26 | 0 | 0 |
| DYS459‡ | tetramer | 27838 | 0 | 0 | 0 | 0 |
| DYS460 | tetramer | 27112 | 0 | 0 | 0 | 0 |
| DYS461 | tetramer | 27459 | 0 | 0 | 0 | 0 |
| DYS462 | tetramer | 28110 | 0 | 0 | 0 | 0 |
| DYS463 | pentamer | 25617 | 0 | 0 | 0 | 0 |
| DYS464‡ | tetramer | 26789 | 0.03 | 0 | 0.3 | 0 |
| GGAAT1B07 | pentamer | 28104 | 0 | 0 | 0 | 0 |
| YCAII‡ | dimer | 27581 | 0.01 | 0 | 0 | 0 |
| YGATAA10 | tetramer | 28194 | 0 | 0 | 0 | 0 |
| YGATAC4 | tetramer | 28275 | 0 | 0 | 0.04 | 0 |
| YGATAH4 | tetramer | 27663 | 0 | 0 | 0 | 0 |
*Frequencies were compiled from the online Sorenson Molecular Genealogy Foundation (SMGF) Y-chromosome database and are reported in percentages (%). Due to paternally related individuals present in the SMGF database some frequencies may be overestimated.
†Allelic designation follows recommended guidelines (15) in which the number of perfect repeats is followed by the number of base pairs represented in the partial repeat.
‡Multi-copy locus frequencies are normalized according to copy number.
In addition to DYS458.2, several Y-STR intermediate variant alleles displayed high frequencies that remained at informative levels when considering only populations from outside of North America (Table 2). From this set, intermediate variants DYS392.2, DYS449.2, and DYS385.2 were selected for further evaluation. For each variant, paternally unrelated representatives from countries outside of North America were genotyped using binary SNP markers to determine their Y-chromosome haplogroup affiliations.
Table 2.
Y-chromosome short tandem repeat (Y-STR) intermediate-sized allele frequencies by country*
| Population | Number | DYS385.2† | DYS392.2 | DYS441.1 | DYS447.2 | DYS449.2 | DYS464.1† | DYS464.3† |
|---|---|---|---|---|---|---|---|---|
| Africa: | ||||||||
| Cameroon | 1169 | 0.28 | 0 | 0 | 0 | 0.93 | 0 | 0 |
| Ghana | 106 | 0 | 0 | 0 | 0 | 0 | 0 | 0.06 |
| Mali | 450 | 0 | 0 | 0 | 0 | 0 | 0 | 0.18 |
| Nigeria | 209 | 0 | 0 | 0 | 0 | 0.47 | 0 | 0 |
| Togo | 259 | 0 | 0 | 0 | 0 | 0 | 0 | 0 |
| Asia: | ||||||||
| China | 374 | 0 | 0 | 0.25 | 0 | 0 | 0.02 | 0.09 |
| India | 100 | 0 | 0 | 0 | 0 | 0.98 | 0 | 0 |
| Japan | 105 | 0 | 0 | 0 | 0 | 0.92 | 0 | 0.12 |
| Kyrgyzstan | 205 | 0 | 0 | 0.47 | 0 | 0 | 0 | 0.15 |
| Mongolia | 434 | 0 | 0 | 0 | 0 | 0 | 0 | 2.2 |
| Central and South America: | ||||||||
| Bolivia | 77 | 0.63 | 0 | 0 | 0 | 0 | 0 | 0.08 |
| Brazil | 605 | 0.12 | 0 | 0 | 0 | 0.33 | 0.04 | 0.16 |
| Chile | 258 | 0.19 | 0 | 0.39 | 0 | 0 | 0.08 | 0.15 |
| Colombia | 65 | 0 | 0 | 0 | 0 | 0 | 0 | 0.19 |
| Mexico | 972 | 0.13 | 0 | 0.3 | 0 | 0 | 0.07 | 0.19 |
| Peru | 623 | 0.08 | 0 | 0 | 0 | 0 | 0.04 | 0.13 |
| Uruguay | 51 | 0.49 | 0 | 0 | 0 | 0 | 0.13 | 0.26 |
| Europe: | ||||||||
| Austria | 70 | 0 | 0 | 0 | 0 | 0 | 0.29 | 0.38 |
| Denmark | 475 | 0.05 | 0.41 | 0 | 0 | 0 | 0 | 0.36 |
| England | 2707 | 0.07 | 0 | 0 | 0.08 | 0 | 0.04 | 0.23 |
| Finland | 134 | 0 | 0 | 0 | 0 | 0 | 0 | 6.63 |
| France | 134 | 0 | 0 | 0 | 0 | 0 | 0.05 | 0.35 |
| Germany | 1318 | 0 | 0.3 | 0 | 0 | 0.15 | 0.04 | 0.38 |
| Czech Republic | 75 | 0 | 0 | 0 | 0 | 0 | 0 | 1.06 |
| Ireland | 874 | 0.06 | 0 | 0 | 0 | 0 | 0 | 0.06 |
| Hungary | 207 | 0 | 0 | 0 | 0 | 0 | 0.03 | 0.59 |
| Netherlands | 143 | 0 | 0 | 0 | 0 | 0 | 0.09 | 0.23 |
| Norway | 220 | 0 | 0 | 0 | 0 | 0 | 0 | 0.36 |
| Poland | 208 | 0 | 0 | 0 | 0 | 0 | 0.06 | 0.55 |
| Portugal | 79 | 0 | 0 | 0 | 0 | 0 | 0.32 | 0 |
| Russia (Western) | 306 | 0 | 0 | 0 | 0 | 0 | 0.14 | 0.96 |
| Scotland | 552 | 0.09 | 0 | 0.18 | 0 | 0 | 0 | 0.21 |
| Slovenia | 99 | 0 | 0 | 0 | 0 | 0 | 0.19 | 0.25 |
| Spain | 103 | 0 | 0 | 0 | 0 | 0 | 0 | 0.18 |
| Sweden | 407 | 0 | 0 | 0 | 0 | 0.24 | 0.02 | 0.58 |
| Switzerland | 151 | 0 | 0 | 0 | 0 | 0 | 0.31 | 0.27 |
| Wales | 219 | 0.11 | 0 | 0 | 0 | 0.45 | 0 | 0.2 |
| Middle East: | ||||||||
| Jordan | 120 | 0 | 0 | 0 | 0 | 0 | 0 | 0.52 |
| Pakistan | 144 | 0 | 0 | 0 | 0 | 0 | 0 | 0 |
| Palestine | 63 | 0 | 0 | 0 | 0 | 0 | 0 | 0.91 |
| Oceania | ||||||||
| Australia | 66 | 0 | 0 | 0 | 0 | 0 | 0 | 0.19 |
*Frequencies were compiled from the Sorenson Molecular Genealogy Foundation (SMGF) Y-chromosome database and are reported in percentages (%). Due to paternally related individuals present in the SMGF database some frequencies may be overestimates.
†Multi-copy locus frequencies are normalized according to copy number.
The haplogroup memberships of each intermediate variant allele are shown in Table 3. At the level of haplogroup resolution investigated in this study, most variants partition into more than one haplogroup, while only DYS392.2 is limited to a single haplogroup. The distribution of most variant types across multiple Y-haplogroups indicates that parallel partial repeat mutations arose independently on different haplogroup backgrounds.
Table 3.
Haplogroup membership of Y-chromosome short tandem repeat (Y-STR) intermediate-sized alleles
| Haplogroup | Marker(s) | Allele |
||
|---|---|---|---|---|
| DYS385.2 | DYS392.2 | DYS449.2 | ||
| A | P97 | 6 | ||
| D | M174 | 2 | ||
| E1b1a | M2 | 6 | ||
| I1* | M253 | 5 | ||
| K | M9(xM45) | 1 | ||
| M9C | M9C | 1 | 2 | |
| NO | M214 | 1 | ||
| Q1a3a | M3 | 2 | ||
| R1a | M198 | 2 | ||
| R1b* | M343(xM269) | 4 | ||
| R1b1b2 | M269 | 15 | 4 | |
Locus DYS392
The DYS392.2 intermediate variant chromosomes demonstrate several features suggesting this variant delineates new phylogenetic substructure within haplogroup I1*-M253. Each of the DYS392.2 samples displayed the same allele value of DYS392 = 10.2 and occurred on a single haplogroup background (Table 3), with all variant chromosomes having the derived allele for M253 and ancestral alleles at subclades markers M21 and M227 (P259 was not tested). Additionally, DYS392.2 variants occurred within close geographic proximity, descending from Germany (n = 4) and Denmark (n = 1).
Network analysis of 5 DYS392.2 variant and 76 non-variant I1*-M253 haplotypes was conducted to investigate the relationships among these I1* haplotypes. Since Network software does not accept partial repeat STR values, it cannot perfectly reflect the variation in this data set represented by DYS392. Thus, 3 different methods were employed to approximate the relationships among the haplotypes using Network. First, 20-locus haplotypes, not including DYS392, were used to evaluate the haplotype relationships without bias from DYS392. The resulting network placed DYS392.2 variant haplotypes within 3 steps of each other, suggesting they could be of common descent (web Figure 1). Second, 21-locus haplotypes were used that included DYS392 allele values in whole repeat units by substituting a value of DYS392 = 10 for DYS392 = 10.2. While this is a realistic approach because only 3 DYS392 alleles (10.2, 11, and 12) appear in the data set, the weight of DYS392 will likely be underestimated given that partial repeat mutations deviate from the single step mutations model typically followed by Y-STR loci (13). The resulting network more strongly suggests variant alleles share common ancestry by connecting the haplotypes more directly and closer together (web Figure 2). Lastly, network analysis was performed using 21-locus haplotypes where DYS392 was treated as in method 2 but given maximum weighting (9 times greater than the weight in method 2). This approach compensates for underestimating the weight of DYS392 in the previous method, thereby more appropriately reflecting the impact of a non-consensus allele. This method may risk over-weighting the single step DYS392 alleles (DYS392 = 11 and 12), however, this risk should be minimal given that allele 12 is also rare (Figure 1). Similar network results were obtained by considering DYS392 as a binary marker with DYS392.2 alleles assigned to one allelic state and DYS392 perfect repeat alleles assigned to the other (data not shown). The network produced by method 3 shows a distinct branch formed by the DYS392.2 haplotypes within the broader haplogroup I1* structure (Figure 2).
Figure 1.

DYS392 allele frequencies. DYS392 allele frequencies were compiled from the Sorenson Molecular Genealogy Foundation (SMGF) Y-STR database (dark gray) and from a subset of samples belonging to haplogroup I1*-M253 (light gray). SMGF database estimated frequencies may be overstated due to paternally related individuals. Haplogroup I1* frequencies were based on paternally unrelated haplotypes.
Figure 2.
Network of Y-chromosome short tandem repeat (Y-STR) haplotypes belonging to haplogroup I1*-M253. The network was obtained by the analysis of 80 unrelated I1*-M253 haplotypes consisting of 21 Y-STR loci (web Table 1). Circumscribed nodes indicate chromosomes with DYS392 = 10.2 alleles. Loci were weighted proportionally to the inverse of the repeat variance with DYS392 given a maximum weight = 99. Node and sector areas are proportional to the haplotype frequency. Geographic representation is indicated by the following colors: blue – Denmark, green – Germany, orange – Netherlands, yellow – England and Ireland, pink – France, and gray – Eastern Europe (Russia, Slovakia, Czech Republic, and Austria).
Interestingly, the DYS392 allele frequencies within haplogroup I1* differed significantly from those of the overall data set (Figure 1). Of the 80 I1*-M253 samples included in this study, all displayed DYS392 = 11 with the exception of 2 DYS392 = 12 and 5 DYS392 = 10.2 samples. The intermediate frequency of DYS392 = 10.2 could be the result of a founding lineage which later expanded. Direct sequencing of locus DYS392 supports this scenario with all 5 variant chromosomes sharing a T deletion in the 5′ region preceding the repetitive tract. However, given its elevated frequency with respect to allele 12, we cannot rule out the possibility that recurrent mutations to allele DYS392 = 10.2 have occurred within haplogroup I1*.
Locus DYS449
DYS449.2 was detected at a frequency of 0.1% in the overall data set with a broad geographic distribution encompassing Africa, Asia, Europe, and South America. SNP testing of a representative set of samples partitioned the variant into haplogroups A-P97, NO-M214, R1a1-M198, K-M9*, and several subclades of R1b1b2-M269 (web Table 1). This scattering across haplogroups is consistent with this complex locus having hypervariable characteristics in general relative to most other Y-STRs (27). Network analysis of 36-locus haplotypes excluding DYS449 showed only haplogroup A-P97 to contain a tight group of haplotypes indicative of shared ancestry (Figure 3). The 4 members of A-P97 carry variant alleles DYS449 = 32.2 or DYS449 = 33.2 and are from Cameroon.
Figure 3.

Network of Y-chromosome short tandem repeat (Y-STR) haplotypes carrying DYS449.2 alleles. The network was obtained by the analysis of 12 unrelated haplotypes consisting of 36 Y-STR loci not including DYS449 (web Table 2). Though not experimentally determined, both alleles of duplicated loci were included separately (DYS385a/b, DYS459a/b, and YCAIIa/b). All loci were unweighted. Node and sector areas are proportional to the haplotype frequency. Geographic representation is indicated by the following colors: green – Cameroon, blue – Europe (Germany, Italy, and Sweden), purple – Japan, orange – Brazil, and gray – India. Haplogroup labels indicate haplogroup membership of each haplotype.
Sequence analysis was conducted to evaluate the precise nature of the mutations responsible for the DYS449.2 intermediate variants within each haplogroup background. As shown in Table 4, sequences from each haplogroup demonstrated unique mutation events accounting for the variant alleles. Chromosomes representing haplogroups A-P97 and NO-M214 both contain a TT partial repeat insertion but at different locations, specifically in the first TTTC tract for haplogroup A-P97 and in the second TTTC tract for haplogroup NO-M214. In contrast, the mutations in R1a and R1b1b2 representatives are not partial repeat mutations but result from TC deletions outside of the repeat motif, again occurring at different locations for each haplogroup. Taken together, the sequence data confirmed that DYS449.2 variants arose independently on multiple haplogroup backgrounds, however within haplogroup A-P97, DYS499.2 likely elucidates new phylogenetic substructure localized to Cameroon.
Table 4.
Sequence characterization of DYS449.2 alleles in various haplogroup backgrounds
| Sample | Country | Haplogroup | Allele | Sequence | Tract | Repeat* |
|---|---|---|---|---|---|---|
| Control | 29 | tggagtctctcaagcctgttcta...[TTTC]15TCT… TTTC | - | - | ||
| CTTC[TTTC]14TCTCTT...acagcaaactccacttccagg | ||||||
| 2221 | Cameroon | A-P97 | 32.2 | tggagtctctcaagcctgttcta...[TTTC]11TT[TTTC]2TCT… | 1 | 11 |
| TTTCCTTC[TTTC]19TCTCTT...acagcaaactccacttccagg | ||||||
| 2222 | Brazil | M9C | 27.2 | tggagtctctcaagcctgttcta...[TTTC]13TCT… TTTCCT | 2 | 1 |
| TC[TTTC]1TT[TTTC]13TCTCTT...acagcaaactccacttccagg | ||||||
| 2231 | Japan | NO-N214 | 30.2 | tggagtctctcaagcctgttcta...[TTTC]16TCT…TTTCCT | 2 | 11 |
| TC[TTTC]10[TTTTTC][TTTC]3TCTCTT...acagcaaact | ||||||
| ccacttccagg | ||||||
| 2230 | India | R1a-M198 | 32.2 | tggagtctctcaagcctgttcta...[TTTC]16[TCdel]†TCT… | - | - |
| TTTCCTTC[TTTC]17TCTCTT...acagcaaactccacttccagg | ||||||
| 1257 | Italy | R1b1b2-M296 | 28.2 | tggagtctctcaagcctgttcta...[TTTC]15TCT…TTTCCT | - | - |
| TC[TTTC]14TC[TCdel]TT...acagcaaactccacttccagg |
*Bold designates nucleotide content and position where mutation occurs within or immediately following the repeat indicated.
†Precise location of TC deletion is ambiguous due its presence in a poly-TC stretch.
Locus DYS385
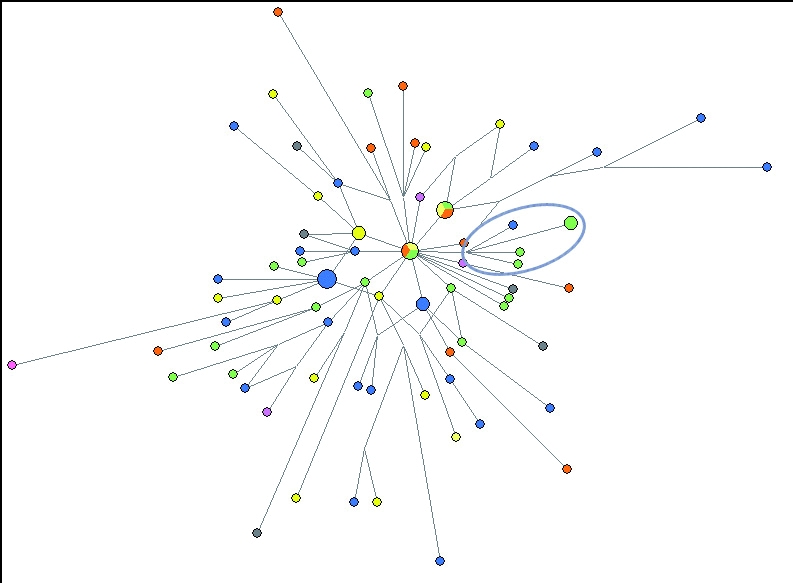
The DYS385.2 variant was detected at a frequency of 0.07% in the overall data set with widespread geographic distribution across Asia, Africa, Europe, and the Americas. SNP testing partitioned DYS385.2 chromosomes into at least 7 haplogroups (web Table 2). Network analysis of DYS385.2 33-locus haplotypes excluding DYS385 revealed several distinct clusters that correlate with diverse haplogroup membership (Figure 4).
Figure 4.
Network of Y-chromosome short tandem repeat (Y-STR) haplotypes carrying DYS385.2 alleles. The network was obtained by the analysis of 30 unrelated haplotypes consisting of 33 Y-STR loci not including DYS385a/b. Though not experimentally determined, both alleles of duplicated loci were included separately (DYS459a/b, and YCAIIa/b). All loci were unweighted. Node and sector areas are proportional to the haplotype frequency. Geographic representation is indicated by the following colors: green – Cameroon, pink – Ivory Coast, blue – Europe (England, Scotland, Ireland, Wales, and Denmark), purple – Philippines and Hawaii, and orange – Americas (Brazil, Chile, Mexico, and Uruguay). Haplogroup labels indicate haplogroup membership of each haplotype.
Figure 4 shows 3 groups of haplotypes with particularly tight clustering, with each cluster likely exposing phylogenetic substructure defined by DYS385.2. Five samples from Cameroon belonging to haplogroup E1b1a-M2 shared a DYS385 = 15.2 allele and formed a compact network cluster. Similarly, 4 samples from Cameroon with membership in haplogroup R1b*-M343 and displaying DYS385 = 13.2 alleles also formed a distinct network group. Chromosomes with DYS385 = 15.2 alleles allocated into a discrete network clustered within haplogroup D-M174 and were also represented in haplogroup Q1a3a-M3 by one haplotype. The 2 members of D-M174 were from Philippines and Hawaii and the member of Q1a3a-M3 was from Mexico.
Nearly half of the DYS385.2 variants were members of haplogroup R1b1b2-M269. This group of haplotypes exhibited the greatest DYS385.2 allelic variation and formed a diffuse network cluster. The geographic distribution of this group was restricted to northwest Europe with the exception of 2 South American samples, which may represent recent European admixture. Despite the narrow geographic distribution, the dispersed network pattern points to independent DYS385.2 mutations arising on multiple R1b1b2-M269 subclade backgrounds. However, it is worth noting that several sub-groupings appeared in the M269 network cluster that seem to correlate with particular DYS385.2 alleles (data not shown), possibly indicating phylogenetically distinct lineages within M269 subclades.
DYS385 is a duplicated Y-STR locus that produces 2 alleles that usually are not experimentally separated, but rather are reported in ascending order according to size (24). To unambiguously determine the DYS385.2 alleles associated with each haplogroup, we directly sequenced a subset of samples using primers that differentially amplify the 2 DYS385 alleles (Table 5). The results showed that the DYS385 = 15.2 alleles found in haplogroups D-M174, E1b1a-M2, and Q1a3a-M3 were independent mutation events. A 2-base pair AA insertion was found in DYS385 fragment-B in D-M145, a 2-base pair AA insertion in the DYS385 fragment-A immediately following the 6th repeat in E1b1a-M2, and a 2-base pair AA insertion in fragment-A following the 7th repeat in Q1a3a-M3. While the mutations in haplogroups E1b1a-M2 and Q1a3a-M3 are similar, the distance of these 2 haplogroups on the Y-chromosome tree reaffirmed they were independent events. Additionally, samples representing various DYS385.2 allelic states within haplogroup R1b1b2-M296 were sequenced. Distinct mutation events were observed for each DYS385.2 allele, providing additional evidence that DYS385.2 variants did not delineate a distinct lineage within M269, but independently arose in M269 subclades, where such variant alleles may share common ancestry.
Table 5.
Sequence characterization of DYS385.2 alleles with differential amplification of DYS385A and B-fragments in various haplogroup backgrounds
| Sample | Country | Haplogroup | Allele | Locus | Sequence | Repeat* |
|---|---|---|---|---|---|---|
| Control | 14 | B | agcatgggtgacagagcta...AGAGGAAAGAGAA | - | ||
| AG...[GAAA]14GAG…gaaaggaggactatgtaattgg | ||||||
| 1858 | Philippines | D-M174 | 15.2 | B | agcatgggtgacagagcta...AGAGGAAAGAGAA | 15 |
| AG...[GAAA]15AAGAG…gaaaggaggactatgtaattgg | ||||||
| 2304 | Cameroon | E-M96 | 15.2 | A | agcatgggtgacagagcta...AGAGGAAAGAGAA | 6 |
| AG...[GAAA]6AA[GAAA]9GAG…gaaaggaggactatgtaattgg | ||||||
| 2288 | Ivory Coast | E1b1a-M2 | 16.2 | B | agcatgggtgacagagcta...AGAGGAAAGAGAA | 16 |
| AG...[GAAA]16AGGAG…gaaaggaggactatgtaattgg | ||||||
| 2279 | Brazil | K-M9(xM45) | 11.2 | A | agcatgggtgacagagcta...AGAGGAAAGAGAA | 4 |
| AG...[GAAA]4AA[GAAA]7GAG…gaaaggaggactatgtaattgg | ||||||
| 2292 | Mexico | Q1a3a-M3 | 15.2 | A | agcatgggtgacagagcta...AGAGGAAAGAGAA | 7 |
| AG...[GAAA]7AA[GAAA]8GAG…gaaaggaggactatgtaattgg | ||||||
| 2311 | Peru | Q1a3a-M3 | 13.2 | A | agcatgggtgacagagcta...AGAGGAAA[GAdel]GAA | - |
| AG...[GAAA]14GAG…gaaaggaggactatgtaattgg | ||||||
| 2296 | Cameroon | R1b*-M343 | 13.2 | B | agcatgggtgacagagcta...AGAGGAAAGAGAA | 2 |
| AG...[GAAA]2AA[GAAA]11GAG…Agaaaggaggactatgtaattgg | ||||||
| 2278 | Uruguay | R1b1b2-M269 | 10.2 | B | agcatgggtgacagagcta...A[GAdel]GGAAAGAGAA | - |
| AG...[GAAA]11GAG…gaaaggaggactatgtaattgg | ||||||
| 2271 | England | R1b1b2-M269 | 13.2 | A | agcatgggtgacagagcta...AGAGGAAAGAGAA | 6 |
| AG...[GAAA]6AA[GAAA]7GAG…gaaaggaggactatgtaattgg | ||||||
| 2313 | Ireland | R1b1b2-M269 | 10.2 | B | agcatgggtgacagagcta...AGAGGAAAGAGAA | 9 |
| AG...[GAAA]9AA[GAAA]1GAG…gaaaggaggactatgtaattgg | ||||||
| 2307 | England | R1b1b2-M269 | 13.2 | A | agcatgggtgacagagcta...AGAGGAAAGAGAA | 14 |
| AG[GAAA]14[GAdel]G…gaaaggaggactatgtaattgg |
*Bold designates nucleotide content and position where mutation occurs within or immediately following the repeat indicated.
The combination of network, haplogroup, and sequence analysis of DYS385.2 alleles occurring as singletons adds further context for interpreting these variants within haplogroups E1b1a-M2 and Q1a3a-M3. The DYS385.2 network (Figure 4) showed a single sample from Ivory Coast, which belongs to haplogroup E1b1a-M2 and displays DYS385 = 16.2, that is distantly connected to the Cameroon E1b1a-M2 cluster. Despite the shared E1b1a membership and close geographic proximity of these samples in western Africa, the distinct DYS385.2 allele values and remote network connection indicated DYS385.2 alleles were found on different M2 subclade backgrounds. While further SNP testing is needed to identify the subclades involved, sequence analysis confirmed that distinct mutations led to the 15.2 allele in samples from Cameroon and the 16.2 allele in the sample from Ivory Coast (Table 5).
A similar situation arose in haplogroup Q1a3a-M3. A sample from Peru belonging to Q1a3a-M3 displayed a unique DYS385 = 13.2 allele, different from the 15.2 allele found in the Mexican chromosome belonging to the same haplogroup. The Peruvian sample was not genotyped at sufficient loci to include in the network, but sequencing confirmed its 13.2 allele originated from an independent mutation, distinct from the 15.2 alleles found in the Mexican Q1a3a-M3 sample. Thus, DYS385.2 alleles 13.2 and 15.2 are potentially informative within separate Q1a3a-M3 subclades (Table 5).
Discussion
In recent years, publicly accessible online databases consisting of Y-STR haplotypes have grown large enough to detect rare alleles that are potentially informative for better understanding diversity within the Y-chromosome gene pool. One such class of alleles includes partial repeat variants that occur at low but informative frequencies in Y-STR databases. Our data showed that evaluating these variant alleles in combination with haplogroup-defining markers exposed new phylogenetic substructure within the Y-chromosome haplogroup tree.
We showed that the intermediate variant allele DYS392 = 10.2 arose on a single haplogroup background and likely defines a sublineage within haplogroup I1*-M253. Consistent with previously reported I1* distributions (20,28), DYS392.2 samples descended from Germany (n = 4) and Denmark (n = 1). Since the sample from Denmark could have descended from either Viking or Saxon groups, it is conceivable that DYS392 = 10.2 is a signal of Anglo-Saxon ancestry, potentially useful for exploring the matter of Anglo-Saxon migration from Friesland to England (29), although more extensive surveys of Norway, Friesland, and Central England would be needed.
Unlike DYS392.2, the variants DYS449.2 and DYS385.2 partitioned across multiple haplogroup backgrounds and sequence analysis confirmed independent origins for each. The broad spread of these variants across the binary Y-chromosome phylogeny underscores the high variability of these loci even when non-consensus mutations are involved. However, when combined with binary markers we showed that both DYS449.2 and DYS385.2 defined coherent branches within the Y-haplogroup tree.
DYS449.2 alleles, specifically 32.2 and 33.2, defined a lineage within haplogroup A-P97 geographically restricted to Cameroon. However, the 32.2 allele was also observed in haplogroup R, thus necessitating that both STR and SNP markers be assessed for accurate lineage assignment.
Similarly, DYS385 = 15.2 alleles form subgroups within haplogroups D-M174, Q1a3a-M3 (represented by only one sample), and E1b1a-M2, each variant possibly originating in Japan, Mexico, and Cameroon, respectively. Direct sequencing of the duplicated DYS385A and B-fragments showed allele 15.2 present in fragment-A for haplogroups E1b1a-M2 and Q1a3a-M3, and fragment-B for D-M174. Additionally, DYS385B = 16.2 and DYS385A = 13.2, observed as singletons within E1b1a-M2 and Q1a3a-M3, respectively, may represent new structure within different subclades as opposed to allele 15.2 in haplogroups E and Q. The very restricted geographic boundaries associated with these variant alleles suggest they may prove informative for regional studies within western African and Native American populations. Further haplogroup resolution would increase our understanding concerning the history of the various lineages displaying unusual DYS385.2 alleles.
DYS385.2 alleles appeared most frequently within haplogroup R (the most common haplogroup in the SMGF database). Allele 13.2 appeared in haplogroup R1b*-M343 and was localized to Cameroon, consistent with previous findings which linked its presence to potentially non-Bantu expansions in Central Africa (30). Our data showed this mutation actually arose in the DYS385 B-fragment rather than the A-fragment; the allele in which this mutation is typically reported using standard quantitative fragment sizing genotyping methods. Importantly, we also found the 13.2 allele present in haplogroup R1b1b2-M269, demonstrating recurrent mutations within haplogroup R1b. Furthermore, sequence analysis showed that at least 2 independent mutation events had led to the 13.2 alleles within haplogroup R1b1b2-M269. Network analysis indicated the 13.2 allele might occur within up to 3 separate M269 subclades. These data clearly demonstrate that intermediate variant mutations, often considered as rare or even unique events, recur within closely related haplogroup lineages. Additionally, DYS385.2 alleles 10.2 and 15.2 were also found in haplogroup R1b1b2-M269, presumably in multiple M269 subclades. Network and sequence analysis again suggested that both the 10.2 and 15.2 variants might elucidate further phylogenetic substructure within M269 subgroups, but higher resolution SNP tests are needed to define the specific nature of this substructure.
This study shows that partial repeat polymorphisms within Y-STR loci are a useful tool for adding phylogenetic resolution to the Y-chromosome haplogroup tree. Such fine-scale substructure is particularly useful for evaluating regional Y-chromosome variation or migrations occurring during the recent historical past. We show partial repeat mutations, while relatively rare, typically arise independently on multiple SNP-defined haplogroup backgrounds. Thus, intermediate variant alleles likely occur at a rate intermediate to those of binary markers and Y-STR perfect repeats. Thus, intermediate variants can reveal phylogenetic substructure that is not currently detectable by either Y-SNP or Y-STR testing alone, in cases where both marker systems are used to eliminate false associations caused by recurrent mutations.
Acknowledgments
We thank all the men who donated DNA samples used in this study. We also acknowledge the SMGF genealogy staff for their review of the genealogical records of the study participants.
References
- 1.Jobling MA, Tyler-Smith C. The human Y chromosome: an evolutionary marker comes of age. Nat Rev Genet. 2003;4:598–612. doi: 10.1038/nrg1124. [DOI] [PubMed] [Google Scholar]
- 2.Underhill PA, Kivisild T. Use of y chromosome and mitochondrial DNA population structure in tracing human migrations. Annu Rev Genet. 2007;41:539–64. doi: 10.1146/annurev.genet.41.110306.130407. [DOI] [PubMed] [Google Scholar]
- 3.Underhill PA, Shen P, Lin AA, Jin L, Passarino G, Yang WH, et al. Y chromosome sequence variation and the history of human populations. Nat Genet. 2000;26:358–61. doi: 10.1038/81685. [DOI] [PubMed] [Google Scholar]
- 4.Y Chromosome Consortium A nomenclature system for the tree of human Y-chromosomal binary haplogroups. Genome Res. 2002;12:339–48. doi: 10.1101/gr.217602. [DOI] [PMC free article] [PubMed] [Google Scholar]
- 5.Karafet TM, Mendez FL, Meilerman MB, Underhill PA, Zegura SL, Hammer MF. New binary polymorphisms reshape and increase resolution of the human Y chromosomal haplogroup tree. Genome Res. 2008;18:830–8. doi: 10.1101/gr.7172008. [DOI] [PMC free article] [PubMed] [Google Scholar]
- 6.Kwak KD, Jin HJ, Shin DJ, Kim JM, Roewer L, Krawczak M, et al. Y-chromosomal STR haplotypes and their applications to forensic and population studies in east Asia. Int J Legal Med. 2005;119:195–201. doi: 10.1007/s00414-004-0518-4. [DOI] [PubMed] [Google Scholar]
- 7.Moore LT, McEvoy B, Cape E, Simms K, Bradley DG. A Y-chromosome signature of hegemony in Gaelic Ireland. Am J Hum Genet. 2006;78:334–8. doi: 10.1086/500055. [DOI] [PMC free article] [PubMed] [Google Scholar]
- 8.Zhivotovsky LA, Underhill PA, Cinnioglu C, Kayser M, Morar B, Kivisild T, et al. The effective mutation rate at Y chromosome short tandem repeats, with application to human population-divergence time. Am J Hum Genet. 2004;74:50–61. doi: 10.1086/380911. [DOI] [PMC free article] [PubMed] [Google Scholar]
- 9.Roewer L, Croucher PJ, Willuweit S, Lu TT, Kayser M, Lessig R, et al. Signature of recent historical events in the European Y-chromosomal STR haplotype distribution. Hum Genet. 2005;116:279–91. doi: 10.1007/s00439-004-1201-z. [DOI] [PubMed] [Google Scholar]
- 10.Chang YM, Perumal R, Keat PY, Yong RY, Kuehn DL, Burgoyne L. A distinct Y-STR haplotype for Amelogenin negative males characterized by a large Y(p)11.2 (DYS458-MSY1-AMEL-Y) deletion. Forensic Sci Int. 2007;166:115–20. doi: 10.1016/j.forsciint.2006.04.013. [DOI] [PubMed] [Google Scholar]
- 11.Cinnioglu C, King R, Kivisild T, Kalfoglu E, Atasoy S, Cavalleri GL, et al. Excavating Y-chromosome haplotype strata in Anatolia. Hum Genet. 2004;114:127–48. doi: 10.1007/s00439-003-1031-4. [DOI] [PubMed] [Google Scholar]
- 12.Kayser M, Brauer S, Weiss G, Schiefenhovel W, Underhill PA, Stoneking M. Independent histories of human Y chromosomes from Melanesia and Australia. Am J Hum Genet. 2001;68:173–90. doi: 10.1086/316949. [DOI] [PMC free article] [PubMed] [Google Scholar]
- 13.Frigi S, Pereira F, Pereira L, Yacoubi B, Gusmao L, Alves C, et al. Data for Y-chromosome haplotypes defined by 17 STRs (AmpFLSTR Yfiler) in two Tunisian Berber communities. Forensic Sci Int. 2006;160:80–3. doi: 10.1016/j.forsciint.2005.05.007. [DOI] [PubMed] [Google Scholar]
- 14.Myres NM, Ekins JE, Lin AA, Cavalli-Sforza LL, Woodward SR, Underhill PA. Y-chromosome short tandem repeat DYS458.2 non-consensus alleles occur independently in both binary haplogroups J1-M267 and R1b3-M405. Croat Med J. 2007;48:450–9. [PMC free article] [PubMed] [Google Scholar]
- 15.Gusmao L, Butler JM, Carracedo A, Gill P, Kayser M, Mayr WR, et al. DNA Commission of the International Society of Forensic Genetics (ISFG): an update of the recommendations on the use of Y-STRs in forensic analysis. Forensic Sci Int. 2006;157:187–97. doi: 10.1016/j.forsciint.2005.04.002. [DOI] [PubMed] [Google Scholar]
- 16.Vermeulen M, Wollstein A, Gagg K, Lao O, Xue Y, Wang W, et al. Improving global and regional resolution of male lineage differentiation by simple single-copy Y-chromosomal short tandem repeat polymorphisms. Forensic Sci IntForthcoming2009 [DOI] [PMC free article] [PubMed] [Google Scholar]
- 17.Underhill PA, Jin L, Lin AA, Mehdi SQ, Jenkins T, Vollrath D, et al. Detection of numerous Y chromosome biallelic polymorphisms by denaturing high-performance liquid chromatography. Genome Res. 1997;7:996–1005. doi: 10.1101/gr.7.10.996. [DOI] [PMC free article] [PubMed] [Google Scholar]
- 18.Wilder JA, Kingan SB, Mobasher Z, Pilkington MM, Hammer MF. Global patterns of human mitochondrial DNA and Y-chromosome structure are not influenced by higher migration rates of females versus males. Nat Genet. 2004;36:1122–5. doi: 10.1038/ng1428. [DOI] [PubMed] [Google Scholar]
- 19.Underhill PA, Passarino G, Lin AA, Shen P, Mirazon Lahr M, Foley RA, et al. The phylogeography of Y chromosome binary haplotypes and the origins of modern human populations. Ann Hum Genet. 2001;65:43–62. doi: 10.1046/j.1469-1809.2001.6510043.x. [DOI] [PubMed] [Google Scholar]
- 20.Rootsi S, Magri C, Kivisild T, Benuzzi G, Help H, Bermisheva M, et al. Phylogeography of Y-chromosome haplogroup I reveals distinct domains of prehistoric gene flow in Europe. Am J Hum Genet. 2004;75:128–37. doi: 10.1086/422196. [DOI] [PMC free article] [PubMed] [Google Scholar]
- 21.Cruciani F, Santolamazza P, Shen P, Macaulay V, Moral P, Olckers A, et al. A back migration from Asia to sub-Saharan Africa is supported by high-resolution analysis of human Y-chromosome haplotypes. Am J Hum Genet. 2002;70:1197–214. doi: 10.1086/340257. [DOI] [PMC free article] [PubMed] [Google Scholar]
- 22.Sims LM, Garvey D, Ballantyne J. Sub-populations within the major European and African derived haplogroups R1b3 and E3a are differentiated by previously phylogenetically undefined Y-SNPs. Hum Mutat. 2007;28:97. doi: 10.1002/humu.9469. [DOI] [PubMed] [Google Scholar]
- 23.Seielstad MT, Hebert JM, Lin AA, Underhill PA, Ibrahim M, Vollrath D, et al. Construction of human Y-chromosomal haplotypes using a new polymorphic A to G transition. Hum Mol Genet. 1994;3:2159–61. doi: 10.1093/hmg/3.12.2159. [DOI] [PubMed] [Google Scholar]
- 24.Kittler R, Erler A, Brauer S, Stoneking M, Kayser M. Apparent intrachromosomal exchange on the human Y chromosome explained by population history. Eur J Hum Genet. 2003;11:304–14. doi: 10.1038/sj.ejhg.5200960. [DOI] [PubMed] [Google Scholar]
- 25.Bandelt HJ, Forster P, Rohl A. Median-joining networks for inferring intraspecific phylogenies. Mol Biol Evol. 1999;16:37–48. doi: 10.1093/oxfordjournals.molbev.a026036. [DOI] [PubMed] [Google Scholar]
- 26.Bandelt HJ, Forster P, Sykes BC, Richards MB. Mitochondrial portraits of human populations using median networks. Genetics. 1995;141:743–53. doi: 10.1093/genetics/141.2.743. [DOI] [PMC free article] [PubMed] [Google Scholar]
- 27.Kayser M, Kittler R, Erler A, Hedman M, Lee AC, Mohyuddin A, et al. A comprehensive survey of human Y-chromosomal microsatellites. Am J Hum Genet. 2004;74:1183–97. doi: 10.1086/421531. [DOI] [PMC free article] [PubMed] [Google Scholar]
- 28.Underhill PA, Myres NM, Rootsi S, Chow CT, Lin AA, Otillar RP, et al. New phylogenetic relationships for Y-chromosome haplogroup I: reappraising its phylogeography and prehistory. In: Mellars P, Boyle K, Bar-Yosef O, Stringer C, editors. Rethinking the human revolution. Cambridge: McDonald Institute Monographs; 2007. p. 33-42. [Google Scholar]
- 29.Weale ME, Weiss DA, Jager RF, Bradman N, Thomas MG. Y chromosome evidence for Anglo-Saxon mass migration. Mol Biol Evol. 2002;19:1008–21. doi: 10.1093/oxfordjournals.molbev.a004160. [DOI] [PubMed] [Google Scholar]
- 30.Berniell-Lee G, Calafell F, Bosch E, Heyer E, Sica L, Mouguiama-Daouda P, et al. Genetic and demographic implication of the Bantu expansion: insight from human paternal lineages. Mol Biol Evol. 2009 doi: 10.1093/molbev/msp069. [DOI] [PubMed] [Google Scholar]