

Abstract
Little is known about the underlying neurobiology of rhythm and beat perception, despite its universal cultural importance. Here we used functional magnetic resonance imaging to study rhythm perception in musicians and nonmusicians. Three conditions varied in the degree to which external reinforcement versus internal generation of the beat was required. The “volume” condition strongly externally marked the beat with volume changes, the “duration” condition marked the beat with weaker accents arising from duration changes, and the “unaccented” condition required the beat to be entirely internally generated. In all conditions, beat rhythms compared with nonbeat control rhythms revealed putamen activity. The presence of a beat was also associated with greater connectivity between the putamen and the supplementary motor area (SMA), the premotor cortex (PMC), and auditory cortex. In contrast, the type of accent within the beat conditions modulated the coupling between premotor and auditory cortex, with greater modulation for musicians than nonmusicians. Importantly, the response of the putamen to beat conditions was not attributable to differences in temporal complexity between the three rhythm conditions. We propose that a cortico-subcortical network including the putamen, SMA, and PMC is engaged for the analysis of temporal sequences and prediction or generation of putative beats, especially under conditions that may require internal generation of the beat. The importance of this system for auditory–motor interaction and development of precisely timed movement is suggested here by its facilitation in musicians.
Introduction
Appreciation of musical rhythms is an important feature of human culture. A key feature of rhythm is an underlying regular beat: a perceived pulse that marks equally spaced points in time (Cooper and Meyer, 1960; Lerdahl and Jackendoff, 1983). Perception of the beat enables temporal intervals marked by stimulus onsets to be encoded as multiples or subdivisions of the beat, rather than as unrelated intervals, and improves rhythm reproduction and discrimination (Drake and Gerard, 1989; Ross and Houtsma, 1994; Hebert and Cuddy, 2002; Patel et al., 2005). Beat perception can feel automatic and occurs without musical training even in young children, but little is known about the neural mechanisms.
Humans often move to the beat (Drake et al., 2000), suggesting motor networks may be important. Neuroimaging has confirmed activity in “motor areas” during production and perception of rhythm (Schubotz et al., 2000; Schubotz and von Cramon, 2001; Grahn and Brett, 2007; Chen et al., 2008b). However, no consensus exists on the nonmotor roles these areas play in rhythm or beat perception.
To perceive the beat, several cues are used, usually involving accents. An accent is an increase in salience when an event differs from surrounding events (Cooper and Meyer, 1960; Povel and Okkerman, 1981; Parncutt, 1994). Accents can be “dynamic,” involving volume changes (Chen et al., 2006), or “temporal,” involving duration changes (Essens and Povel, 1985; Palmer and Krumhansl, 1990). “Subjective” accents are also perceived even without external accents (for example, in a sequence of tones identical in volume, duration, pitch, etc.) as listeners internally emphasize certain tones in the sequence (Bolton, 1894; Temperley, 1963; Brochard et al., 2003). Listeners' perceptions appear to be influenced by musical training in some studies (Yee et al., 1994; Drake et al., 2000) but not others (Snyder and Krumhansl, 2001). Musical training effects may arise from extensive engagement in encoding, memorizing, and performing rhythms with a beat.
In two complementary experiments, we used functional magnetic resonance imaging (fMRI) to study beat perception for rhythms with different accent types in musicians and nonmusicians (see Fig. 1). We used rhythms with regular volume accents (strong external beat emphasis), duration accents (weaker external beat emphasis), or no accents (no external beat emphasis). We present analyses of both regional activation and connectivity observed for beat perception in all three conditions and also compare the effects of internal versus external beat generation.
Figure 1.

Schematic depictions of the auditory stimuli used in experiments 1 and 2. On the left is a depiction of the auditory waveform, in the middle is a depiction in standard musical notation, and on the right are the mean ratings of beat presence given by participants for each condition (mus, musician; non, nonmusicians). Red lines mark the onsets coinciding with the beat (applicable to beat conditions only) and correspond to the first note of each measure in the music. Volume accents are indicated by higher relative height (in left) or accent symbols (< in the right). The depictions represent an excerpt of ∼2.5 s.
We made four predictions. First, basal ganglia activity would increase for beat versus nonbeat rhythms, extending findings of basal ganglia involvement in duration beat rhythms (Grahn and Brett, 2007, 2009). Second, internal beat generation would modulate basal ganglia activity, consistent with the role of the basal ganglia in internally generated movements (Freeman et al., 1993; Mushiake and Strick, 1995; van Donkelaar et al., 1999). Third, beat rhythms would be associated with greater coupling between basal ganglia and cortical rhythm areas. Finally, musical training would enhance connectivity within the neural networks mediating beat perception, as it does for auditory–motor synchronization (Chen et al., 2008a).
Materials and Methods
Participants.
Thirty-six participants (21 male, 15 female; age range, 18–41 years; mean of 29) took part in experiment 1 and experiment 2 (in that order) on the same day after providing written informed consent. Nineteen had musical training defined as five or more years of formal musical training and continuing musical activities. Seventeen had no musical training, defined as no current or previous formal musical training or musical performance activities. All participants reported having normal hearing.
Stimuli.
For experiment 1, volume-accented and duration-accented rhythmic stimuli were used. The stimuli were between 14 and 18 s long. There were four rhythm types in a 2 × 2 factorial design, with the factors beat (beat/nonbeat) and the dimension that varied to indicate the beat (volume/duration). For schematic depictions of the stimuli, see Figure 1. Thus, the first rhythm type (volume accented with beat) consisted of 81 tones, in which every fourth tone was louder by 8.5 dB, to give rise to the perception of a regular beat (occurring 21 times per trial). For each trial, the tone length was chosen from a range of 180–228 ms (in 8 ms steps) so that a new beat would be induced in each trial, not simply carried over from a previous trial. Accordingly, the beat occurred at a rate of 720–912 ms. The second rhythm type (volume accented with no beat) also had 81 tones. However, the tone lengths were not isochronous, so no regular beat could be fit to the rhythm. The volume nonbeat rhythms were created from each volume beat rhythm. One-third of the original intervals were shortened by 30%, another one-third were lengthened by 30%, and the remaining one-third stayed the same. All the intervals were randomly reshuffled, and 21 tones were randomly chosen to receive a volume accent (to be comparable with the volume beat condition). Thus, the number of intervals, overall rhythm length, number of volume accents, and overall root mean square (RMS) intensity was equivalent between the volume beat and the volume nonbeat conditions.
The duration beat condition was constructed from 20 patterns used in previous experiments (Grahn and Brett, 2007) that rely on the temporal context (i.e., the relative durations) to give rise to the perception of a regular beat (Povel and Okkerman, 1981; Grahn and Brett, 2007). For a list of the patterns used, see supplemental Table 1 (available at www.jneurosci.org as supplemental material). Five of these patterns were randomly selected for each trial, and each trial consisted of all five patterns played without a break (as one continuous rhythm). Each pattern was used three times across the experiment. For each duration beat trial, an equivalent duration nonbeat trial was created. First, all the intervals from the duration beat trial were divided into their respective categories (four different interval lengths were present in each trial). Then, one-third of the intervals in each category were shortened by 30%, one-third remained the same, and one-third of the intervals were lengthened by 30%. All the intervals were then randomly reshuffled. Thus, the number of intervals, overall rhythm length, and RMS intensity was equivalent between the duration beat and the duration nonbeat conditions.
For all conditions, 500 Hz sine tones (rise/fall times of 8 ms) sounded for the duration of each interval, ending 40 ms before the specified interval length to create a silent gap that demarcated the intervals. The sequences used filled intervals, because filled intervals provide the benefit of attenuation of environmental noise (e.g., that experienced during MRI). The tones in the duration conditions were ∼6 dB softer than accented tones in the volume condition and 2.5 dB louder than the unaccented tones in the volume condition. The overall RMS intensity was equated between the volume and duration conditions, so that the average level of auditory stimulation was the same.
In experiment 2, the volume beat and volume nonbeat conditions were as above but shortened to 61 tones each. In addition, unaccented versions of each condition also were created, by removing amplitude modulation (Fig. 1). The intervals in the unaccented conditions (unaccented beat and unaccented nonbeat) were therefore temporally identical to the volume beat and volume nonbeat conditions. Unaccented condition sequences were presented at the same decibel level as the duration condition sequences.
Behavioral design.
Before scanning, participants heard a randomly selected sample of each of the rhythm types. After listening to each rhythm, they answered three questions about the beat, using rating scales of 1 to 10. The first question was, “How much did this sound have a beat?” Pilot studies indicated that many nonmusicians were not confident when answering this question, because it was perceived to be an objective property of the rhythm that they were unqualified to judge. Therefore, two more subjective questions were included: “How easy was it to feel a beat?” and “How clear was the beat?”
fMRI experimental design.
Experiment 1 was designed to enable both regional analysis of activation differences between conditions and connectivity analyses between areas. Experiment 2 was initially conceived of as a supplemental experiment that controlled for differences in temporal complexity. The volume and duration conditions in experiment 1 differ in the degree of external accent present, but they also differ in temporal complexity. However, in experiment 2, the volume and unaccented conditions are balanced in terms of temporal complexity but still differ in the degree of external reinforcement of the beat. Thus, any activation differences observed between volume and duration conditions in experiment 1 would be unlikely attributable to differences in complexity if they were also present in contrasts between volume and unaccented conditions in experiment 2. Concerns about time constraints and participant fatigue led us to keep experiment 2 brief, focusing on the analysis of differences in regional activation associated with different accents without difference in temporal complexity. As a result, experiment 2 was not optimized for analyses of connectivity
Rhythms were presented diotically over headphones with 30 dB attenuation of scanner noise by insert earplugs (3M 1100 earplugs). None of the participants reported difficulty in hearing the rhythms. Head fixation used foam pads.
For experiment 1, a 14–18 s rhythm was presented on each trial, followed by a 12.4 s rest period. Eleven trials of each rhythm type (volume beat, volume nonbeat, duration beat, and duration nonbeat) and a subsequent rest period were presented in permuted order. To ensure participants' attention to the rhythms, they completed a pitch change detection task, pressing a key if they heard a tone that was different in pitch to all the other tones (450 Hz, presented 20 times during the session). Piloting indicated that this frequency difference was distinguishable by both musicians and nonmusicians but did not lead to performance at ceiling. Frequency detection was chosen because it was unlikely to encourage any tapping or subvocalizing of the rhythm. In addition, the relative rarity and unpredictability of the deviant meant the observed effects of interest could be unconfounded with response preparation. Participants were told that they would be listening to rhythms similar to those rated before scanning and that their task was to press the button under their index finger each time they heard a change in the pitch of the rhythm. They were also told that the aim of the study was to examine brain activity when “feeling the beat” and to focus on the beat in addition to listening for pitch changes. Finally, they were instructed not to move any part of the body during scanning, apart from the index finger to press the button when a deviant tone was heard. Participants were visually monitored throughout to ensure no tapping or other movement occurred.
For experiment 2, trials of volume beat, volume nonbeat, unaccented beat, and unaccented nonbeat rhythms were played without deviant tones. Participants were again instructed to focus on feeling the beat but not to move. Eight 11–13.5 s rhythms of each type were played alternating with 4 s of rest, in a balanced permuted order.
Image acquisition.
A 3T Siemens Tim Trio MRI scanner was used to collect 580 echoplanar imaging (EPI) volumes in experiment 1, followed by 261 EPI volumes in experiment 2. All EPI data had 36 slices, matrix size of 64 × 64, echo time (TE) of 30 ms, repetition time (TR) of 2.19 s, field of view of 19.2 × 19.2 cm, flip angle of 78°, slice thickness of 3 mm, interslice distance of 0.75 mm, and in-plane resolution of 3 × 3 mm. High-resolution magnetization-prepared rapid-acquisition gradient echo (MPRAGE) anatomical images (TR of 2250 ms, TE of 2.99 ms, flip angle of 9°, inversion time of 900 ms, 256 × 256 × 192 isotropic 1 mm voxels) were collected for anatomic localization and coregistration. The total time each participant spent in the scanner was ∼40 min.
Image analysis.
SPM5 was used for data analysis (SPM5; Wellcome Department of Imaging Neuroscience, London, UK). Images were sinc interpolated in time to correct for acquisition time differences and realigned spatially with respect to the first image using trilinear interpolation. The coregistered MPRAGE image was segmented and normalized using affine and smoothly nonlinear transformations to the T1 template in Montreal Neurological Institute (MNI) space. The normalization parameters were then applied to the EPIs, and all normalized EPI images were spatially smoothed with a Gaussian kernel of full-width half-maximum 8 mm.
Subject-specific first-level models included epochs representing the four conditions and a transient event for the deviant tone/button press (experiment 1 only), convolved by the canonical hemodynamic response function. EPI volumes associated with discrete artifacts were included as covariates of no interest (including volume displacement >4 mm or spikes of high variance in which scaled volumes to volume variance was four times greater than the mean variance). Autocorrelations were modeled using an AR(1) process, and low-frequency noise was removed with a standard high-pass filter of 128 s.
Relevant contrast images (voxelwise differences in parameter estimates) from single participant models were entered into second-level random-effects analyses for group inference (Penny and Holmes, 2003). In experiment 1, results are presented at threshold false discovery rate (FDR), p < 0.05 for whole-brain comparisons. Because experiment 2 contained fewer scans than experiment 1 and consequently less power, a reduced search volume was defined from significant voxels obtained in the beat − nonbeat contrast in experiment 1 (FDR corrected, p < 0.05) and used for the beat − nonbeat contrast in experiment 2. In effect, therefore, experiment 2 used the beat − nonbeat contrast from experiment 1 as a localizer. This was motivated by the restricted principal aims of experiment 2 (a control for temporal complexity in beat perception and replication of key effects from experiment 1) and in recognition of reduced statistical power of experiment 2.
Effects of stimulus rate.
Additional analyses were conducted to determine whether activity in areas that responded to the beat also correlated with the rate, or tempo, of the stimuli. This was to ensure that no rate confound could arise between our conditions. For details of this analysis, see supplemental Methods (available at www.jneurosci.org as supplemental material).
Psychophysiological interaction analysis.
The physiological interaction between two regions may be modulated by the experimental or “psychological” context, representing a psychophysiological interaction (PPI). PPI analysis by general linear models provides an anatomically unconstrained method to analyze changes in connectivity between regions in a network (Friston et al., 1997).
For the first experiment, we analyzed the differential connectivity of the left and right anterior and posterior putamen foci under beat versus nonbeat conditions. Because both the left and right putamen showed similar results (no differences at p < 0.5, FDR), the results are collapsed across both putamen foci. To construct the model, the deconvolved time courses of activity in the foci were extracted from the F contrast of all effects of interest. The regions of interest (ROIs) were spheres (8 mm diameter) centered at the following: right anterior putamen, x = 26, y = 8, z = 8; left anterior putamen, x = −26, y = 2, z = 6; right posterior putamen, x = 30, y = −16, z = 8; left posterior putamen, x = −32, y = −18, x = 0. These activation time courses constituted the first regressor in the PPI analyses. Then three experimental context variables were entered as the second, third, and fourth regressor. The first experimental context variable examined the two beat conditions: comparing beat in the context of the duration condition versus the context of the volume condition (duration beat = 1; volume beat = −1; duration nonbeat = volume nonbeat = 0). The second experimental context variable examined the two nonbeat conditions, again in the context of duration accents versus volume accents (duration nonbeat = 1; volume nonbeat = −1; volume beat = duration beat = 0). The third experimental context variable was the effect of beat versus no beat, collapsed across accent type (duration beat = volume beat = 1; duration nonbeat = volume nonbeat = −1). The product of the neural time course with each psychological factor was calculated and then reconvolved by the hemodynamic response function to create three PPI terms. The effects of these interaction terms were investigated for each subject and each putamen region and entered into a second-level random-effects model. A regions-of-interest image was created from the areas showing significant rhythm-related activity (8-mm-diameter spheres on peak voxels of superior temporal gyri (STG), premotor (PMC) and supplementary (SMA) motor cortices, and the cerebellum in the all rhythms − rest contrast). This image was used as a compound region of interest [with small volume correction (SVC)] in the PPI analyses.
Secondary PPI analyses were conducted on the cortical areas showing a specific modulation of connectivity with the putamen during beat versus no beat conditions. The source regions of interest for these PPIs were spheres (8 mm diameter) centered at the peaks of activity in the all rhythms − rest contrast. These regions included the right PMC (x = 54, y = 0, z = 48), left PMC (x = −52, y = −10, z = 50), right SMA (x = 6, y = 0, z = 66), and left SMA (x = −6, y = −4, z = 66). The PPI analyses were conducted as described above, using the same SVC image as above.
A similar connectivity analysis was conducted for experiment 2, although this second study was underpowered for PPI analysis attributable to fewer scans and shorter rest intervals. We specifically tested whether the pattern of connectivity observed for duration and volume beat versus nonbeat conditions in experiment 1 was also present for the unaccented beat versus nonbeat condition in experiment 2. The bilateral anterior putamen foci from experiment 1 were used as seed regions. Peaks within 1 cm of PPI-related peaks observed in experiment 1 are reported with uncorrected p values.
Results
Behavioral results
The three behavioral ratings of beat (how much was a beat present, how easy was it to feel the beat, and how clear was the beat) were highly correlated across subjects within each condition (0.70 < r < 0.99; all p < 0.001). Therefore, an average of the three ratings for each subject was taken as the measure of subjective experience of beat. Analyses were also conducted on the individual ratings measures in addition to an averaged measure. No differences in the pattern of results were found, so, for conciseness, only statistics for the average measure are reported.
Beat ratings are illustrated in Figure 1. The ratings underwent a mixed ANOVA that revealed significant main effects for beat (F(1,34) = 115.51; p < 0.001) and accent type (F(1,34) = 19.70; p < 0.001) but not for musical training (F < 1). There was also an interaction between beat and musical training (F(1,34) = 4.34; p = 0.045) attributable to musicians rating beat conditions higher and nonbeat conditions lower than nonmusicians. There was also a significant interaction between beat and accent type (F(2,68) = 3.15; p = 0.049), reflecting that ratings for volume beat > unaccented beat > duration beat but volume nonbeat = unaccented nonbeat > duration nonbeat. No other significant effects were found. Behavioral data for the pitch-deviant detection collected during the scanning session is also presented in the supplemental data (available at www.jneurosci.org as supplemental material).
Regional changes in brain activation
Experiment 1
Listening to rhythms (collapsed across all types and compared with rest) activated the SMA, bilateral PMC, STG, insula, putamen, cerebellum, and right middle frontal gyrus [Brodmann area (BA) 45/46], supramarginal gyrus, and inferior frontal gyrus (BA 44/45). For exact coordinates, see supplemental Table 2 (available at www.jneurosci.org as supplemental material).
A main effect of Beat (volume beat + duration beat − volume nonbeat + duration nonbeat) was found most strongly in the putamen bilaterally (Table 1, Fig. 2a). A main effect of volume accents (volume beat + volume nonbeat − duration beat + duration nonbeat) was found most strongly in auditory cortex but also in the right frontal cortex (BA 6, 8, 9, 44, 45, and 46), left frontal cortex (BA 8, 43, and 44), and bilateral cerebellum (Crus II). For exact coordinates, see supplemental Table 3 (available at www.jneurosci.org as supplemental material).
Table 1.
Stereotaxic locations of peak voxels in beat − no beat SPM contrast in experiments 1 and 2
| Brain region | Experiment 1 |
Experiment 2 |
||||||
|---|---|---|---|---|---|---|---|---|
| t score | x | y | z | t score | x | y | z | |
| L anterior putamen | 4.87 | −26 | 2 | 6 | 2.84 | −22 | 6 | 8 |
| 2.63 | −20 | 8 | −4 | |||||
| 2.03 | −24 | −2 | 8 | |||||
| 1.8 | −18 | 10 | −8 | |||||
| R anterior putamen | 5.01 | 26 | 8 | 8 | 3.29 | 26 | 8 | 0 |
| 3.25 | 22 | 6 | 12 | |||||
| L posterior putamen | 5.2 | −32 | −18 | 0 | 3.1 | −30 | −14 | −2 |
| 2.65 | −26 | −12 | 14 | |||||
| R posterior putamen | 4.63 | 30 | −16 | 8 | 2.51 | 30 | −12 | 4 |
| L caudate nucleus | 4.29 | −8 | 20 | −8 | ||||
| L ventral striatum | 4.17 | −18 | 12 | −12 | ||||
| R middle orbital gyrus | 3.9 | 0 | 28 | −12 | ||||
| L inferior temporal gyrus | 3.87 | −50 | −24 | −20 | ||||
| L paracentral lobule | 3.8 | −18 | −26 | 66 | ||||
This table shows the brain region, t values, and stereotaxic coordinates (in millimeters) of peak voxels for experiment 1 (p < 0.05 whole-brain FDR corrected) and experiment 2 (p < 0.05 SVC using mask generated from experiment 1 beat − no beat contrast, thresholded at p < 0.05 FDR) in MNI space. L, Left; R, right.
Figure 2.
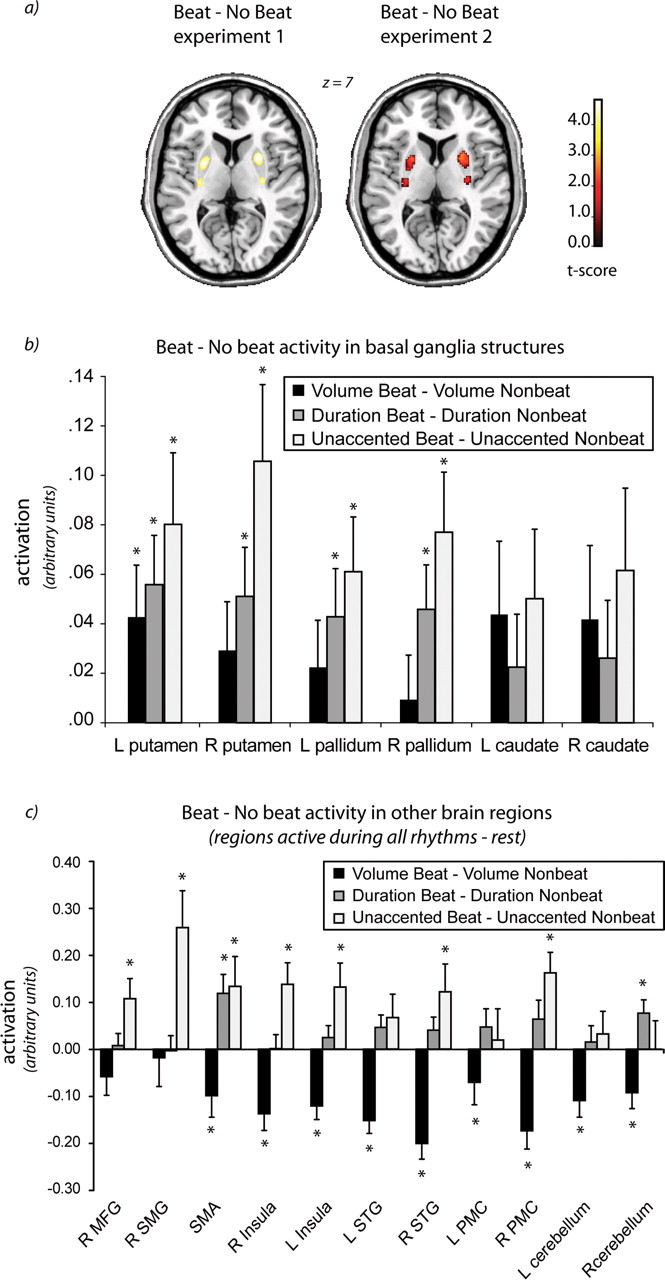
Statistical parametric mapping (SPM) analyses. The beat versus nonbeat contrasts overlaid on a template brain (a) and as extractions from regions of interest (b, c). Beat versus nonbeat SPM contrasts for experiment 1 and experiment 2 (for experiment 2, activation is masked by same contrast from experiment 1). Both experiments show significant bilateral activity in the putamen for this contrast. For experiment 1, peak voxels are p < 0.05 whole-brain FDR corrected. For experiment 2, peak voxels are p < 0.05 small volume corrected. Z refers to the level of the axial slice shown in stereotaxic MNI space. The graphs in b and c show mean activation (in arbitrary units) for the volume beat versus volume nonbeat and duration beat versus duration nonbeat contrasts (from experiment 1), and unaccented beat versus unaccented nonbeat contrast (from experiment 2). b shows extractions from basal ganglia regions (as defined by Tzourio-Mazoyer et al., 2002) that were of a priori interest in this study. c shows extractions from peak voxels in additional regions active in all rhythms versus rest contrast in experiment 1. *p < 0.05 (significant difference between beat and nonbeat for that condition). R, Right; L, left; SMG, supramarginal gyrus; MFG, middle frontal gyrus.
Within the duration-accented conditions (duration beat − duration nonbeat), the beat condition significantly activated the putamen bilaterally. No significant activations were found for the reverse contrast (duration nonbeat − duration beat). These findings replicate previous results (Grahn and Brett, 2007). Between the volume-accented conditions, however, a different pattern was observed. The volume beat − volume nonbeat condition revealed no significant activations. However, the volume nonbeat − volume beat condition activated the bilateral pre-SMA, PMC (BA 6), STG, insula, inferior frontal gyrus (BA 44/45), and the cerebellum (lobules VI and VIII on the left, lobule VI on the right). For detailed coordinates, see supplemental Table 4 (available at www.jneurosci.org as supplemental material).
Several areas were sensitive to the interaction between beat and accent type [(duration beat − duration nonbeat) − (volume beat − volume nonbeat)]. In some areas, the interaction was attributable to greater activity in the duration beat − duration nonbeat contrast than in the volume beat − volume nonbeat contrast. In other areas, including the STG and cerebellum, the interaction is attributable to significantly decreased activity in the volume beat − volume nonbeat contrast compared with the duration beat − duration nonbeat contrast [supplemental Fig. 1, Table 5 illustrate the interaction effects in more detail (available at www.jneurosci.org as supplemental material)]. There were no significant differences in regional activation associated with musical training.
Experiment 2
The comparison of beat versus no beat [(unaccented beat + volume beat) − (unaccented nonbeat + volume nonbeat)] revealed activation of putamen bilaterally (for a list of maxima, see Table 1) (Fig. 2a, results-corrected family-wise error, p < 0.05 within a reduced search volume defined from the FDR-corrected equivalent contrast in the first experiment). The average activity of individual basal ganglia structures (ROIs of the putamen, pallidum, and caudate) (Tzourio-Mazoyer et al., 2002) is shown in Figure 2b. The graph depicts signal intensity extracted from the beat − nonbeat contrast images for each condition (volume and duration from experiment 1, and unaccented from experiment 2).
We compared activation patterns across experiments 1 and 2 for an equivalent contrast common to both experiments (volume beat − volume nonbeat). In every ROI reported (all bilateral basal ganglia structures, cerebellum, premotor cortex, SMA, insula, right supramarginal gyrus, and right middle frontal gyrus), no significant differences were found in activity between experiment 1 and experiment 2 for this contrast. Thus, the slightly shorter stimuli and absence of the monitoring task in experiment 2 did not significantly affect activation in rhythm network areas.
Effects of stimulus rate
Activation within the basal ganglia was not significantly correlated with rate in any of the rhythm conditions. For more detail, see supplemental Results (available at www.jneurosci.org as supplemental material).
Changes in connectivity between regions
The first set of PPI analyses compared the connectivity patterns of the anterior and posterior putamen to other brain areas for experiment 1. During the volume and duration beat conditions compared with the volume and duration nonbeat conditions, the anterior putamen showed increases in connectivity with the PMC, SMA, and right STG (p < 0.05, SVC; see Materials and Methods) and a similar trend in the left STG and right cerebellum (p < 0.1, SVC). This is illustrated in Figure 3(top). For experiment 2, similar, although less robust, results were observed for the unaccented beat − unaccented nonbeat condition. All reported peaks are within 1 cm of peaks for experiment 1. The anterior putamen showed increases in connectivity with the bilateral PMC (right, x = 58, y = 2, z = 40, t = 1.82; left, x = −56, y = 2, z = 40, t = 1.74), cerebellum (right, x = 58, y = 2, z = 40, t = 1.88; left, x = −32, y = −60, z = −32, t = 1.66), at p < 0.05 uncorrected. Trends were observed in bilateral SMA (midline, x = 0, y = −2, z = 60; t = 1.44, p = 0.07 uncorrected; left, x = −4, y = −6, z = 60, t = 1.56, p = 0.06 uncorrected) and left STG (x = −50, y = −20, z = 2, t = 1.28, p = 0.1 uncorrected). Effect sizes were similar between experiment 1 and experiment 2 for putamen connectivity with motor areas (right PMC, 0.052 vs 0.060; left PMC, 0.074 vs 0.048; right SMA, 0.048 vs 0.060; left SMA, 0.040 vs 0.056; left cerebellum, 0.027 vs 0.026; right cerebellum, 0.036 vs 0.032). This suggests that lack of significance at a corrected threshold was attributable to increased variability in the underpowered design and that the beat − nonbeat connectivity patterns between putamen and motor areas across experiments 1 and 2 were qualitatively similar.
Figure 3.
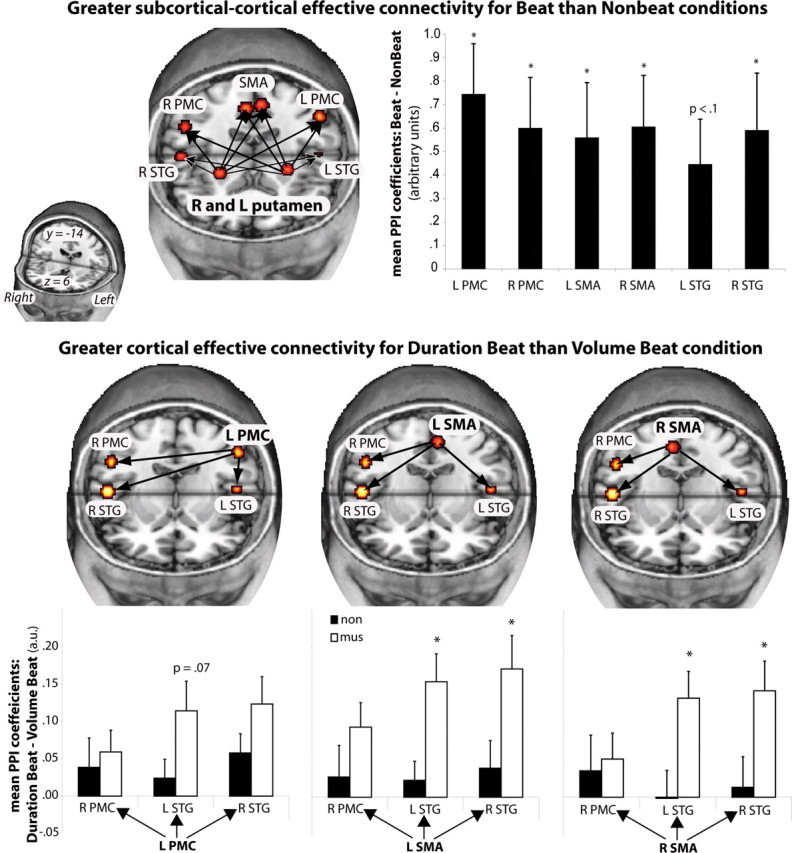
Connectivity analyses in experiment 1. Top displays regions showing increased coupling with the anterior putamen in beat compared with nonbeat conditions. Mean PPI coefficients (arbitrary units) for each of the target regions are shown in the graph. *p < 0.05 SVC. Bottom displays regions with increased coupling during the duration beat condition versus the volume beat condition. Mean PPI coefficients (arbitrary units) from the target regions for each of the significant source → target pairs are shown in the graph (p < 0.05 SVC). Coefficients for musicians and nonmusicians are shown: *p < .05, significant difference between groups (independent samples t test). R, Right; L, left; mus, musician; non, nonmusician.
There were no differences in cortico-subcortical coupling for musicians and nonmusicians. When comparing the volume beat with the duration beat condition, no significant differences in connectivity were observed between anterior putamen and other areas. The posterior putamen PPI yielded no significant changes in connectivity for either beat versus no beat or volume beat versus duration beat.
Brain areas whose activity shows greater coupling with the putamen in beat conditions could subsequently interact differently with each other depending on how the beat was perceived. Therefore, secondary PPIs were determined from the SMA and PMC bilaterally. The SMA bilaterally and left PMC showed increased coupling with the bilateral STG and right PMC during the duration beat condition compared with the volume beat condition, as shown in Figure 3 (bottom).
Several of the increases in coupling between the cortical motor areas and the auditory cortex appear to be driven by the musicians in the study. The mean PPI coefficients for musicians and nonmusicians of the coupling between the bilateral SMA and left PMC to the bilateral STG are shown in Figure 3 (bottom). Musicians show significantly greater coupling than nonmusicians in the duration beat condition than in the volume beat condition, whereas nonmusicians tend to show more similar levels of coupling for both conditions (for exact PPI coordinates, see supplemental Tables 6, 7, available at www.jneurosci.org as supplemental material).
Discussion
The stimulus manipulations were successful in modulating the participants' perception of the beat (Fig. 1). High ratings of beat perception occurred even in the absence of external accents (unaccented beat condition), corroborating other work showing that internal subjective accents are generated when listening to unaccented isochronous rhythms (Temperley, 1963; Brochard et al., 2003). Moreover, the ratings indicate that these internal accents were as effective as external duration accents at inducing beat perception.
The putamen, pallidum, and caudate responded more to beat rhythms than nonbeat rhythms (Fig. 2b). Only the basal ganglia (the putamen most robustly) responded to beat presence per se, showing activity increases for all beat conditions compared with nonbeat conditions. Interestingly, putamen activation did not parallel the behavioral beat ratings. Participants rated beat presence as volume beat > unaccented beat > duration beat, whereas putamen activity was unaccented beat > duration beat > volume beat. Why might this be the case? A critical difference between conditions is the requirement for internal beat generation: this is unnecessary in the volume beat condition and essential in unaccented beat condition. Internal generation may modulate the basal ganglia response, with beat perception driving activity to a certain degree, but internal generation driving it as well. Importantly, the putamen response was not merely attributable to temporal complexity, because complexity was matched in the unaccented and volume beat conditions. Also, it is unlikely that the response was influenced by potential differences in the perceived beat rate between conditions. Other studies have searched for correlations between basal ganglia activity and tapping or vocalization rates and found none (Jenkins et al., 1997; Riecker et al., 2003; Lutz et al., 2005; Riecker et al., 2006). Here also, basal ganglia activity did not significantly correlate with stimulus rate. However, because we did not specifically manipulate beat rate independently of stimulus rate, this remains to be fully tested.
Turning to other rhythm-responsive areas, greater activity was generally shown for the most unpredictable, temporally complex condition, the volume nonbeat condition, in which all tone onsets and accents are unpredictable (Fig. 2c). In these regions, including dorsal premotor cortex, prefrontal cortex, inferior parietal lobule, and cerebellum, activity is associated with temporal complexity in motor tasks (Catalan et al., 1998; Lewis et al., 2004; Chen et al., 2008a). Their activation in a purely perceptual task suggests functional overlap between neural networks involved in the perception of temporal complexity and the organization and sequencing of temporally complex movements (Penhune et al., 1998).
Perhaps more surprisingly, several areas (right supramarginal and middle frontal gyri, bilateral insula) responded strongly to the “simplest” condition: the unaccented beat condition. For this condition, some participants reported that, in addition to a regular beat, they perceived more complex patterns of accents, giving rise to a rhythmic pattern similar to the duration condition. Thus, although the stimuli are quite simple, what subjects “do” with their perception may not be so simple. The volume beat condition is also simple, but external accents force a particular interpretation of the sequence.
The consequences of the role of the putamen in beat perception are suggested by the analyses of connectivity. Beat perception led to increased cortico-subcortical coupling of the putamen with bilateral SMA and PMC regardless of how the beat was determined (Fig. 3, top). One interpretation of this increased coupling is that the putamen encodes information about beat timing that facilitates cortical motor areas in precise control of movement timing, required, for example, when movements are made in time with beats.
In contrast to cortico-subcortical coupling, the corticocortical coupling among the SMA, PMC, and auditory cortex did depend on accent type: greater coupling was observed for the duration beat than the volume beat condition. Moreover, the increase in coupling depended on musical training. Only for musicians was coupling between bilateral SMA and STG significant (Fig. 3, bottom). These differences in coupling between musicians and nonmusicians are seen despite the lack of significant differences using traditional analyses of regional activation. This is consistent with other work showing that connectivity measures may be more sensitive than regional analyses (Rowe et al., 2007; Sonty et al., 2007). Recent work has investigated auditory–motor connectivity during tapping tasks in which participants to synchronize to rhythms (Chen et al., 2006, 2008b). During tapping, auditory–motor connectivity was increased as volume accents were increased, likely attributable to the greater influence of the auditory accent structure on participants' motor response (Chen et al., 2006). In a subsequent study, auditory–motor connectivity increased with musical training (Chen et al., 2008a), although tapping accuracy and regional activation levels also differed. Here we show that, during a purely perceptual task and without differences in regional activity, auditory–motor connectivity can be altered by musical training.
The difference in coupling between musicians and nonmusicians was paralleled by the difference in behavioral ratings: musicians rated the duration beat condition as having more of a beat than nonmusicians did, whereas the two groups rated the volume beat condition similarly. Arguably, the duration beat condition is most similar to the type of rhythms musicians spend extensive time learning and performing, thus musicians' ability to organize (“chunk”) and anticipate onsets may be superior to that of nonmusicians (Smith, 1983). This ability may influence expectations about what will be heard later in the sequence (e.g., expecting onsets to coincide with predicted beats in the duration beat condition). In the brain, this could be mediated by top-down influence from motor areas to auditory cortex. In contrast, anticipation of future onsets in the volume beat condition is trivial for both musicians and nonmusicians, thus no connectivity differences between the groups occur.
Whether musically trained or not, beat perception occurs spontaneously in most people without great effort. Cognitive theories of beat perception propose that the beat in music is indicated by several accent types: volume, duration, melodic, harmonic, timbral, etc. When attempting to find a beat in a sequence, people generate hypotheses about the beat location based on the perceived accents (Drake and Botte, 1993; Toivanen and Snyder, 2003; Hannon et al., 2004) and predict that future accented events will occur “on the beat.” Successful prediction leads to enhanced processing of stimulus features (Jones et al., 2002). The basal ganglia have been implicated in prediction of events (Doya, 2000; Tanji, 2001; Schultz, 2006).When accents occur in unpredicted locations (not on the beat), then the listener's current predictions will be incorrect, causing a prediction error that leads to adjusted future hypotheses (Schultz and Dickinson, 2000; Davidson and Wolpert, 2003). This prediction error and continual updating of an internal model of events may explain the large degree of activation seen for the volume nonbeat conditions in both experiments: strongly accented events, which are normally indicative of a beat, were occurring at unpredictable times. The salient but unpredictable volume accents could cue participants to search for a beat to a greater degree than less salient duration accents.
We propose that the role of the basal ganglia in rhythm perception, as in other domains, is prediction: when a detectable structure is present in the rhythm, predictions can be made about the timing of future onsets. Successful predictions can enhance the speed of perceptual organization of the sequence, reducing working memory load. With EEG, increases in induced gamma-band activity are observed in anticipation of expected beat locations (Snyder and Large, 2005; Zanto et al., 2006). Together, these results suggest a strong relationship between anticipation or prediction and beat perception. These results also link to models of musical expectancy (Large and Jones, 1999), suggesting that prediction may a key process in the perception of musical rhythm.
The results are also of clinical significance, because the basal ganglia are compromised in Parkinson's disease. Parkinson's disease patients have decreased striatal dopamine release, affecting excitatory input to the putamen (Lewis et al., 2004). Studies in patients with Parkinson's disease have shown deficits in timing tasks (Artieda et al., 1992; O'Boyle et al., 1996; Harrington et al., 1998). In addition, Parkinson's disease patients have selective deficits in discriminating rhythms that have a weakly indicated beat structure (Grahn and Brett, 2009), such as duration beat rhythms, but they are unimpaired in discriminating control nonbeat rhythms. Rhythmic signals with a strong external beat ameliorate gait problems in Parkinson's disease and Huntington's disease (McIntosh et al., 1997; Thaut et al., 2001a,b). Thus, rhythmic cueing therapy may depend on common neural systems underlying rhythm perception and movement, including the putamen.
In conclusion, the basal ganglia show a specific response to the beat during rhythm perception, regardless of musical training or how the beat is indicated. We suggest that a cortico-subcortical network, including the putamen, SMA, and PMC, is engaged for the analysis of temporal sequences and prediction or generation of putative beats, especially under conditions that require internal generation of the beat. In these conditions, the coupling among cortical motor and auditory areas is facilitated for musically trained individuals.
Footnotes
This work was supported by the Medical Research Council (Cost Code U.1055.01.001.00001.01) (J.A.G.), Wellcome Trust Grant WT077029 (J.B.R.), and the Betty Behrens Research Fellowship from Clare Hall, Cambridge (J.A.G.).
References
- Artieda J, Pastor MA, Lacruz F, Obeso JA. Temporal discrimination is abnormal in Parkinson's disease. Brain. 1992;115:199–210. doi: 10.1093/brain/115.1.199. [DOI] [PubMed] [Google Scholar]
- Bolton TL. Rhythm. Am J Psychol. 1894;6:145–238. [Google Scholar]
- Brochard R, Abecasis D, Potter D, Ragot R, Drake C. The “ticktock” of our internal clock: direct brain evidence of subjective accents in isochronous sequences. Psychol Sci. 2003;14:362–366. doi: 10.1111/1467-9280.24441. [DOI] [PubMed] [Google Scholar]
- Catalan MJ, Honda M, Weeks RA, Cohen LG, Hallett M. The functional neuroanatomy of simple and complex sequential finger movements. Brain. 1998;121:253–264. doi: 10.1093/brain/121.2.253. [DOI] [PubMed] [Google Scholar]
- Chen JL, Zatorre RJ, Penhune VB. Interactions between auditory and dorsal premotor cortex during synchronization to musical rhythms. Neuroimage. 2006;32:1771–1781. doi: 10.1016/j.neuroimage.2006.04.207. [DOI] [PubMed] [Google Scholar]
- Chen JL, Penhune VB, Zatorre RJ. Moving on time: brain network for auditory-motor synchronization is modulated by rhythm complexity and musical training. J Cogn Neurosci. 2008a;20:226–239. doi: 10.1162/jocn.2008.20018. [DOI] [PubMed] [Google Scholar]
- Chen JL, Penhune VB, Zatorre RJ. Listening to musical rhythms recruits motor regions of the brain. Cereb Cortex. 2008b;18:2844–2854. doi: 10.1093/cercor/bhn042. [DOI] [PubMed] [Google Scholar]
- Cooper G, Meyer LB. Chicago: The University of Chicago; 1960. The rhythmic structure of music. [Google Scholar]
- Davidson PR, Wolpert DM. Motor learning and prediction in a variable environment. Curr Opin Neurobiol. 2003;13:232–237. doi: 10.1016/s0959-4388(03)00038-2. [DOI] [PubMed] [Google Scholar]
- Doya K. Complementary roles of basal ganglia and cerebellum in learning and motor control. Curr Opin Neurobiol. 2000;10:732–739. doi: 10.1016/s0959-4388(00)00153-7. [DOI] [PubMed] [Google Scholar]
- Drake C, Botte MC. Tempo sensitivity in auditory sequences: evidence for a multiple-look model. Percept Psychophys. 1993;54:277–286. doi: 10.3758/bf03205262. [DOI] [PubMed] [Google Scholar]
- Drake C, Gérard C. A psychological pulse train: how young children use their cognitive framework to structure simple rhythms. Psychol Res. 1989;51:16–22. doi: 10.1007/BF00309271. [DOI] [PubMed] [Google Scholar]
- Drake C, Penel A, Bigand E. Tapping in time with mechanically and expressively performed music. Music Perception. 2000;18:1–24. [Google Scholar]
- Essens PJ, Povel DJ. Metrical and nonmetrical representations of temporal patterns. Percept Psychophysics. 1985;37:1–7. doi: 10.3758/bf03207132. [DOI] [PubMed] [Google Scholar]
- Freeman JS, Cody FW, Schady W. The influence of external timing cues upon the rhythm of voluntary movements in Parkinson's disease. J Neurol Neurosurg Psychiatry. 1993;56:1078–1084. doi: 10.1136/jnnp.56.10.1078. [DOI] [PMC free article] [PubMed] [Google Scholar]
- Friston KJ, Buechel C, Fink GR, Morris J, Rolls E, Dolan RJ. Psychophysiological and modulatory interactions in neuroimaging. Neuroimage. 1997;6:218–229. doi: 10.1006/nimg.1997.0291. [DOI] [PubMed] [Google Scholar]
- Grahn JA, Brett M. Rhythm perception in motor areas of the brain. J Cogn Neurosci. 2007;19:893–906. doi: 10.1162/jocn.2007.19.5.893. [DOI] [PubMed] [Google Scholar]
- Grahn JA, Brett M. Impairment of beat-based rhythm discrimination in Parkinson's disease. Cortex. 2009;45:54–61. doi: 10.1016/j.cortex.2008.01.005. [DOI] [PubMed] [Google Scholar]
- Hannon EE, Snyder JS, Eerola T, Krumhansl CL. The role of melodic and temporal cues in perceiving musical meter. J Exp Psychol Hum Percept Perform. 2004;30:956–974. doi: 10.1037/0096-1523.30.5.956. [DOI] [PubMed] [Google Scholar]
- Harrington DL, Haaland KY, Hermanowicz N. Temporal processing in the basal ganglia. Neuropsychology. 1998;12:3–12. doi: 10.1037//0894-4105.12.1.3. [DOI] [PubMed] [Google Scholar]
- Hébert S, Cuddy LL. Detection of metric structure in auditory figural patterns. Percept Psychophysics. 2002;64:909–918. doi: 10.3758/bf03196795. [DOI] [PubMed] [Google Scholar]
- Jenkins IH, Passingham RE, Brooks DJ. The effect of movement frequency on cerebral activation: a positron emission tomography study. J Neurol Sci. 1997;151:195–205. doi: 10.1016/s0022-510x(97)00145-7. [DOI] [PubMed] [Google Scholar]
- Jones MR, Moynihan H, MacKenzie N, Puente J. Temporal aspects of stimulus-driven attending in dynamic arrays. Psychol Sci. 2002;13:313–319. doi: 10.1111/1467-9280.00458. [DOI] [PubMed] [Google Scholar]
- Large EW, Jones MR. The dynamics of attending: how people track time-varying events. Psychol Rev. 1999;106:119–159. [Google Scholar]
- Lerdahl F, Jackendoff R. Cambridge, MA: MIT; 1983. A generative theory of tonal music. [Google Scholar]
- Lewis PA, Wing AM, Pope PA, Praamstra P, Miall RC. Brain activity correlates differentially with increasing temporal complexity of rhythms during initialisation, synchronisation, and continuation phases of paced finger tapping. Neuropsychologia. 2004;42:1301–1312. doi: 10.1016/j.neuropsychologia.2004.03.001. [DOI] [PubMed] [Google Scholar]
- Lutz K, Koeneke S, Wüstenberg T, Jäncke L. Asymmetry of cortical activation during maximum and convenient tapping speed. Neurosci Lett. 2005;373:61–66. doi: 10.1016/j.neulet.2004.09.058. [DOI] [PubMed] [Google Scholar]
- McIntosh GC, Brown SH, Rice RR, Thaut MH. Rhythmic auditory-motor facilitation of gait patterns in patients with Parkinson's disease. J Neurol Neurosurg Psychiatry. 1997;62:22–26. doi: 10.1136/jnnp.62.1.22. [DOI] [PMC free article] [PubMed] [Google Scholar]
- Mushiake H, Strick PL. Pallidal neuron activity during sequential arm movements. J Neurophysiol. 1995;74:2754–2758. doi: 10.1152/jn.1995.74.6.2754. [DOI] [PubMed] [Google Scholar]
- O'Boyle DJ, Freeman JS, Cody FWJ. The accuracy and precision of timing of self-paced, repetitive movements in subjects with Parkinson's disease. Brain. 1996;119:51–70. doi: 10.1093/brain/119.1.51. [DOI] [PubMed] [Google Scholar]
- Palmer C, Krumhansl CL. Mental representations for musical meter. J Exp Psychol Hum Percept Perform. 1990;16:728–741. doi: 10.1037//0096-1523.16.4.728. [DOI] [PubMed] [Google Scholar]
- Parncutt R. A perceptual model of pulse salience and metrical accent in musical rhythms. Music Perception. 1994;11:409–464. [Google Scholar]
- Patel AD, Iversen JR, Chen Y, Repp BH. The influence of metricality and modality on synchronization with a beat. Exp Brain Res. 2005;163:226–238. doi: 10.1007/s00221-004-2159-8. [DOI] [PubMed] [Google Scholar]
- Penhune VB, Zattore RJ, Evans AC. Cerebellar contributions to motor timing: A PET study of auditory and visual rhythm reproduction. J Cogn Neurosci. 1998;10:752–765. doi: 10.1162/089892998563149. [DOI] [PubMed] [Google Scholar]
- Penny W, Holmes AP. Random effects analysis. In: Frackowiack RSJ, Friston KJ, Frith CD, Dolan R, Price CJ, Ashburner J, Penny W, Zeki S, editors. Human brain function II. Ed 2. San Diego: Elsevier Academic; 2003. [Google Scholar]
- Povel DJ, Okkerman H. Accents in equitone sequences. Percept Psychophys. 1981;30:565–572. doi: 10.3758/bf03202011. [DOI] [PubMed] [Google Scholar]
- Riecker A, Wildgruber D, Mathiak K, Grodd W, Ackermann H. Parametric analysis of rate-dependent hemodynamic response functions of cortical and subcortical brain structures during auditorily cued finger tapping: a fMRI study. Neuroimage. 2003;18:731–739. doi: 10.1016/s1053-8119(03)00003-x. [DOI] [PubMed] [Google Scholar]
- Riecker A, Kassubek J, Gröschel K, Grodd W, Ackermann H. The cerebral control of speech tempo: opposite relationship between speaking rate and BOLD signal changes at striatal and cerebellar structures. Neuroimage. 2006;29:46–53. doi: 10.1016/j.neuroimage.2005.03.046. [DOI] [PubMed] [Google Scholar]
- Ross J, Houtsma AJ. Discrimination of auditory temporal patterns. Percept Psychophys. 1994;56:19–26. doi: 10.3758/bf03211687. [DOI] [PubMed] [Google Scholar]
- Rowe JB, Sakai K, Lund TE, Ramsøy T, Christensen MS, Baare WF, Paulson OB, Passingham RE. Is the prefrontal cortex necessary for establishing cognitive sets? J Neurosci. 2007;27:13303–13310. doi: 10.1523/JNEUROSCI.2349-07.2007. [DOI] [PMC free article] [PubMed] [Google Scholar]
- Schubotz RI, von Cramon DY. Interval and ordinal properties of sequences are associated with distinct premotor areas. Cereb Cortex. 2001;11:210–222. doi: 10.1093/cercor/11.3.210. [DOI] [PubMed] [Google Scholar]
- Schubotz RI, Friederici AD, von Cramon DY. Time perception and motor timing: a common cortical and subcortical basis revealed by fMRI. Neuroimage. 2000;11:1–12. doi: 10.1006/nimg.1999.0514. [DOI] [PubMed] [Google Scholar]
- Schultz W. Behavioral theories and the neurophysiology of reward. Annu Rev Psychol. 2006;57:87–115. doi: 10.1146/annurev.psych.56.091103.070229. [DOI] [PubMed] [Google Scholar]
- Schultz W, Dickinson A. Neuronal coding of prediction errors. Annu Rev Neurosci. 2000;23:473–500. doi: 10.1146/annurev.neuro.23.1.473. [DOI] [PubMed] [Google Scholar]
- Smith J. Reproduction and representation of musical rhythms: the effect of musical skill. In: Rogers DR, Sloboda JA, editors. Acquisition of symbolic skills. New York: Plenum; 1983. [Google Scholar]
- Snyder JS, Krumhansl CL. Tapping to ragtime: cues to pulse-finding. Music Perception. 2001;18:455–489. [Google Scholar]
- Snyder JS, Large EW. Gamma-band activity reflects the metric structure of rhythmic tone sequences. Brain Res Cogn Brain Res. 2005;24:117–126. doi: 10.1016/j.cogbrainres.2004.12.014. [DOI] [PubMed] [Google Scholar]
- Sonty SP, Mesulam MM, Weintraub S, Johnson NA, Parrish TB, Gitelman DR. Altered effective connectivity within the language network in primary progressive aphasia. J Neurosci. 2007;27:1334–1345. doi: 10.1523/JNEUROSCI.4127-06.2007. [DOI] [PMC free article] [PubMed] [Google Scholar]
- Tanji J. Sequential organization of multiple movements: involvement of cortical motor areas. Annu Rev Neurosci. 2001;24:631–651. doi: 10.1146/annurev.neuro.24.1.631. [DOI] [PubMed] [Google Scholar]
- Temperley NM. Personal tempo and subjective accentuation. J Gen Psychol. 1963;68:267–287. doi: 10.1080/00221309.1963.9920534. [DOI] [PubMed] [Google Scholar]
- Thaut MH, McIntosh KW, McIntosh GC, Hoemberg V. Auditory rhythmicity enhances movement and speech motor control in patients with Parkinson's disease. Funct Neurol. 2001a;16:163–172. [PubMed] [Google Scholar]
- Thaut MH, Miltner R, Lange HW, Hurt CP, Hoemberg V. Velocity modulation and rhythmic synchronization of gait in Huntington's disease. Mov Disord. 2001b;14:808–819. doi: 10.1002/1531-8257(199909)14:5<808::aid-mds1014>3.0.co;2-j. [DOI] [PubMed] [Google Scholar]
- Toivanen P, Snyder JS. Tapping to Bach: resonance-based modeling of pulse. Music Perception. 2003;21:43–80. [Google Scholar]
- Tzourio-Mazoyer N, Landeau B, Papathanassiou D, Crivello F, Etard O, Delcroix N, Mazoyer B, Joliot M. Automated anatomical labelling of activations in spm using a macroscopic anatomical parcellation of the MNI MRI single subject brain. Neuroimage. 2002;15:273–289. doi: 10.1006/nimg.2001.0978. [DOI] [PubMed] [Google Scholar]
- van Donkelaar P, Stein JF, Passingham RE, Miall RC. Neuronal activity in the primate motor thalamus during visually triggered and internally generated limb movements. J Neurophysiol. 1999;82:934–945. doi: 10.1152/jn.1999.82.2.934. [DOI] [PubMed] [Google Scholar]
- Yee W, Holleran S, Jones MR. Sensitivity to event timing in regular and irregular sequences: Influences of musical skill. Percept Psychophys. 1994;56:461–471. doi: 10.3758/bf03206737. [DOI] [PubMed] [Google Scholar]
- Zanto TP, Snyder JS, Large EW. Neural correlates of rhythmic expectancy. Adv Cogn Psychol. 2006;2:221–231. [Google Scholar]