

Abstract
This paper quantifies how the quality of dispersion and the quality of the interfacial interaction between TiO2 nanoparticles and host polymer independently affect benchmark properties such as glass transition temperature (Tg), elastic modulus and loss modulus. By examining these composites with differential scanning calorimetry (DSC), dynamic mechanical analysis (DMA) and scanning electron microscopy (SEM), we were able to demonstrate changes in properties depending on the adhesive/wetting or repulsive/dewetting interactions the nanoparticles have with the bulk polymer. We further quantified the dispersion of TiO2 nanoparticles in polymethylmethacrylate (PMMA) matrices by a digital-optical method and correlated those values to the degree of Tg depression compared to neat PMMA. Samples with the same weight percent of nanoparticles but better dispersion showed larger shifts in Tg.
Keywords: A. Polymer-matrix composites (PMCs), A. Nanocomposites, B. Interphase, B. Thermomechanical properties
1. Introduction
The field of composites is undergoing a transformation from the use of traditional fillers (e.g. carbon fiber) to nanoscale fillers that add unique and often multifunctional properties to the neat polymer. Because nanoparticles have extremely high surface area to volume ratios and alter the mobility of polymer chains near their interfaces, even a small addition of nanoparticles has the potential to drastically transform the properties of the host polymer. While the last decade has seen several advancements in the field of nanocomposites, some recent reviews have made it clear that definitive structure-property relationships are still lacking in the literature [1–4]. In this paper, we establish quantitative links between dispersion and interphase with mechanical and thermal properties as a step toward exacting control over these systems and intentionally designing nanocomposites with optimal macroscale properties for a given application.
There are a myriad of variables that ultimately influence a nanocomposite’s properties. These variables include the quality of dispersion [3–5], interfacial adhesion [1, 2, 6–8], extent of interphase [3, 6, 9], processing methods [2, 10], loading of the particles [2], modification of the surfaces of nanoparticles [4, 5, 11], aspect ratio of particles [2, 3, 5], compatibility of particle and host polymer [1], size of particles [12], radius of gyration of the host polymer [13], and the properties of the constituents [2, 14]. In order for researchers to design a composite with predictable properties, it is necessary to first delineate the exact influence of each of these factors and then control them. The interaction of these factors also makes it difficult to compare results between groups. As one example, Haggenmueller et al. demonstrated a 6% increase in elastic modulus for PMMA with 1 weight % single-walled carbon nanotubes (SWNTs) [15] while Ramanathan et al. demonstrated a 50% increase in elastic modulus for PMMA with 1 weight % SWNT and an 86% increase in elastic modulus for 1 weight % amide-functionalized SWNTs [9]. Ramanathan et al. attribute the discrepancy to insufficient dispersion of nanotubes or a weaker interphase in Haggenmueller’s case, but the authors were unable to provide any direct evidence. From these and other examples [16–19], it is evident that the properties of nanocomposites are highly sensitive to both the quality of dispersion and interphase and that small changes in processing conditions, particle size, or chemistry dramatically affect these two key factors.
The interphase has been extensively studied in nanocomposites, leading to an understanding of this region as an area of altered polymer chain dynamics near the surface of the nanoparticles [20–22]. Surface atoms are at a higher energy state than atoms within the interior of a material making them more interactive with surrounding molecules. In nanocomposites, polymer molecules near the interactive surface of nanoparticles experience a reduction in mobility when attracted to the nanoparticles and a concomitant increase in mobility when repelled by the nanoparticles due to increased regions of free volume. Since nanoparticles have extremely high surface area to volume ratios (1000 times greater than micrometer-sized particles), only a few weight or volume percent additions are needed to transform the properties of the entire polymer [20, 21]. The quality of the interaction between the nanoparticles and the bulk polymer (attractive/repulsive interphase) is hypothesized in this paper to alter the mechanical and thermal properties of the host polymer.
From our previous studies, we measured the static water contact angle of TiO2 as 10 degrees indicating a hydrophilic surface [23]. Since PMMA is hydrophobic, the interaction between the TiO2 nanoparticles and the surrounding PMMA is repulsive. To create an attractive interaction, we modified our nanoparticles with a biomimetic initiator modeled after 3,4-dihydroxy-L-phenylalanine (dopa), an amino acid that is highly concentrated in mussel foot adhesive proteins [24, 25]. In a previous study, we showed that the dopa to metal-oxide bond is strong and reversible even in the presence of water [26] leaving open the possibility that this surface modification will demonstrate hydrolytic stability. Further demonstrating the adhesive nature of dopa, we performed pull-out tests of metal wires from PMMA and shown an increase in maximum interfacial adhesion of 116% for NiTi wires and 60% for Ti-6Al-4V wires from a PMMA matrix when modified by dopa-initiator [23].
In addition to the interfacial interactions between the nanoparticles and the bulk polymer, it is hypothesized that the quality of dispersion has a significant influence on the bulk properties of nanocomposites. While many researchers have mentioned dispersion as an important factor in determining a nanocomposite’s properties, few have examined dispersion explicitly in their experiments and even fewer have attempted to quantify it [19, 27–31]. Bansal et al., addressed this issue directly when they demonstrated depressions in Tg with decreasing interparticle distance for silica nanoparticles in polystyrene (PS) [32]. In this system, the non-wetting behavior of the matrix led to increased molecular mobility. At the same time, Tg suppression was not observed for silica nanoparticles grafted with PS chains in bulk PS. An important concept in their work is relationship between the Tg values in thin polymer films (free standing, supported, or sandwiched) and the Tg values of nanocomposites. The authors found that a simple two-layer model was not enough to explain the experimental results and that the interaction effects of altered domains must play a role in determining Tg.
To elucidate the impact that both the interphase and the degree of dispersion of the nanoparticles have on bulk properties, we quantified these factors separately for our TiO2-polymer composites. Other researchers have studied TiO2-polymer composites for potential applications in photovoltaics/solar cells [33, 34], fuel cells [35, 36] and batteries [37], but to the best of our knowledge no studies quantifying the effects of interfacial interaction and dispersion on mechanical and thermal properties of these composites have been previously reported. First, we show that by tuning the interfacial conditions with a mimic of mussel adhesive protein so that there is an attractive interaction between nanoparticles and bulk polymer, we can increase the values of several properties including glass transition temperature and elastic modulus. Second, utilizing image processing software, we focused on the degree of dispersion of the nanoparticles to determine its influence on the glass transition temperature of the composites. We show that the quality of dispersion shifts Tg in TiO2-PMMA composites.
2. Experimental
2.1 Materials
Titanium dioxide nanoparticles (Nano Tek Titanium dioxide, average particle size ~35 nm, 80% anatase and 20% rutile) were purchased from Nanophase Technologies Corporation (Romeoville, IL). Ultrapure water (resistivity = 18.2 MΩ, pH 6.82) was obtained from a NANOpure Infinity system from Barnstead/Thermolyne Corporation (Dubuque, Iowa). Methyl methacrylate (99% MMA, Aldrich, St. Louis, MO) was passed through an activated alumina gel column to remove inhibitor before polymerization. Other materials used as received for initiator immobilization and surface initiated polymerization (SIP) include Catechol (99% Sigma), Copper (I) bromide (CuBr, 99.999%, Aldrich, St. Louis, MO), 2-bromopropionyl bromide (Waltham, MA), and N,N,N0 ,N0 ,N00 -Pentamethyldiethylenetriamine (PMDETA, 99%, Aldrich). The dopa-mimetic initiator and modified TiO2 nanoparticles were synthesized as previously described[24, 38]. For fabrication of bulk composites, Polymethylmethacrylate (PMMA) of MW 75,000 was purchased from Polysciences, Inc. (Warrington, PA). Tetrahydrofuran (THF) was obtained from Mallinckrodt Baker (Phillipsburg, NJ). Millipore nylon membrane filters of 47 mm diameter and 0.45 μm pore size were utilized from Fisher Scientific (Pittsburgh, PA).
2.2 Instrumentation
Nanocomposites were hot pressed in a Carver Auto Series press (Wabash, IN). Imaging of the nanocomposites was carried out in a LEO Gemini 1525 scanning electron microscope (SEM, Oberkochen, Germany). Composites were fractured for imaging in a MiniMat2000 miniature tensile tester from Rheometric Scientific (Piscataway, NJ). For thermodynamic characterization, a Mettler Toledo differential scanning calorimeter (DSC822e) was utilized for automatic data acquisition and analysis of glass transition temperatures (Columbus, OH). A TA Instruments Dynamic Mechanical Analyzer (DMA RSA3) was utilized to apply an oscillatory deformation to a sample and examine its bulk properties as a function of temperature (New Castle, DE). A Center for Tribology Universal Micro Materials Tester -2 (CETR UMT-2) was used to examine the coefficient of friction and wear rates of our surfaces using a ball-on-disc methodology (Campbell, CA).
2.3 Preparation of modified TiO2 nanoparticles
Complete details for the synthesis of the dopa-mimetic initiator as well as grafting PMMA from TiO2 nanoparticles by SIP are described in previous publications [24, 38].
2.4 Preparation of TiO2-PMMA bulk composites
To fabricate the nanocomposites, 0.5 g PMMA was added to 20 mL THF in one vial and the corresponding amount of modified or unmodified TiO2 was added to 20 mL THF in another vial to create the weight percent of interest. The solutions were stirred separately on a stir plate at 85 °C for approximately 15 minutes until the PMMA was fully dissolved. The solutions were combined and then ultrasonicated in a room temperature water bath for 1 hour to aid in mixing the nanoparticles with the polymer solution. The solution was then added drop-wise to 400 mL of methanol, stirring with a stir bar, in order to precipitate the composite. After the polymer composite was entirely precipitated, the solution was filtered in a vacuum through a nylon membrane to separate the solid composite from the methanol and THF. The remaining solids were dried in an aluminum pan in a vacuum oven at 135 °C for 24 hours to remove any remaining solvent.
The dried solid was placed in the center of two steel plates with 0.2 mm spacers. The steel plates were pressed at 3.5 MPa as the temperature was ramped to 200°C and held for 10 minutes before cooling to room temperature. The resultant nanocomposite was approximately 5 cm × 5 cm × 0.3 mm. The samples were cut into smaller sizes for testing in the DMA and DSC. To prepare the samples for observation in SEM, the samples were either fractured in the Minimat Tensile Tester by loading in tension at a rate of 0.5 mm/min or microtomed to a thickness of 100 nm and mounted on TEM grids for imaging. All surfaces were coated with 3 nm Au-Pd before imaging to reduce charging effects.
2.5 Thermomechanical and mechanical testing
Several samples of each type of composite were loaded into DSC for testing. The following protocol was followed under N2 flow: two cycles of heating 10 °C/min to 160 °C, holding at 160 °C for 4 minutes, cooling 10 °C/min to 60 °C. Tg was measured on the second cooling cycle. Samples of 5 cm × 4 mm × 0.3 mm size were loaded vertically into the DMA’s tension/compression rectangular clamp. The testing parameters included a frequency of 1 Hz, initial temperature of 25 °C, final temperature of 165 °C, ramp rate of 4 °C/minute, strain of 0.016%, initial static force 100 g and maximum applied strain of 1%. The strain was chosen so that the samples stayed in the linear regime during the entire temperature range of 25–165 °C.
3. Results and Discussion
3.1. Biomimetic modification of interphase correlated with Glass Transition Temperature (Tg)
A biomimetic surface functionalization inspired by mussel adhesion was employed to create nanoparticles with an attractive/wetting interaction with polymer. Figure 1 shows images of dewetting around a cluster of TiO2 nanoparticles in PMMA as well as an attractive interaction between a cluster of TiO2 nanoparticles modified with our biomimetic initiator and the surrounding PMMA. The different behavior of the two types of composites, repulsive/dewetting and attractive/wetting, should translate into measurable changes in several bulk properties. We utilized DSC and DMA to measure the Tg, elastic modulus and loss modulus of our modified and unmodified samples. The glass transition temperature is the temperature at which the polymer molecules undergo relaxation from a glassy state to a rubbery state. Because the stiffness and strength of glassy polymers are several orders of magnitude larger than their rubbery counterparts, it is desirable to have materials with a high Tg in many applications, such as for aerospace or automobiles, so that the polymer will be structurally sound during an expansive range of temperatures.
Figure 1.

SEM images of LEFT: a cluster of TiO2 nanoparticles with a repulsive/dewetting interaction with the surrounding polymer and RIGHT: a cluster of modified TiO2 nanoparticles with an attractive/wetting interaction with the surrounding polymer.
Figure 2 shows normalized tan delta curves obtained from the DMA for 3 types of composites: 2wt% TiO2 in PMMA, PMMA, and 2wt% dopa-mimetic modified TiO2 in PMMA. Tan delta is the ratio of loss modulus E″ to elastic modulus (storage modulus) E′ and its peak marks the location of Tg in a system. In Figure 2, the sample of 2wt% unmodified TiO2 in PMMA demonstrates a broadening of the tan delta peak towards lower temperatures. This result means the relaxation modes of the polymer molecules begin at a lower temperature than PMMA, but the sample still retains the overall signature of bulk PMMA and therefore is not fully altered by the interphase. The early onset of relaxation indicates a weak interaction between the nanoparticles and the surrounding polymer. In contrast, the sample of 2wt% modified TiO2 in PMMA shows a tan delta peak shift towards higher temperatures because relation modes affecting Tg are delayed. This result is not only indicative of a strong interaction between the modified nanoparticles and the surrounding polymer, but the shift of the peak also gives indirect evidence that the interphase region has percolated through the entire composite [16].
Figure 2.
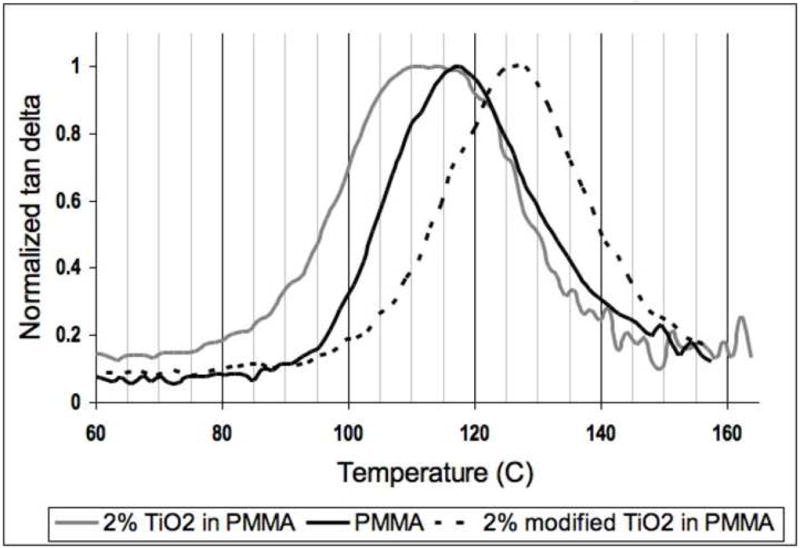
Normalized tan delta curves for samples of 2wt% TiO2 in PMMA, PMMA and 2wt% modified TiO2 in PMMA.
3.2 Biomimetic modification of interphase correlated with Elastic Modulus
We further examined the elastic modulus (E’) for our unmodified and modified samples using a DMA temperature ramp test and compared these results to the modulus values predicted by the Mori Tanaka method [39]. The micromechanics calculations treated the nanoparticles as ideally dispersed with 3D random orientation and isotropic properties and assumed that the interfacial bonding between the nanoparticles and bulk polymer was perfect. In Figure 3, the effective modulus of the composite (Ec′) is normalized against the modulus of the polymer matrix (Ep′). Experimentally, we recorded the E’ values in the glassy regime (30 °C) and in the rubbery regime (140 °C) for 14 samples of 2wt% TiO2 in PMMA. In Figure 3, the experimental results are compared to the effective modulus predicted by the micromechanics calculations for inclusions shaped as spheres, rods and sheets.
Figure 3.
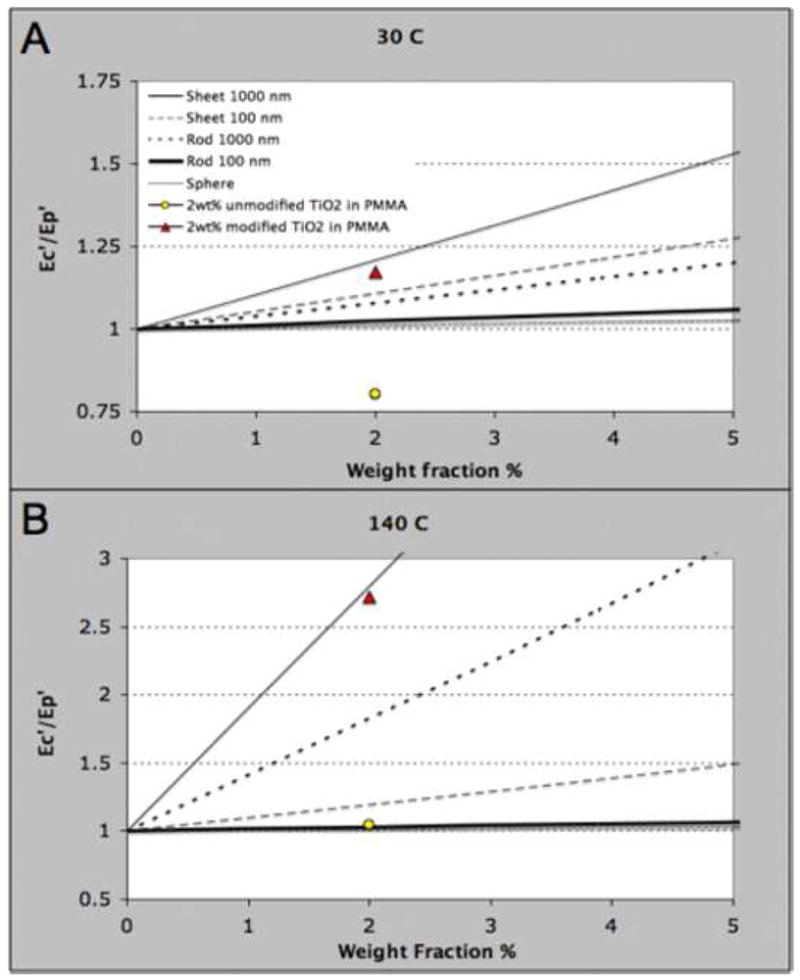
Theoretical prediction by Mori-Tanaka model for the normalized modulus values (Ec′/Ep′) of nanocomposites with inclusions shaped as spheres, rods, and sheets of different aspect ratios and at A) 30 °C and B) 140 °C. In A) and B), the theoretical prediction is displayed versus experimental results for spherical nanoparticles at 2 weight percent. In both cases, the modified spherical nanoparticles led to modulus values near those predicted for sheets with high aspect ratio (1000 nm × 1000 nm × 1 nm).
As shown in Figure 3A and 3B, spheres (aspect ratio of 1) have a much smaller reinforcing ability compared to rods (aspect ratios of 1000 and 100) or sheets (aspect ratios of 1/1000 and 1/100). The model predicts that the incorporation of only 2.5wt% of sheets (1000 nm × 1000 nm × 1 nm) are needed for the modulus of the composite (Ec′) to be three times larger than the modulus of the polymer (Ep′) at 140 °C. However, for the same improvement with spheres at 140 °C, over 80wt% is needed. Remarkably, however, our biomimetic interfacial modification on spherical nanoparticles led to an experimental value of Ec′/Ep′ that significantly exceeds the value predicted for spheres by the Mori Tanaka method at both 30 °C and 140 °C and approaches the behavior of high aspect ratio nanosheets (Figure 3A and 3B). Since the predictions used only inherent moduli of the bulk matrix material and the nanoparticles, this data suggests the existence of a significant polymer interphase region near our modified nanoparticles. Due to an attractive interaction between the nanoparticles modified with the dopa-mimetic initiator and the surrounding polymer, this region has decreased molecular mobility over that of the bulk polymer. In contrast, the unmodified particles have a repulsive interaction with the surrounding polymer, leading to a region of increased molecular mobility and a decrease in modulus.
Percolation of the interphase region is an important factor in realizing substantive changes in thermal and mechanical properties in nanocomposites. While we cannot directly measure the interphase thickness in our composites, we calculated the minimum interphase thickness needed to achieve percolation. For 2wt% TiO2 – PMMA composites (0.5vol%), the theoretical nearest neighbor distance between centers of particles is 165 nm assuming a perfectly periodic dispersion of nanoparticles with a mean diameter of 35 nm. For percolation of the interphase across this idealized composite, the interphase would need to extend at least 65 nm from the surface of the nanoparticles. By utilizing an image processing tool to obtain the coordinates of nanoclusters in SEM images of the nanocomposites, we found an actual mean nearest neighbor distance of 200–300 nm for the 2wt% TiO2 – PMMA samples (0.5vol%). In the experimental case, one would need the interphase region to extend 83–133 nm from the surface of the nanoparticles for percolation. It is reasonable that there are higher values needed for percolation in the experimental case (83–133 nm) compared to the values needed for percolation in the perfectly periodic case (65 nm) because micromechanics and finite element simulations have shown that the minimum interphase thickness for percolation is slightly higher in a random distribution than in a periodic one [40].
The complete shift in tan delta location in Figure 2 gives indirect evidence of percolation for the modified composites whereas the broadening of the tan delta peak gives indirect evidence that percolation has not been achieved for the unmodified composites. At this time, we cannot directly prove or disprove percolation in our composites. However, the theoretical interphase thickness for a periodic array (65 nm) and derived from our experiments (83–133 nm) needed for percolation at 2wt% (0.5vol%) are reasonable as Rittigstein et al. utilized model nanocomposites to demonstrate that the length scale at which confinement effects are observed for attractive interactions can be several hundreds of nanometers [41].
3.3. Dispersion of nanoparticles correlated with glass transition temperature
In this section, we correlate the dispersion of nanoparticles to the glass transition temperature of the composites. Initially, we created several samples of 0.5wt%–20wt% TiO2 in PMMA and measured their Tg by DSC. Figure 4 summarizes the mean Tg for each type of composite and illustrates a general trend of decreasing Tg with increased loading of unmodified TiO2. As TiO2 loading increases from 0.5wt% to 20wt%, there is a 50-fold increase in the surface area available for either attractive/wetting or repulsive/dewetting interactions with the bulk polymer leading to changes in molecular mobility (shown qualitatively in Figure 1). In our unmodified system, the TiO2 nanoparticles have a repulsive interaction with the surrounding polymer and therefore there is an increase in free volume and chain mobility near the particles. Consequently, the Tg of the bulk polymer shifts to lower temperatures with the addition of unmodified TiO2 nanoparticles as it takes less energy to transition from the glassy to the rubbery regime.
Figure 4.
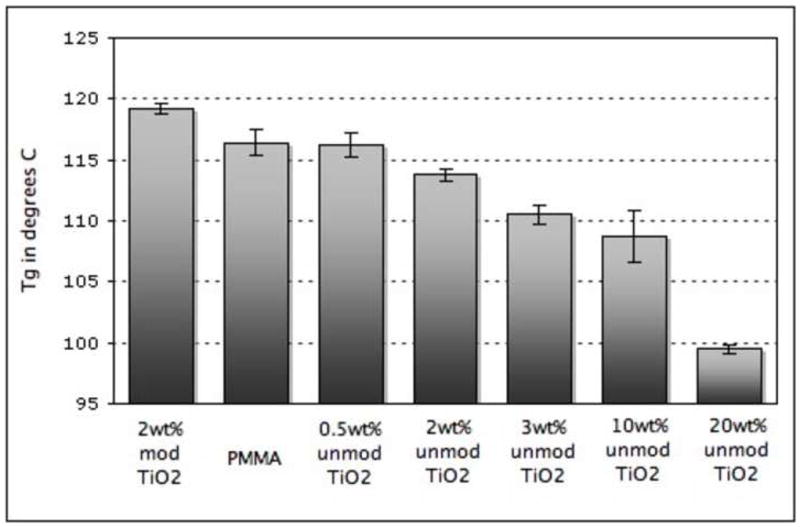
Average value of Tg for each type of composite measured by DSC. From left to right: 2wt% modified TiO2 in PMMA, PMMA control, 0.5wt% TiO2 in PMMA, 2wt% TiO2 in PMMA, 3wt% TiO2 in PMMA, 10wt% TiO2 in PMMA, 20wt% TiO2 in PMMA.
While Figure 4 gives us a correlation between weight percent and Tg, we are also interested in uncovering a correlation between dispersion and Tg. Therefore, we examined the SEM images of microtomed surfaces as well as fractured surfaces of the composites with the commercial software MetaMorph, a powerful image processing and analysis program that is most often used to analyze images of cells. We used MetaMorph for efficient and unbiased determination of coordinates of agglomerates for subsequent statistical analysis. For each ~100 nm thick slice, up to 12 SEM images were analyzed. MetaMorph determined the centroid of each agglomerate within each image. Using this data set, we used a straightforward program in Matlab to calculate the mean distance between centroids for each agglomerate in an image from which the overall mean distance between agglomerates for each image can be calculated. This method was more accurate for low weight percents because MetaMorph was unable to distinguish clusters at high loading levels. The mean distance between the centroid of each agglomerate within each image is calculated using,
| Equation 1 |
where n is the total number of agglomerates in the image, (xj, yj) are the coordinates of the agglomerate of interest, and (xi, yi) are the coordinates of every other agglomerate in the image. The calculation does not include the null distance between an agglomerate and itself. To avoid errors due to the edge of the image, we screened 25% of the area along the perimeter of each image and collect d̄j only for the inner subset of agglomerates. Equation 1 yields an array of mean distances between the centroids of each agglomerate in an image, d̄ j. However, the mean distance between agglomerates, D̄, for each image still needed to be calculated:
| Equation 2 |
Finally, the mean distance between agglomerates for each type of sample, Ā, was determined by averaging D̄ across the number of SEM Images analyzed, N:
| Equation 3 |
Values of Ā for 2wt% modified TiO2 in PMMA, PMMA, 2wt% unmodified TiO2 in PMMA, and 3wt% TiO2 in PMMA are provided in Table 1 along with Tg. It is important to note that Ā is the average distance between agglomerates and should not be confused with the mean nearest neighbor distance that was reported earlier to be 200–300 nm. Ā takes into account distances between all agglomerates in the image whereas nearest neighbor distance only takes into account the distance to the nearest agglomerate.
Table 1.
Summary of Tg, and quality of dispersion for two samples of each type of composite
| Type of sample | Sample | Tg (°C) | Ā, mean distance between agglomerates (μm) |
|---|---|---|---|
| 2wt% modified TiO2 in PMMA | 1 | 119.2 +/− 0.47 | 4.13 +/− 0.25 |
| 2 | 120.7 +/− 1.58 | 3.78 +/− 0.18 | |
| PMMA | 1 | 116.4 +/− 1.07 | N/A |
| 2wt% TiO2 in PMMA | 1 | 113.8 +/− 0.55 | 3.98 +/− 0.03 |
| 2 | 115.0 +/− 0.65 | 3.84 +/− 0.33 | |
| 3wt% TiO2 in PMMA | 1 | 110.5 +/− 0.78 | 4.16 +/− 0.14 |
| 2 | 116.6 +/− 0.69 | 4.60 +/− 0.29 |
An examination of Table 1 shows that substantive differences in Tg were observed even when weight percent (volume percent) were held constant and even though experimental processing conditions were held constant from batch-to-batch. For instance, Sample 1 of 2wt% modified TiO2 in PMMA had a Tg of 119.2 °C while Sample 2 had a Tg of 120.7 °C. These differences in thermomechanical properties emphasize the need for stringent control over the factors mentioned in the introduction that affect the properties of nanocomposites. Since we discovered that dispersion and interfacial modification affect bulk properties and we controlled the properties of the constituents in our composite, the weight percent of nanoparticles and the aspect ratio of the nanoparticles, we speculate that the different dispersions observed in this work may have resulted from slightly different sonication or mixing times or small differences in the rate of addition of the nanoparticles during our solution-based fabrication method.
A close examination of the relationship between Tg and Ā for each type of sample reveals the beginning of a trend in Table 1. The dispersion of the nanoparticles is quantified by the mean distance between agglomerates with better dispersion marked by smaller values of Ā. For the samples of 2wt% modified TiO2 in PMMA in Table 1, a decrease in Ā yielded an increase in Tg due to the adhesive interfacial region. For the samples of 2wt% TiO2 in PMMA, no statistical difference was observed for Tg or Ā. For the samples of 3wt% TiO2 in PMMA, a decrease in Ā yielded a decrease in Tg due to the repulsive interfacial region.
Figure 5 provides a look at the fractured samples of 3wt% TiO2 in PMMA. Image A is from sample 1 in Table 1 with a mean Tg of 110.5 °C and Image B is from sample 2 and has a mean Tg of 116.6 °C. Figure 5 shows that fracture emanated from each cluster of nanoparticles and left behind a pattern of ridges or crazes that serve to bridge the polymer just before complete fracture. Crazing is known to nucleate from defects in highly stressed glassy polymers such as PMMA or polystyrene (PS) that have low fracture toughness associated with the breakdown of the van der Vaals forces [42]. Sample 1, which has a finer dispersion of TiO2 agglomerates based on the fracture surface imaging in Figure 5, has a smaller mean distance between agglomerates, Ā, of 4.16 +/− 0.14 μm compared to sample 2 which has an Ā value of 4.60 +/− 0.29 μm. The smaller distance between TiO2 clusters in sample 1 indicates there is more nanoparticle surface area available for contact with the bulk polymer. In a composite with a repulsive/dewetting interaction between nanoparticles and host polymer, such as in our TiO2-PMMA systems, this increased surface area results in a larger depression in Tg.
Figure 5.
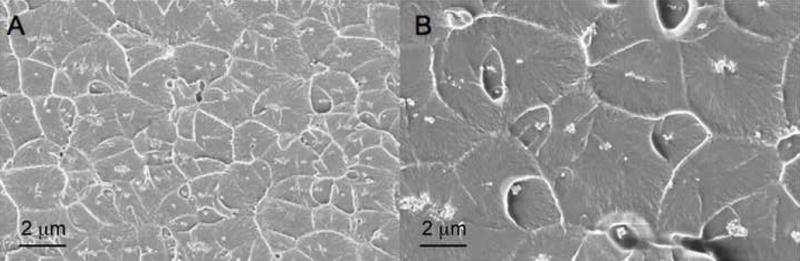
Comparison of SEM images (20 kX) of 3wt% TiO2 in PMMA: a) Sample 1 (Tg = 110.5 °C) fractured in tension, b) Sample 2 (Tg = 116.6 °C) fractured in tension. Scale bar represents 2 μm.
These results demonstrate the value of quantification of the particle dispersion via a simple digital-optical method to understand dispersion quality and consistency and therefore to elucidate the impact these nanoparticles have on the bulk properties of the nanocomposites. While the above analysis indicates a trend of increases and decreases in Tg related to increases and decreases in dispersion, more data must be collected before any definitive conclusions can be drawn. In this paper, the use of MetaMorph for analysis of dispersion is meant as an example of one way to enable researchers to use a quantified description of the dispersion in their samples rather than relying solely on qualitative descriptors and comparisons.
4. Conclusions
We synthesized nanocomposites of spherical TiO2 in PMMA in order to systematically determine the effects of particle loading, interfacial adhesion, and quality of dispersion on the bulk properties. To focus on interfacial adhesion, we utilized a promising grafting method with a coupling agent modeled after the adhesive proteins in marine mussels. This initiator is especially promising because of dopa’s demonstrated strong adherence to metal-oxides at the molecular level [26] as well as at the macroscale level [23] and dopa’s role in stable and robust adhesion in aqueous and turbulent environments [43, 44]. From DMA and DSC, we determined that the biomimetic surface modification of TiO2 nanoparticles led to an increase in glass transition temperature and elastic modulus for the nanocomposites over the neat polymer. In contrast, composites synthesized using unmodified particles led to a decrease in these properties. By comparing to Mori Tanaka simulations, we theorized that the changes in elastic modulus will be even greater with the addition of particles with higher aspect ratios (rods and sheets versus spheres).
To address the influence of dispersion on the bulk properties of nanocomposites, we focused on the glass transition temperature data for a series of loading fractions of TiO2 in PMMA. Tg is an attractive target property because of its high sensitivity to chain mobility and its use as a benchmark in other studies. We measured the Tg through DSC of several samples and recorded variability in the measured values within and across weight percents. Across weight percents, we showed a decrease in Tg as weight percent of the unmodified nanoparticles increased. SEM images of both fractured surfaces and microtomed slices of the samples were examined to investigate the batch-to-batch variability among a given weight percent. As the degree of dispersion improved (finer scale agglomerations), the glass transition temperature was depressed for samples of unmodified TiO2 nanoparticles in PMMA and increased for samples of modified TiO2 nanoparticles in PMMA. These results indicate that the quality of dispersion shifts Tg but the direction of shifts depends on the interfacial interaction of the nanoparticles with the matrix. This study indicates that the bulk properties of nanocomposites are highly sensitive to both the quality of the interfacial interaction and quality of dispersion of the nanoparticles and that these factors must be controlled to create nanocomposites with specific and predictable behavior.
Acknowledgments
This research was supported by NIH (DE 018350) and NASA (BIMat URETI NCC-1-02037). LMH is supported by the National Science Foundation through a graduate research fellowship and by Northwestern University through a Presidential Fellowship. The SEM and TEM imaging was performed in the EPIC facility of the NUANCE Center that is supported by NSF-NSEC, NSF-MRSEC, Keck Foundation, the State of Illinois, and Northwestern University.
Footnotes
Publisher's Disclaimer: This is a PDF file of an unedited manuscript that has been accepted for publication. As a service to our customers we are providing this early version of the manuscript. The manuscript will undergo copyediting, typesetting, and review of the resulting proof before it is published in its final citable form. Please note that during the production process errors may be discovered which could affect the content, and all legal disclaimers that apply to the journal pertain.
References
- 1.Rong MZ, Zhang MQ, Ruan WH. Surface modification of nanoscale fillers for improving properties of polymer nanocomposites: a review. Mat Sci Tech. 2006;22(7):787–796. [Google Scholar]
- 2.Tjong SC. Structural and mechanical properties of polymer nanocomposites. Mat Sci Eng R-Rep. 2006;53(3–4):73–197. [Google Scholar]
- 3.Schadler LS, Kumar SK, Benicewicz BC, Lewis SL, Harton SE. Designed interfaces in polymer nanocomposites: a fundamental viewpoint. MRS Bull. 2007;32(4):335–340. [Google Scholar]
- 4.Balazs AC, Emrick T, Russell TP. Nanoparticle polymer composites: Where two small worlds meet. Science. 2006;314(5802):1107–1110. doi: 10.1126/science.1130557. [DOI] [PubMed] [Google Scholar]
- 5.Krishnamoorti R. Strategies for dispersing nanoparticles in polymers. MRS Bull. 2007;32(4):341–347. [Google Scholar]
- 6.Pukanszky B. Interfaces and interphases in multicomponent materials: past, present, future. Euro Poly J. 2005;41(4):645–662. [Google Scholar]
- 7.Smith N, Antoun G, Ellis A, Crone W. Improved adhesion between nickel-titanium shape memory alloy and a polymer matrix via silane coupling agents. Comp Part A, App Sci Manuf. 2004;35(11):1307–1312. [Google Scholar]
- 8.Eitan A, Fisher FT, Andrews R, Brinson LC, Schadler LS. Reinforcement mechanisms in MWCNT-filled polycarbonate. Comp Sci Tech. 2006;66(9):1162–1173. [Google Scholar]
- 9.Ramanathan T, Liu H, Brinson LC. Functionalized SWNT/polymer nanocomposites for dramatic property improvement. J Polym Sci Part B. 2005;43(17):2269–2279. [Google Scholar]
- 10.Hussain F, Hojjati M, Okamoto M, Gorga RE. Review article: Polymer-matrix nanocomposites, processing, manufacturing, and application: An overview. J Comp Mat. 2006;40(17):1511–1575. [Google Scholar]
- 11.Wilson KS, Allen AJ, Washburn NR, Antonucci JM. Interphase effects in dental nanocomposites investigated by small-angle neutron scattering. J Biomed Res Part A. 2007;81A(1):113–123. doi: 10.1002/jbm.a.30975. [DOI] [PubMed] [Google Scholar]
- 12.Chen Y, Zhou S, Yang H, Gu G, Wu L. Preparation and characterization of nanocomposites polyurethane. J Coll Int Sci. 2004;276(2):370–378. doi: 10.1016/j.jcis.2004.06.074. [DOI] [PubMed] [Google Scholar]
- 13.Gupta S, Zhang Q, Emrick T, Balazs AC, Russell TP. Entropy-driven segregation of nanoparticles to cracks in multilayered composite polymer structures. Nat Mat. 2006;229(5) [Google Scholar]
- 14.Kubacka A, Serrano C, Ferrer M, Lunsdorf H, Bielecki P, Cerrada ML, Fernandez-Garcia M, Fernandez-Garcia M. High-Performance Dual-Action Polymer-TiO2 Nanocomposite Films via Melting Processing. Nano Lett. 2007 doi: 10.1021/nl0709569. [DOI] [PubMed] [Google Scholar]
- 15.Haggenmueller R, Gommans HH, Rinzler AG, Fischer JE, Winey KI. Aligned single-wall carbon nanotubes in composites by melt processing methods. Chem Phys Lett. 2000;330(3–4):219–225. [Google Scholar]
- 16.Ramanathan T, Stankovich S, Dikin DA, Liu H, Shen H, Nguyen ST, Brinson LC. Graphitic nanofillers in PMMA nanocomposites - An investigation of particle size influence on nanocomposite and dispersion and their properties. J Poly Sci Part B - Poly Phys. 2007;45(15):2097–2112. [Google Scholar]
- 17.Schadler L. Nanocomposites - Model interfaces. Nat Mat. 2007;6(4):257–258. doi: 10.1038/nmat1873. [DOI] [PubMed] [Google Scholar]
- 18.Schadler LS, Brinson LC, Sawyer WG. Polymer nanocomposites: A small part of the story. JOM. 2007;59(3):53–60. [Google Scholar]
- 19.Wakabayashi K, Pierre C, Dikin DA, Ruoff RS, Ramanathan T, Brinson LC, Torkelson JM. Polymer-graphite nanocomposites: Effective dispersion and major property enhancement via solid-state shear pulverization. Macromol. 2008;41(6):1905–1908. [Google Scholar]
- 20.Liu H, Brinson LC. A hybrid numerical-analytical method for modeling the viscoelastic properties of polymer nanocomposites. J App Mech - Trans ASME. 2006;73(5):758–768. [Google Scholar]
- 21.Liu H, Brinson LC. Reinforcing efficiency of nanoparticles: A simple comparison for polymer nanocomposites. Comp Sci Tech. 2008;68(6):1502–1512. [Google Scholar]
- 22.Ding W, Eitan A, Fisher FT, Chen X, Dikin DA, Andrews R, Brinson LC, Schadler LS, Ruoff RS. Direct observation of polymer sheathing in carbon nanotube-polycarbonate composites. Nano Lett. 2003;3(11):1593–1597. [Google Scholar]
- 23.Hamming LM, Fan XW, Messersmith PB, Brinson LC. Mimicking mussel adhesion to improve interfacial properties in composites. Comp Sci Tech. 2008;68(9):2042–2048. doi: 10.1016/j.compscitech.2008.02.036. [DOI] [PMC free article] [PubMed] [Google Scholar]
- 24.Fan X, Lin L, Dalsin J, Messersmith P. Biomimetic anchor for surface-initiated polymerization from metal substrates. JACS. 2005;127(45):15843–15847. doi: 10.1021/ja0532638. [DOI] [PubMed] [Google Scholar]
- 25.Fan X, Lin L, Messersmith P. Surface-initiated polymerization from TiO2 nanoparticle surfaces through a biomimetic initiator: A new route toward polymer-matrix nanocomposites. Composites Science and Technology. 2006;66(9):1198–1204. [Google Scholar]
- 26.Lee H, Scherer NF, Messersmith PB. Single-molecule mechanics of mussel adhesion. PNAS. 2006;103(35):12999–13003. doi: 10.1073/pnas.0605552103. [DOI] [PMC free article] [PubMed] [Google Scholar]
- 27.Zhang QH, Fang F, Zhao X, Li YZ, Zhu MF, Chen DJ. Use of dynamic rheological behavior to estimate the dispersion of carbon nanotubes in carbon nanotube/polymer composites. J Phys Chem B. 2008;112(40):12606–12611. doi: 10.1021/jp802708j. [DOI] [PubMed] [Google Scholar]
- 28.Tiwari RR, Natarajan U. Effect of Organic Modifiers and Silicate Type on Filler Dispersion, Thermal, and Mechanical Properties of ABS-Clay Nanocomposites. J App Poly Sci. 2008;110(4):2374–2383. [Google Scholar]
- 29.Xu JQ, Bartels JW, Bohnsack DA, Tseng TC, Mackay ME, Wooley KL. Hierarchical Inorganic-Organic Nanocomposites Possessing Amphiphilic and Morphological Complexities: Influence of Nanofiller Dispersion on Mechanical Performance. Adv Funct Mat. 2008;18(18):2733–2744. [Google Scholar]
- 30.Fujigaya T, Nakashima N. Methodology for homogeneous dispersion of single-walled carbon nanotubes by physical modification. Polym J. 2008;40(7):577–589. [Google Scholar]
- 31.Masuda J, Torkelson JM. Dispersion and major property enhancements in polymer/multiwall carbon nanotube nanocomposites via solid-state shear pulverization followed by melt mixing. Macromol. 2008;41(16):5974–5977. [Google Scholar]
- 32.Bansal A, Yang HC, Li CZ, Cho KW, Benicewicz BC, Kumar SK, Schadler LS. Quantitative equivalence between polymer nanocomposites and thin polymer films. Nat Mat. 2005;4(9):693–698. doi: 10.1038/nmat1447. [DOI] [PubMed] [Google Scholar]
- 33.Qiao QQ, Xie Y, McLeskey JT. Organic/inorganic polymer solar cells using a buffer layer from all-water-solution processing. J Phys Chem C. 2008;112(26):9912–9916. [Google Scholar]
- 34.Dridi C, Barlier V, Chaabane H, Davenas J, Ben Ouada H. Investigation of exciton photodissociation, charge transport and photovoltaic response of poly(N-vinyl carbazole): TiO2 nanocomposites for solar cell applications. Nanotech. 2008;19(37):11. doi: 10.1088/0957-4484/19/37/375201. [DOI] [PubMed] [Google Scholar]
- 35.Yang CC, Chiu SJ, Lee KT, Chien WC, Lin CT, Huang CA. Study of poly(vinyl alcohol)/titanium oxide composite polymer membranes and their application on alkaline direct alcohol fuel cell. J Power Sources. 2008;184(1):44–51. [Google Scholar]
- 36.Abbaraju RR, Dasgupta N, Virkar AV. Composite Nafion Membranes Containing Nanosize TiO2/SnO2 for Proton Exchange Membrane Fuel Cells. J Electrochem Soc. 2008;155(12):B1307–B1313. [Google Scholar]
- 37.Ahn JH, Wang GX, Liu HK, Dou SX. Nanoparticle-dispersed PEO polymer electrolytes for Li batteries; 11th International Meeting on Lithium Batteries; Monterey, California: Elsevier Science Bv; 2002. pp. 422–426. [Google Scholar]
- 38.Fan X, Lin L, Messersmith P. Surface-initiated polymerization from TiO2 nanoparticle surfaces through a biomimetic initiator: A new route toward polymer-matrix nanocomposites. Comp Sci Tech. 2006;66(9):1198–1204. [Google Scholar]
- 39.Mori T, Tanaka K. Act Metall. 1973:21571–574. [Google Scholar]
- 40.Qiao R, Brinson LC. Simulation of interphase percolation and gradients in polymer nanocomposites. Comp Sci Tech. 2009;69(3–4):491–499. [Google Scholar]
- 41.Rittigstein P, Priestley RD, Broadbelt LJ, Torkelson JM. Model polymer nanocomposites provide an understanding of confinement effects in real nanocomposites. Nat Mat. 2007:6278–282. doi: 10.1038/nmat1870. [DOI] [PubMed] [Google Scholar]
- 42.Bucknall CB. New criterion for craze initiation. Polymer. 2007;48(4):1030–1041. [Google Scholar]
- 43.Lin Q, Gourdon D, Sun C, Holten-Andersen N, Anderson TH, Waite JH, Israelachvili JN. Adhesion mechanisms of the mussel foot proteins mfp-1 and mfp-3. PNAS. 2007;104(10):3782–3786. doi: 10.1073/pnas.0607852104. [DOI] [PMC free article] [PubMed] [Google Scholar]
- 44.Waite JH. Adhesion a la Moule. Int Comp Bio. 2002;42(6):1172–1180. doi: 10.1093/icb/42.6.1172. [DOI] [PubMed] [Google Scholar]