

Abstract
The aim of this study was to compare the patterns of grey and white matter atrophy on MRI in autopsy confirmed PSP and CBD, and to determine whether the patterns vary depending on the clinical syndrome. Voxel-based morphometry was used to compare patterns of atrophy in 13 PSP and 11 CBD subjects and 24 controls. PSP and CBD subjects were also subdivided into those with a dominant dementia or extrapyramidal syndrome. PSP subjects showed brainstem atrophy with involvement of the cortex and underlying white matter. Frontoparietal grey and subcortical grey matter atrophy occurred in CBD. When subdivided, PSP subjects with an extrapyramidal syndrome had more brainstem atrophy and less cortical atrophy than CBD subjects with an extrapyramidal syndrome. PSP subjects with a dementia syndrome had more subcortical white matter atrophy than CBD subjects with a dementia syndrome. These results show regional differences between PSP and CBD that are useful in predicting the underlying pathology, and help to shed light on the in vivo distribution of regional atrophy in PSP and CBD.
Keywords: Progressive supranuclear palsy, corticobasal degeneration, magnetic resonance imaging, pathology, white matter, grey matter, dementia, parkinsonism, extrapyramidal
1. Introduction
Progressive supranuclear palsy (PSP) and corticobasal degeneration (CBD) are neurodegenerative diseases that were both initially described as distinct clinicopathological entities [41, 50]. The cardinal clinical features of PSP are a symmetric akinetic-rigid syndrome with vertical supranuclear gaze palsy and early falls[9, 15, 31, 32], while in CBD the cardinal features are asymmetric apraxia, dystonia, cortical sensory loss, and Parkinsonism[4, 30]. Both PSP and CBD were initially considered an extrapyramidal disorder.
Over the last decade however there have been numerous reports of “atypical” clinical presentations of pathologically confirmed PSP and CBD [5, 24-26, 34, 44, 52, 53, 57]. Both entities can present as a predominant motor or dementia disorder [2]. In one series dementia was the most common presentation of CBD [17]. Therefore, it is now recognized that PSP and CBD can present either as a predominant extrapyramidal/motor disorder, or as a predominant dementia disorder.
Clinical syndromes are defined by a set of relatively specific signs and symptoms which result from dysfunction or damage to specific anatomical structures. In neurodegenerative diseases however, the relationship between specific clinical syndromes and pathological diagnoses remains unclear[26]. It is also unclear whether a specific clinical syndrome, e.g. a dementia syndrome, arising from either PSP or CBD has the same anatomic correlate.
Therefore, the aims of this study were to (1) compare the patterns of grey and white matter atrophy on MRI using voxel-based morphometry (VBM) in a group of autopsy confirmed PSP subjects to a group of autopsy confirmed CBD subjects, (2) to determine whether the patterns of atrophy in a dementia syndrome arising from PSP is identical to those from a dementia syndrome arising from CBD, and (3) to determine whether the patterns of atrophy in an extrapyramidal syndrome arising from PSP is identical to those from a extrapyramidal syndrome arising from CBD.
2. Methods
From our pathological database located in Rochester, Minnesota, we identified all subjects with autopsy confirmed CBD (N=21) and PSP (N=52) between January 1st 1970 and December 31st 2005. Detailed clinical information on all of these 73 cases (except for three recent cases) was previously published [26]. All cases were followed as part of the Mayo Clinic Alzheimer's Disease Research Center (ADRC), or the Alzheimer's disease Patient Registry (ADPR) and all diagnoses were made prospectively. The historical records were reviewed by a clinician versed in movement disorders and dementia (KAJ), blinded to pathological diagnosis, for the abstraction of data, including gender, education, age at onset, illness duration, short test of mental status (STMS)[29], Hoehn and Yahr scale score[23], Mattis Dementia Rating Scale score (DRS)[21], the Clinical Dementia Rating (CDR)[35] scores (sum of boxes and global scores) and the signs and symptoms recorded in the historical records by the treating physician at the time of MRI scan. We included only subjects that had been evaluated and treated by a neurodegenerative specialist. We excluded any subject who did not have a volumetric MRI scan. Of the 21 cases of CBD, 11 met our inclusion and exclusion criteria while 13 of the PSP subjects met criteria. Each case was age and gender matched to a normal control (total n=24). In addition, a fluid attenuated inversion recovery (FLAIR) sequence from each subject was assessed by an experienced neuroradiologist (CRJ) in order to evaluate the degree of white matter disease burden. The white matter disease burden was found to be negligible in all cases. The MRI scans of all the CBD subjects were visually inspected to determine asymmetry. Four CBD subjects had greater involvement of the left hemisphere, four had greater involvement of the right hemisphere, and three showed a symmetric pattern.
2.1 Pathological analysis
All 24 cases had died after 1991 and neuropathological examinations were performed according to the recommendations of the Consortium to Establish a Registry for Alzheimer's disease[33]. After removal of the brain, one hemisphere was fixed in 10% buffered formaldehyde for 7-10 days followed by the taking of 7μ sections. Routinely sampled areas were the middle frontal gyrus (Brodmann area, BA, 9), inferior parietal lobule (BA 17), anterior temporal gyrus (BA 24), hippocampus at the level of the lateral geniculate, amygdala, transentorhinal and entorhinal cortices at the level of the mamillary bodies, nucleus basalis, cerebellum, dorsomedial thalamus with subthalamic nucleus, midbrain with substantia nigra, pons, and medulla. All samples were processed in paraffin and had been stained with hematoxylin and eosin, glial fibrillary acid protein and modified Bielschowsky or Bodian silver. Immunohistochemical analysis was also performed with a battery of antibodies: glial fibrillary acid protein (clone GA5, 1:1000; BioGenex, San Ramon, CA) and either CD68 (clone PG-M1, 1:1000; DAKO, Carpenteria, CA) or HLA-DR (LN-3, 1:5; ICN, Costa Mesa, CA) for microglia. Neuronal pathology was studied with antibodies to neurofilament protein (NF-L: clone 2F11, 1:75; DAKO, Carpenteria, CA; NF-H: clone SMI-31, 1:2000; Sternberger Monoclonals, Lutherville, MD); ubiquitin (clone Ubi-1 (MAB1510), 1:250; Chemicon, Temecula, CA); alpha-synuclein LB509, 1:200; Zymed, South San Francisco, CA or NACP98, polyclonal antibody, 1:2000; Mayo Clinic Jacksonville), phospho-tau (CP13: gift from Dr. Peter Davis, Albert Einstein College of Medicine, Bronx, NY or clone AT8, 1:1000; Innogenetics, Alpharetta, GA).
All brain tissue slides had been reviewed independently by two neuropathologists with expertise in degenerative diseases (DWD and JEP) to confirm that the pathological diagnosis met recent published pathological criteria for PSP and CBD[13, 20]. PSP was diagnosed if there were neurofibrillary tangles, coiled bodies, neuronal and glial threads, and tufted astrocytes in cardinal nuclei[20], while CBD was diagnosed if there were corticobasal bodies, balloon neurons, coiled bodies, an abundance of neuronal and glial threads and astrocytic plaques in cardinal nuclei[13].
2.2 Subgroup classification
Within each pathological subtype subjects were sub-grouped according to whether extrapyramidal signs, or cognitive impairment, dominated the clinical syndrome at the time of MRI scan. The presence or absence of a list of six core features of cognitive impairment, and six core features of motor dysfunction was confirmed for each subject, and a score was given from 0-6 for both dementia and extrapyramidal features. The six features of dementia included impairment in orientation, memory, visuospatial skills, attention, language, and learning. The features of motor impairment included akinesia, rigidity, tremor, postural instability, praxis, and dystonia. The subjects were then placed in a specific subgroup based on whether the number of dementia features present, or the number extrapyramidal features present, yielded the higher score. In the event of a tie, the severity of the signs present was then entered into the model to place them into a subgroup. This was possible because each subject had a standardized mental status examination, the Short Test of Mental Status[29], and a standardized Motor Examination from the Department of Neurology, Mayo Clinic[11] where each feature is documented and given a score from 0-3 based on severity. Therefore, subjects could have a clinically dominant ‘dementia’ syndrome and pathologically confirmed PSP (D-PSP) or a clinically dominant dementia syndrome and pathologically confirmed CBD (D-CBD). Equally likely, subjects could have clinically dominant extrapyramidal features and pathologically confirmed PSP (E-PSP) or clinically dominant extrapyramidal features and pathologically confirmed CBD (E-CBD). An equal score occurred in only three subjects, two with CBD and one with PSP.
2.3 Image analysis
In all subjects T1-weighted volumetric MRI scans were acquired at 1.5T (22×16.5cm FOV, 25° flip angle, 124 contiguous 1.6mm thick coronal slices). If a patient had more than one MRI then we used the closest scan of adequate quality to the time of first neurological evaluation. Patterns of cerebral atrophy were assessed using the automated and unbiased technique of VBM [1]. An optimized method of VBM was applied using both customized templates and prior probability maps [48], implemented using SPM2 (http://www.fil.ion.ucl.ac.uk/spm). In order to generate the customized templates and priors all patient scans, plus age and gender-matched healthy controls, were registered to the MNI template using a 12 degrees of freedom (dof) affine transformation and segmented into grey matter (GM), white matter (WM) and CSF using MNI priors. GM images were normalized to the MNI GM prior using a nonlinear discrete cosine transformation (DCT). The normalization parameters were applied to the original whole head and the images were segmented using the MNI priors. Average images were created of whole head, GM, WM and CSF, and smoothed using 8mm full-width at half-maximum (FWHM) smoothing kernel. All images were then registered to the customized whole brain template using a 12dof affine transformation and segmented using the customized priors. The GM images were normalized to the custom GM prior using a nonlinear DCT. The normalization parameters were then applied to the original whole head and the images were segmented once again using the customized priors. All images were modulated and smoothed with a 10mm FWHM smoothing kernel. One-sided T-tests were used to assess the patterns of grey and white matter atrophy in the subjects with CBD and PSP compared to the control subjects, and to assess the patterns of grey and white matter atrophy in subgroups of subjects with D-PSP, D-CBD, E-PSP and E-CBD. Age was included in the model as a nuisance variable. Grey and white matter differences were assessed at an uncorrected statistical threshold of p<0.001. In addition, the results were also assessed after correction for multiple comparisons using the false discovery rate (FDR)[14] at a threshold of p<0.01. The FDR correction controls the expected proportion of false positives among suprathreshold voxels. This correction is more appropriate for structural data than the more conservative Bonferroni based family-wise error correction which controls the chance of any false positives over the entire volume.
2.4 Semiquantitation of VBM atrophy patterns
The amount of atrophy of the cortical grey matter, subcortical grey and white matter, and brainstem, identified on VBM was then visually rated by a neurodegenerative VBM expert (JLW) on a 5-point scale: 0 = no atrophy, 0/+ = scant amount of atrophy, + = mild atrophy, ++ = moderate, and +++ = severe.
2.5 Statistical Analysis
Statistical analyses were performed utilizing the JMP computer software (JMP Software, version 5.1.2; SAS Institute Inc, Cary, NC) with statistical significance set at p < 0.05. Kruskal-Wallis test was used to compare continuous data between the disease groups and the control group. Two group comparisons were conducted using the Mann-Whitney U test. Gender ratios were compared using a Chi-squared test and Fisher's exact test for cells with small numbers.
3. Results
3.1 Subject demographics
Table 1 compares the demographics and features of the 13 autopsy confirmed PSP subjects, the 11 autopsy confirmed CBD subjects and 24 controls. The CBD group had more motor disability than the PSP group as shown by the Hoehn and Yahr scale score (p<0.05) but both groups did not differ in any of the other demographic features. Both groups were different from controls on Hoehn and Yahr, CDR sum of boxes, CDR global score, and the DRS. Tables 2 and 3 show the demographic features of the PSP and CBD subjects that presented with an extrapyramidal disorder versus a dementia disorder. The E-PSP subgroup had a greater deficit on the Hoehn and Yahr scale score than the D-PSP subgroup (p<0.05, Table 2). Similarly, the E-CBD subgroup had a greater deficit on the Hoehn and Yahr scale score than the E-CBD subgroup (p<0.05, Table 3). There were no differences between the E-PSP and E-CBD subgroups or between the D-PSP and D-CBD subgroups.
Table 1. Comparison of features between autopsy confirmed CBD, PSP and controls.
| PSP | CBD | Controls | |
|---|---|---|---|
| N | 13 | 11 | 24 |
| Male/Female | 5/8 | 4/7 | 9/15 |
| Education | 13 (10-18) | 12 (8-16) | 13 (8-20) |
| Age at onset | 69 (52-84) | 66 (52-72) | NA |
| Total illness duration | 7 (4-10) | 6 (4-8) | NA |
| Age at Scan | 71 (55-85) | 69 (55-75) | 68.5 (55-84) |
| STMS score | 31 (20-36) | 25 (22-29) | |
| Hoehn and Yahr Scale scores*,Ψ | 1.25 (0-3) | 2 (0-5) | 0 (0-0) |
| CDR scale, sum of boxes* | 4 (0-10) | 6.75 (2-7.5) | 0 (0-0) |
| CDR scale, global* | 1 (0-2) | 1 (0.5-1) | 0 (0-0) |
| Dementia rating scale* | 124 (97-140) | 114 (96-129) | 139 (128-143) |
Data reported as medians (range)
STMS = Short Test of Mental Status; CDR = clinical dementia rating; NA = not applicable
Kruskal-Wallis shows significant difference between all three groups p<0.0001
Significant difference between PSP and CBD p<0.05
Table 2. Comparison of demented and extrapyramidal PSP and CBD subjects.
| PSP | CBD | |||
|---|---|---|---|---|
| Extrapyramidal | Dementia | Extrapyramidal | Dementia | |
| N | 5 | 8 | 5 | 6 |
| Male/Female | 3/5 | 2/6 | 0/5 | 4/2 |
| Education | 12 (10-18) | 14.5 (10-18) | 12 (8-12) | 12 (8-20) |
| Age at onset | 62 (52-79) | 71.5 (53-84) | 68 (61-72) | 64.5 (52-69) |
| Total illness duration | 7 (4-8) | 8.5 (5-10) | 6 (5-8) | 4.5 (4-7) |
| Age at Scan | 67 (58-81) | 75.5 (55-85) | 71 (66-75) | 68 (55-70) |
| STMS score* | 31 (24-35) | 29.5 (20-36) | 25.5 (23-28) | 25 (22-29) |
| Hoehn and Yahr Scale scores*Ψ | 2.5 (1.5-3) | 0 (0-1) | 2.75 (1-5) | 0 (0-2) |
| CDR scale, sum of boxes* | 4.0 (1-8.5) | 3.5 (0-10) | 7 (6.5-7) | 2.5 (2-7.5) |
| CDR scale, global* | 1 (0.5-1) | 0.75 (0-2) | 1 (1-1) | 0.5 (0.5-1) |
| Dementia rating scale* | 132 (124-140) | 112 (97-125) | 119.5(114-125) | 109 (96-129) |
Data reported as medians (range)
STMS = Short Test of Mental Status; CDR = clinical dementia rating
Performed at time of scan
Significant difference between E-PSP and D-PSP, and between E-CBD and D-CBD (p<0.001)
Table 3. Differences in cortical, subcortical and brainstem patterns of atrophy across the PSP and CBD groups.
| REGIONS | PSP | CBD | ||||
|---|---|---|---|---|---|---|
| ALL | Extrapyramidal | Dementia | ALL | Extrapyramidal | Dementia | |
| Cortical grey | ++ | + | ++ | +++ | ++ | +++ |
| Subcortical white | ++ | + | ++ | + | ++ | 0/+ |
| Subcortical grey | + | 0/+ | + | ++ | 0/+ | ++ |
| Brainstem | ++ | ++ | + | 0/+ | 0/+ | 0 |
Semi-quantitative determination of the amount of regional atrophy as shown by the VBM analysis: 0 = no atrophy, 0/+ = scant amount of atrophy, + = mild atrophy, ++ = moderate and +++ = severe.
3.2 Image analysis
3.2.1 PSP versus controls
The pathologically confirmed PSP group showed a pattern of atrophy affecting both cortical and brainstem structures bilaterally (Figure 1). Cortical grey matter atrophy was identified bilaterally in a region including the superior premotor cortex and spreading to the anterior bank of the precentral sulcus, compared to controls (p<0.001, uncorrected). Subcortical white matter atrophy was identified underlying approximately the same region and in the external/ extreme capsule. Grey matter atrophy was also identified in the supplemental motor area and the head of the caudate nucleus. Atrophy of the brainstem involved white matter loss bilaterally in the dorsal mesencephalic / diencephalic junction, and cerebral peduncle of the midbrain, compared to controls. Greater grey matter atrophy was also identified in the region of the anterior lobe, central lobule, lingula of cerebellum and roof of the fourth ventricle. No regions of grey or white matter atrophy survived the correction for multiple comparisons (p<0.01).
Figure 1.
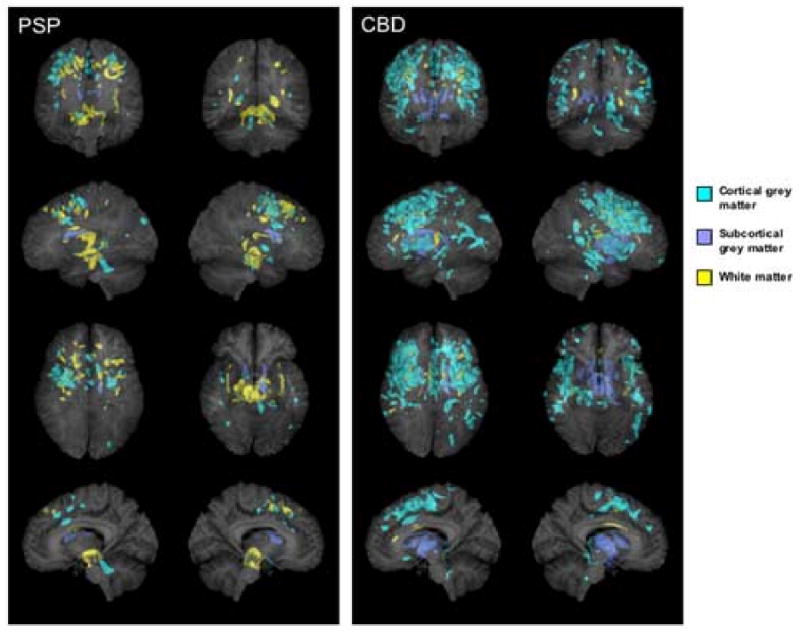
3D renders showing the patterns of grey (shown in blue) and white (shown in yellow) matter atrophy in subjects with pathologically confirmed CBD and PSP compared to controls (p<0.001, uncorrected for multiple comparisons). Subcortical grey matter has been highlighted in dark blue. All regions of atrophy are shown as transparency renders on a surface projection of the brain. The bottom images show a render of only a subsection of sagittal slices spanning the midsagittal plane in order to specifically highlight involvement of the brainstem. The sagittal image on the left = left hemisphere render.
3.2.2 CBD versus controls
The pathologically confirmed CBD group showed a predominantly cortical pattern of atrophy (Figure 1). Grey matter loss was identified bilaterally in the posterior inferior, middle and superior frontal lobes, the superior premotor cortex, and the posterior temporal and parietal lobes, compared to controls (p<0.001, uncorrected). Atrophy was also identified in the insula cortex and the supplemental motor area. Subcortical grey matter atrophy was identified in the globus pallidus, putamen, and the head of the caudate nucleus. The brainstem was relatively spared except for a small region in the dorsal ponto-medullary junction. Grey matter atrophy was also found in all these regions after a correction for multiple comparisons at p<0.01. Small amounts of white matter atrophy were found in the posterior frontal lobes at the cortical-medullary junction, and in the corpus callosum, the external/ extreme capsule and the right midbrain (p<0.001, uncorrected).
3.2.3 E-PSP versus controls
The pattern of atrophy in the E-PSP subgroup mainly involved the brainstem, with white matter atrophy of the right cerebral peduncle of the midbrain and apparent grey matter atrophy in the region of the anterior lobe, central lobule, lingula and roof of the fourth ventricle when compared to controls (p<0.001, uncorrected, Figure 2). No regions of grey or white matter atrophy survived the correction for multiple comparisons (p<0.01).
Figure 2.
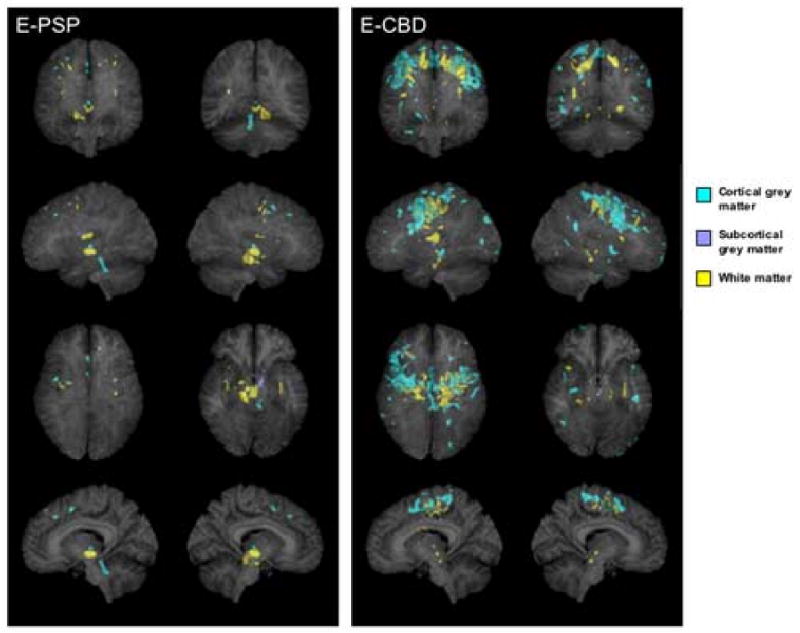
3D renders showing the patterns of grey (shown in blue) and white (shown in yellow) matter atrophy in subjects with an extrapyramidal syndrome and pathologically confirmed PSP (E-PSP) and CBD (E-CBD) compared to controls (p<0.001, uncorrected for multiple comparisons). Subcortical grey matter has been highlighted in dark blue. All regions of atrophy are shown as transparency renders on a surface projection of the brain. The bottom images show a render of only a subsection of sagittal slices spanning the midsagittal plane in order to specifically highlight involvement of the brainstem. The sagittal image on the left = left hemisphere render.
3.2.4 E-CBD versus controls
The E-CBD subgroup showed cortical grey matter atrophy in the superior premotor cortex spreading to the posterior superior, middle and inferior frontal lobes, compared to controls. White matter atrophy was identified underlying approximately the same regions, with scant involvement of the brainstem (p<0.001, uncorrected, Figure 2). There was also some grey matter involvement of the supplemental motor area and the parietal lobes compared to controls (p<0.001, uncorrected). The pattern was bilateral although slightly more severe in the right hemisphere. No regions of grey or white matter atrophy survived the correction for multiple comparisons (p<0.01).
3.2.5 D-PSP versus controls
The D-PSP subgroup showed cortical grey matter atrophy in the superior premotor cortex spreading to the anterior bank of the precentral sulcus and the frontal lobes compared to controls (p<0.001, uncorrected, Figure 3). White matter atrophy was found in the posterior frontal lobes and in the dorsal mesencephalic / diencephalic junction in the brainstem (p<0.001, uncorrected). No regions of grey or white matter atrophy survived the correction for multiple comparisons (p<0.01).
Figure 3.
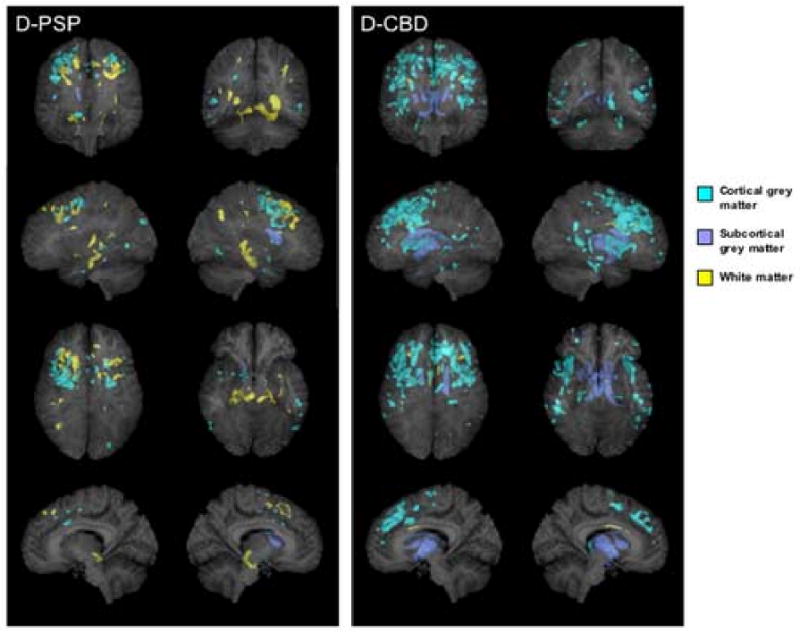
3D renders showing the patterns of grey (shown in blue) and white (shown in yellow) matter atrophy in subjects with a dementia syndrome and pathologically confirmed PSP (D-PSP) and CBD (D-CBD) compared to controls (p<0.001, uncorrected for multiple comparisons). Subcortical grey matter has been highlighted in dark blue. All regions of atrophy are shown as transparency renders on a surface projection of the brain. The bottom images show a render of only a subsection of sagittal slices spanning the midsagittal plane in order to specifically highlight involvement of the brainstem. The sagittal image on the left = left hemisphere render.
3.2.6 D-CBD versus controls
The D-CBD subgroup showed a widespread pattern of cortical grey matter atrophy involving the lateral superior, middle and inferior frontal gyri, with no white matter atrophy (p<0.001, uncorrected, Figure 3). Grey matter atrophy was also present in the posterior temporal and parietal lobes and insula. Subcortical grey matter atrophy was found in the globus pallidus, putamen and head of the caudate nucleus. Regions of atrophy in the frontal lobe and insula survived the correction for multiple comparisons (p<0.01).
3.2.7 Semi quantitative analysis
Semiquantitative analysis of the amount of atrophy of cortical grey, subcortical grey and white, and brainstem revealed by the VBM analysis in all groups are shown in Table 3. Each group and subgroup had a different overall pattern of graded atrophy. The PSP group showed moderate cortical grey matter, subcortical white matter, and brainstem atrophy. The CBD group showed severe cortical grey matter atrophy, with moderate subcortical grey matter atrophy, and less atrophy of the white matter and brainstem.
The E-PSP subgroup had moderate brainstem atrophy with scant atrophy elsewhere, while the E-CBD group had very little brainstem atrophy but with moderate cortical grey and corresponding subcortical white matter atrophy. The D-PSP group had moderate cortical grey and subcortical white matter atrophy and mild subcortical grey and brainstem atrophy, while the D-CBD subgroup had severe cortical and moderate subcortical grey matter atrophy, with scant white matter involvement.
4. Discussion
Using the unbiased technique of VBM, we demonstrate two different patterns of atrophy in a relatively large cohort of autopsy confirmed PSP and CBD subjects. Further subdivision of the pathological cohort of PSP and CBD subjects by clinical diagnosis of either a dominant extrapyramidal disorder (dominated by motor features), or a dominant dementia syndrome (dominated by cortical cognitive impairment) identified four different patterns of atrophy.
Both groups of PSP and CBD subjects were equally matched with the exception of the Hoehn and Yahr Scale scores[23] showing that the CBD subjects were more severe in terms of motor dysfunction compared to the PSP subjects. The PSP subjects as a whole were found to have atrophy predominantly in brainstem structures, particularly in the midbrain, in keeping with typical pathological findings in PSP[20] and with previous imaging studies[7, 10, 18, 40, 46, 49, 51]. Neuronal loss in nucleus raphe interpositus of the midbrain has been shown to correlate with vertical supranuclear palsy in PSP[42]. Grey matter atrophy was also identified in the region of the anterior lobe, central lobule, lingual of the cerebellum and roof of the fourth ventricle. It is likely that this region of apparent grey matter atrophy is actually reflecting underlying atrophy of the superior cerebellar peduncle. Partial volume averaging of the cerebellum and superior cerebellar peduncle could lead VBM to misclassify white matter as grey matter. The superior cerebellar peduncle has been found to be specific to pathologically diagnosed PSP[54], and was shown to be atrophied in another imaging series of clinically diagnosed PSP[38]. Subcortical grey matter atrophy was noted in the caudate nucleus, not surprisingly since basal ganglia lesions correlate with the presence of parkinsonism. The caudate nucleus has been shown to be affected in PSP using VBM[7, 10, 40].
In addition to the typical imaging features we also show cortical grey matter atrophy in the premotor and supplemental motor areas. The premotor region is affected in PSP pathologically[12] and atrophy of the premotor and supplemental motor areas has recently been shown to correlate with apraxia of speech in pathologically confirmed PSP[25]. Previous VBM studies have shown atrophy of both the premotor cortex[36] and the supplemental motor area in PSP[8]. White matter atrophy appeared to underlie the regions of grey matter atrophy in motor and premotor areas and follow the corticospinal tract. Recently a biochemical study demonstrated significant abnormal tau pathology on western blot in the white matter in PSP[60], and studies on microglial activation reveal that the corticospinal tract is affected in PSP[22]. Microglial activation is thought to be a good marker of neuronal loss and hence atrophy[22]. Similarly, the thalamic fasciculus and the dentatorubral tracts were atrophic in our PSP subjects, and these tracts also show significant microbial burden[22]. Indeed, a recent study using diffusion tensor imaging has shown that white matter degeneration is an early marker of disease in PSP[36]. In contrast to a previous study of clinically defined PSP the prefrontal cortex was not found to be atrophic in our PSP subjects[8]. This may have been due to the presence of cases of frontotemporal dementia in that series, since prefrontal atrophy is common in frontotemporal dementia[55, 56] and PSP and frontotemporal dementia can have overlapping clinical features[26, 37, 44].
The patterns of atrophy in the CBD group as a whole were very different from that seen in PSP, with more cortical grey matter atrophy affecting the posterior frontal and parietal regions[7, 18, 43, 49, 59]. Dysfunction of the frontal and parietal regions has been presumed to account for the typical feature of apraxia that is characteristic to CBD[39, 47]. The basal ganglia were also heavily affected in the CBD group. This finding is similar to a number of other studies that have shown putamen and pallidal atrophy in CBD[7, 19]. We also confirm that the middle corpus callosum is atrophic in CBD as previously reported[18, 58]. Another striking difference between PSP and CBD was the lack of brainstem atrophy in CBD. Pathological studies on microglial activation also demonstrate a significant difference in the brainstem between PSP and CBD, with PSP showing significantly more microglial burden[22]. The patterns of atrophy in CBD were relatively symmetric, confirming the results of a recent imaging study that measured regions of interest in pathologically confirmed CBD cases[18]. This is perhaps surprising given that CBD is a clinically asymmetric disease. We suspect that, since either hemisphere can show greater involvement in CBD[27], this discrepancy was due to the inclusion of some subjects with greater atrophy in the right hemisphere and others with greater atrophy in the left hemisphere resulting in a bilateral pattern of atrophy in the whole group. To corroborate this hypothesis we had performed a visual assessment of asymmetry in each of the CBD cases and indeed found that four subjects had greater involvement of the left hemisphere, four had greater involvement of the right hemisphere, and three showed a symmetric pattern.
These results therefore suggest that in patients presenting with clinical features of PSP and CBD imaging can be helpful in differentiating both pathologies. Therefore the finding of midbrain and superior cerebellar peduncle atrophy is most indicative of PSP pathology, while atrophy of the frontoparietal lobes and pallidum in the absence of brainstem atrophy is most indicative of CBD. It is notable however that the premotor cortices and supplemental motor area can be involved in both pathologically confirmed PSP and CBD subjects suggesting that atrophy of these structures would not be helpful in the differential diagnosis.
There were no significant differences between our E-PSP and E-CBD subjects in terms of subject demographics. Both subgroups were more impaired on the Hoehn and Yahr scale than the dementia subjects which further validate the division of subjects by clinical syndrome. However, the patterns of atrophy were different between the E-PSP and E-CBD subgroups. The E-PSP subjects had more brainstem atrophy while the E-CBD subjects had more cortical grey and subcortical white matter atrophy. Similarly, there were no demographic differences between the D-PSP and D-CBD subgroups, although the patterns of atrophy were again different between both subgroups. The D-PSP subgroup had more subcortical white matter atrophy than the D-CBD subgroup. Less obvious differences between extrapyramidal subgroups and between dementia subgroups were also found. These findings demonstrate that similar clinical syndromes can arise from the two different pathologies of PSP and CBD[12] and have different anatomic correlates.
When the PSP subgroups were compared the E-PSP group showed mainly brainstem atrophy with only scant cortical and subcortical atrophy while the D-PSP group showed less brainstem atrophy and more cortical and subcortical atrophy. Our VBM findings are similar to findings from a pathological study that found moderate cortical tau pathology in PSP subjects with cognitive impairment, with very little cortical tau pathology in those without cognitive impairment[3].
The E-CBD and D-CBD subgroups also differed from each other in terms of the patterns of atrophy. The D-CBD group showed more cortical grey matter atrophy yet practically no white matter atrophy, compared to the E-CBD subgroup, which had both moderate cortical grey matter and white matter atrophy. In addition, the atrophy of the cortical grey matter mainly involved the frontal lobes and insula, a similar pattern of which occurs in frontotemporal dementia[45] which may explain why CBD not uncommonly can present as FTD[26, 28].
The strength of this study is the fact that our cases were pathologically confirmed to have PSP and CBD based on consensus criteria and had all been evaluated by a neurodegenerative specialist during their disease course. The limitation of our study was the relatively small number of cases when we subdivided our cohort. In addition, there are a number of limitations inherent to the techniques of normalization and segmentation within VBM[6, 16]. In particular, misclassification of tissue due to partial volume averaging and ventricular enlargement is a common problem. VBM may also have a limited ability to detect deep white matter atrophy, since atrophied tissue would be replaced by white matter of a similar intensity. Segmentation errors are also particularly likely in subcortical grey matter due to reduced grey to white matter contrast in these regions. However, these issues are not specific to this study and apply to all VBM studies on atrophic brains.
In this study we show regional differences in autopsy confirmed PSP and CBD subjects that will be diagnostically useful. More importantly we demonstrate that while PSP and CBD can present as similar clinical syndromes, the anatomic correlates are very different. The findings from this study help to elucidate the in vivo ante-mortem regional distribution of atrophy in PSP and CBD subjects.
Acknowledgments
This study was supported by the NIH Roadmap Multidisciplinary Clinical Research Career Development Award Grant (K12/NICHD)-HD49078, by grants P50 AG16574, U01 AG06786 and R01 AG11378 from the National Institute on Aging, Bethesda MD, NIRG-03-4842 from the Alzheimer's Association, and the generous support of the Robert H. and Clarice Smith and Abigail Van Buren Alzheimer's Disease Research Program of the Mayo Foundation, U.S.A. The authors would like to thank Dennis Hanson from the Biomedical Imaging Resource, Mayo Clinic, for help with the 3D renders. All renders were performed with the Analyze 7.0 software program. The authors would also like to thanks Dr. J. Eric Ahlskog for critical review of this manuscript.
Footnotes
Disclosure statement: None of the authors have any financial ties to the manuscript being submitted and no conflicts of interest. All authors have seen this final version of the manuscript being submitted, approve of its contents, and validate the accuracy of the data. The manuscript is not being considered for publication by any other journal and will not be submitted elsewhere while under consideration at Neurobiology of Aging. Data contained in the manuscript has not previously been published.
Publisher's Disclaimer: This is a PDF file of an unedited manuscript that has been accepted for publication. As a service to our customers we are providing this early version of the manuscript. The manuscript will undergo copyediting, typesetting, and review of the resulting proof before it is published in its final citable form. Please note that during the production process errors may be discovered which could affect the content, and all legal disclaimers that apply to the journal pertain.
References
- 1.Ashburner J, Friston KJ. Voxel-based morphometry--the methods. Neuroimage. 2000;11:805–821. doi: 10.1006/nimg.2000.0582. [DOI] [PubMed] [Google Scholar]
- 2.Bergeron C, Davis A, Lang AE. Corticobasal ganglionic degeneration and progressive supranuclear palsy presenting with cognitive decline. Brain Pathol. 1998;8:355–365. doi: 10.1111/j.1750-3639.1998.tb00159.x. [DOI] [PMC free article] [PubMed] [Google Scholar]
- 3.Bigio EH, Brown DF, White CL., 3rd Progressive supranuclear palsy with dementia: cortical pathology. J Neuropathol Exp Neurol. 1999;58:359–364. doi: 10.1097/00005072-199904000-00006. [DOI] [PubMed] [Google Scholar]
- 4.Boeve BF, Lang AE, Litvan I. Corticobasal degeneration and its relationship to progressive supranuclear palsy and frontotemporal dementia. Ann Neurol. 2003;54 5:S15–19. doi: 10.1002/ana.10570. [DOI] [PubMed] [Google Scholar]
- 5.Boeve BF, Maraganore DM, Parisi JE, Ahlskog JE, Graff-Radford N, Caselli RJ, Dickson DW, Kokmen E, Petersen RC. Pathologic heterogeneity in clinically diagnosed corticobasal degeneration. Neurology. 1999;53:795–800. doi: 10.1212/wnl.53.4.795. [DOI] [PubMed] [Google Scholar]
- 6.Bookstein FL. “Voxel-based morphometry” should not be used with imperfectly registered images. Neuroimage. 2001;14:1454–1462. doi: 10.1006/nimg.2001.0770. [DOI] [PubMed] [Google Scholar]
- 7.Boxer AL, Geschwind MD, Belfor N, Gorno-Tempini ML, Schauer GF, Miller BL, Weiner MW, Rosen HJ. Patterns of brain atrophy that differentiate corticobasal degeneration syndrome from progressive supranuclear palsy. Arch Neurol. 2006;63:81–86. doi: 10.1001/archneur.63.1.81. [DOI] [PubMed] [Google Scholar]
- 8.Brenneis C, Seppi K, Schocke M, Benke T, Wenning GK, Poewe W. Voxel based morphometry reveals a distinct pattern of frontal atrophy in progressive supranuclear palsy. J Neurol Neurosurg Psychiatry. 2004;75:246–249. [PMC free article] [PubMed] [Google Scholar]
- 9.Collins SJ, Ahlskog JE, Parisi JE, Maraganore DM. Progressive supranuclear palsy: neuropathologically based diagnostic clinical criteria. J Neurol Neurosurg Psychiatry. 1995;58:167–173. doi: 10.1136/jnnp.58.2.167. [DOI] [PMC free article] [PubMed] [Google Scholar]
- 10.Cordato NJ, Duggins AJ, Halliday GM, Morris JG, Pantelis C. Clinical deficits correlate with regional cerebral atrophy in progressive supranuclear palsy. Brain. 2005;128:1259–1266. doi: 10.1093/brain/awh508. [DOI] [PubMed] [Google Scholar]
- 11.Department of Neurology. Clinical Examinations in Neurology. CV Mosby Co; St Louis, Mo: 1998. Mayo Clinic. [Google Scholar]
- 12.Dickson DW. Neuropathologic differentiation of progressive supranuclear palsy and corticobasal degeneration. J Neurol. 1999;246 2:II6–15. doi: 10.1007/BF03161076. [DOI] [PubMed] [Google Scholar]
- 13.Dickson DW, Bergeron C, Chin SS, Duyckaerts C, Horoupian D, Ikeda K, Jellinger K, Lantos PL, Lippa CF, Mirra SS, Tabaton M, Vonsattel JP, Wakabayashi K, Litvan I. Office of Rare Diseases neuropathologic criteria for corticobasal degeneration. J Neuropathol Exp Neurol. 2002;61:935–946. doi: 10.1093/jnen/61.11.935. [DOI] [PubMed] [Google Scholar]
- 14.Genovese CR, Lazar NA, Nichols T. Thresholding of statistical maps in functional neuroimaging using the false discovery rate. Neuroimage. 2002;15:870–878. doi: 10.1006/nimg.2001.1037. [DOI] [PubMed] [Google Scholar]
- 15.Golbe L. Progressive supranuclear palsy. In: Jankovic JTE, editor. Parkinson's disease and movement disorders. Williams and Wilkins; Baltimore: 1993. pp. 145–161. [Google Scholar]
- 16.Good CD, Scahill RI, Fox NC, Ashburner J, Friston KJ, Chan D, Crum WR, Rossor MN, Frackowiak RS. Automatic differentiation of anatomical patterns in the human brain: validation with studies of degenerative dementias. Neuroimage. 2002;17:29–46. doi: 10.1006/nimg.2002.1202. [DOI] [PubMed] [Google Scholar]
- 17.Grimes DA, Lang AE, Bergeron CB. Dementia as the most common presentation of cortical-basal ganglionic degeneration. Neurology. 1999;53:1969–1974. doi: 10.1212/wnl.53.9.1969. [DOI] [PubMed] [Google Scholar]
- 18.Groschel K, Hauser TK, Luft A, Patronas N, Dichgans J, Litvan I, Schulz JB. Magnetic resonance imaging-based volumetry differentiates progressive supranuclear palsy from corticobasal degeneration. Neuroimage. 2004;21:714–724. doi: 10.1016/j.neuroimage.2003.09.070. [DOI] [PubMed] [Google Scholar]
- 19.Hauser RA, Murtaugh FR, Akhter K, Gold M, Olanow CW. Magnetic resonance imaging of corticobasal degeneration. J Neuroimaging. 1996;6:222–226. doi: 10.1111/jon199664222. [DOI] [PubMed] [Google Scholar]
- 20.Hauw JJ, Daniel SE, Dickson D, Horoupian DS, Jellinger K, Lantos PL, McKee A, Tabaton M, Litvan I. Preliminary NINDS neuropathologic criteria for Steele-Richardson-Olszewski syndrome (progressive supranuclear palsy) Neurology. 1994;44:2015–2019. doi: 10.1212/wnl.44.11.2015. [DOI] [PubMed] [Google Scholar]
- 21.Hersch EL. Development and application of the extended scale for dementia. J Am Geriatr Soc. 1979;27:348–354. doi: 10.1111/j.1532-5415.1979.tb06056.x. [DOI] [PubMed] [Google Scholar]
- 22.Ishizawa K, Dickson DW. Microglial activation parallels system degeneration in progressive supranuclear palsy and corticobasal degeneration. J Neuropathol Exp Neurol. 2001;60:647–657. doi: 10.1093/jnen/60.6.647. [DOI] [PubMed] [Google Scholar]
- 23.Jankovic J, McDermott M, Carter J, Gauthier S, Goetz C, Golbe L, Huber S, Koller W, Olanow C, Shoulson I. Variable expression of Parkinson's disease: a base-line analysis of the DATATOP cohort. The Parkinson Study Group. Neurology. 1990;40:1529–1534. doi: 10.1212/wnl.40.10.1529. [DOI] [PubMed] [Google Scholar]
- 24.Josephs KA, Boeve BF, Duffy JR, Smith GE, Knopman DS, Parisi JE, Petersen RC, Dickson DW. Atypical progressive supranuclear palsy underlying progressive apraxia of speech and nonfluent aphasia. Neurocase. 2005;11:283–296. doi: 10.1080/13554790590963004. [DOI] [PubMed] [Google Scholar]
- 25.Josephs KA, Duffy JR, Strand EA, Whitwell JL, Layton KF, Parisi JE, Hauser MF, Witte RJ, Boeve BF, Knopman DS, Dickson DW, Jack CR, Jr, Petersen RC. Clinicopathological and imaging correlates of progressive aphasia and apraxia of speech. Brain. 2006 doi: 10.1093/brain/awl078. [DOI] [PMC free article] [PubMed] [Google Scholar]
- 26.Josephs KA, Petersen RC, Knopman DS, Boeve BF, Whitwell JL, Duffy JR, Parisi JE, Dickson DW. Clinicopathologic analysis of frontotemporal and corticobasal degenerations and PSP. Neurology. 2006;66:41–48. doi: 10.1212/01.wnl.0000191307.69661.c3. [DOI] [PubMed] [Google Scholar]
- 27.Josephs KA, Tang-Wai DF, Edland SD, Knopman DS, Dickson DW, Parisi JE, Petersen RC, Jack CR, Jr, Boeve BF. Correlation between antemortem magnetic resonance imaging findings and pathologically confirmed corticobasal degeneration. Arch Neurol. 2004;61:1881–1884. doi: 10.1001/archneur.61.12.1881. [DOI] [PubMed] [Google Scholar]
- 28.Kertesz A, McMonagle P, Blair M, Davidson W, Munoz DG. The evolution and pathology of frontotemporal dementia. Brain. 2005;128:1996–2005. doi: 10.1093/brain/awh598. [DOI] [PubMed] [Google Scholar]
- 29.Kokmen E, Naessens JM, Offord KP. A short test of mental status: description and preliminary results. Mayo Clin Proc. 1987;62:281–288. doi: 10.1016/s0025-6196(12)61905-3. [DOI] [PubMed] [Google Scholar]
- 30.Lang A, Riley DE, Bergeron C. Cortico-basal ganglionic degeneration. In: DB C, editor. Neurodegenerative disease. WB Saunders; Philadelphia: 1994. pp. 877–894. [Google Scholar]
- 31.Lees A. The Steele-Richardson-Olszewski syndrome (progressive supranuclear palsy) In: Marsden CD, F S, editors. Movement Disorders 2. Butterworths; London: 1987. pp. 272–287. [Google Scholar]
- 32.Litvan I, Agid Y, Calne D, Campbell G, Dubois B, Duvoisin RC, Goetz CG, Golbe LI, Grafman J, Growdon JH, Hallett M, Jankovic J, Quinn NP, Tolosa E, Zee DS. Clinical research criteria for the diagnosis of progressive supranuclear palsy (Steele-Richardson-Olszewski syndrome): report of the NINDS-SPSP international workshop. Neurology. 1996;47:1–9. doi: 10.1212/wnl.47.1.1. [DOI] [PubMed] [Google Scholar]
- 33.Mirra SS, Heyman A, McKeel D, Sumi SM, Crain BJ, Brownlee LM, Vogel FS, Hughes JP, van Belle G, Berg L. The Consortium to Establish a Registry for Alzheimer's Disease (CERAD). Part II. Standardization of the neuropathologic assessment of Alzheimer's disease. Neurology. 1991;41:479–486. doi: 10.1212/wnl.41.4.479. [DOI] [PubMed] [Google Scholar]
- 34.Morris HR, Gibb G, Katzenschlager R, Wood NW, Hanger DP, Strand C, Lashley T, Daniel SE, Lees AJ, Anderton BH, Revesz T. Pathological, clinical and genetic heterogeneity in progressive supranuclear palsy. Brain. 2002;125:969–975. doi: 10.1093/brain/awf109. [DOI] [PubMed] [Google Scholar]
- 35.Morris JC. The Clinical Dementia Rating (CDR): current version and scoring rules. Neurology. 1993;43:2412–2414. doi: 10.1212/wnl.43.11.2412-a. [DOI] [PubMed] [Google Scholar]
- 36.Padovani A, Borroni B, Brambati SM, Agosti C, Broli M, Alonso R, Scifo P, Bellelli G, Alberici A, Gasparotti R, Perani D. Diffusion tensor imaging and voxel based morphometry study in early progressive supranuclear palsy. J Neurol Neurosurg Psychiatry. 2006;77:457–463. doi: 10.1136/jnnp.2005.075713. [DOI] [PMC free article] [PubMed] [Google Scholar]
- 37.Paviour DC, Lees AJ, Josephs KA, Ozawa T, Ganguly M, Strand C, Godbolt A, Howard RS, Revesz T, Holton JL. Frontotemporal lobar degeneration with ubiquitin-only-immunoreactive neuronal changes: broadening the clinical picture to include progressive supranuclear palsy. Brain. 2004;127:2441–2451. doi: 10.1093/brain/awh265. [DOI] [PubMed] [Google Scholar]
- 38.Paviour DC, Price SL, Stevens JM, Lees AJ, Fox NC. Quantitative MRI measurement of superior cerebellar peduncle in progressive supranuclear palsy. Neurology. 2005;64:675–679. doi: 10.1212/01.WNL.0000151854.85743.C7. [DOI] [PubMed] [Google Scholar]
- 39.Peigneux P, Salmon E, Garraux G, Laureys S, Willems S, Dujardin K, Degueldre C, Lemaire C, Luxen A, Moonen G, Franck G, Destee A, Van der Linden M. Neural and cognitive bases of upper limb apraxia in corticobasal degeneration. Neurology. 2001;57:1259–1268. doi: 10.1212/wnl.57.7.1259. [DOI] [PubMed] [Google Scholar]
- 40.Price S, Paviour D, Scahill R, Stevens J, Rossor M, Lees A, Fox N. Voxel-based morphometry detects patterns of atrophy that help differentiate progressive supranuclear palsy and Parkinson's disease. Neuroimage. 2004;23:663–669. doi: 10.1016/j.neuroimage.2004.06.013. [DOI] [PubMed] [Google Scholar]
- 41.Rebeiz JJ, Kolodny EH, Richardson EP., Jr Corticodentatonigral degeneration with neuronal achromasia: a progressive disorder of late adult life. Trans Am Neurol Assoc. 1967;92:23–26. [PubMed] [Google Scholar]
- 42.Revesz T, Sangha H, Daniel SE. The nucleus raphe interpositus in the Steele-Richardson-Olszewski syndrome (progressive supranuclear palsy) Brain. 1996;119(Pt 4):1137–1143. doi: 10.1093/brain/119.4.1137. [DOI] [PubMed] [Google Scholar]
- 43.Riley DE, Lang AE, Lewis A, Resch L, Ashby P, Hornykiewicz O, Black S. Cortical-basal ganglionic degeneration. Neurology. 1990;40:1203–1212. doi: 10.1212/wnl.40.8.1203. [DOI] [PubMed] [Google Scholar]
- 44.Rippon GA, Boeve BF, Parisi JE, Dickson DW, Ivnik RI, Jack CR, Hutton M, Baker M, Josephs KA, Knopman DS, Petersen RC. Late-onset frontotemporal dementia associated with progressive supranuclear palsy/argyrophilic grain disease/Alzheimer's disease pathology. Neurocase. 2005;11:204–211. doi: 10.1080/13554790590944753. [DOI] [PubMed] [Google Scholar]
- 45.Rosen HJ, Gorno-Tempini ML, Goldman WP, Perry RJ, Schuff N, Weiner M, Feiwell R, Kramer JH, Miller BL. Patterns of brain atrophy in frontotemporal dementia and semantic dementia. Neurology. 2002;58:198–208. doi: 10.1212/wnl.58.2.198. [DOI] [PubMed] [Google Scholar]
- 46.Savoiardo M, Girotti F, Strada L, Ciceri E. Magnetic resonance imaging in progressive supranuclear palsy and other parkinsonian disorders. J Neural Transm. 1994 42:93–110. doi: 10.1007/978-3-7091-6641-3_8. [DOI] [PubMed] [Google Scholar]
- 47.Sawle GV, Brooks DJ, Marsden CD, Frackowiak RS. Corticobasal degeneration. A unique pattern of regional cortical oxygen hypometabolism and striatal fluorodopa uptake demonstrated by positron emission tomography. Brain. 1991;114(Pt 1B):541–556. doi: 10.1093/brain/114.1.541. [DOI] [PubMed] [Google Scholar]
- 48.Senjem ML, Gunter JL, Shiung MM, Petersen RC, Jack CR., Jr Comparison of different methodological implementations of voxel-based morphometry in neurodegenerative disease. Neuroimage. 2005;26:600–608. doi: 10.1016/j.neuroimage.2005.02.005. [DOI] [PMC free article] [PubMed] [Google Scholar]
- 49.Soliveri P, Monza D, Paridi D, Radice D, Grisoli M, Testa D, Savoiardo M, Girotti F. Cognitive and magnetic resonance imaging aspects of corticobasal degeneration and progressive supranuclear palsy. Neurology. 1999;53:502–507. doi: 10.1212/wnl.53.3.502. [DOI] [PubMed] [Google Scholar]
- 50.Steele JC, Richardson JC, Olszewski J. Progressive Supranuclear Palsy. A Heterogeneous Degeneration Involving the Brain Stem, Basal Ganglia and Cerebellum with Vertical Gaze and Pseudobulbar Palsy, Nuchal Dystonia and Dementia. Arch Neurol. 1964;10:333–359. doi: 10.1001/archneur.1964.00460160003001. [DOI] [PubMed] [Google Scholar]
- 51.Stern MB, Braffman BH, Skolnick BE, Hurtig HI, Grossman RI. Magnetic resonance imaging in Parkinson's disease and parkinsonian syndromes. Neurology. 1989;39:1524–1526. doi: 10.1212/wnl.39.11.1524. [DOI] [PubMed] [Google Scholar]
- 52.Tang-Wai DF, Josephs KA, Boeve BF, Dickson DW, Parisi JE, Petersen RC. Pathologically confirmed corticobasal degeneration presenting with visuospatial dysfunction. Neurology. 2003;61:1134–1135. doi: 10.1212/01.wnl.0000086814.35352.b3. [DOI] [PubMed] [Google Scholar]
- 53.Tsuboi Y, Josephs KA, Boeve BF, Litvan I, Caselli RJ, Caviness JN, Uitti RJ, Bott AD, Dickson DW. Increased tau burden in the cortices of progressive supranuclear palsy presenting with corticobasal syndrome. Mov Disord. 2005;20:982–988. doi: 10.1002/mds.20478. [DOI] [PubMed] [Google Scholar]
- 54.Tsuboi Y, Slowinski J, Josephs KA, Honer WG, Wszolek ZK, Dickson DW. Atrophy of superior cerebellar peduncle in progressive supranuclear palsy. Neurology. 2003;60:1766–1769. doi: 10.1212/01.wnl.0000068011.21396.f4. [DOI] [PubMed] [Google Scholar]
- 55.Whitwell JL, Jack CR, Jr, Senjem ML, Josephs KA. Patterns of atrophy in pathologically confirmed FTLD with and without motor neuron degeneration. Neurology. 2006;66:102–104. doi: 10.1212/01.wnl.0000191395.69438.12. [DOI] [PMC free article] [PubMed] [Google Scholar]
- 56.Whitwell JL, Josephs KA, Rossor MN, Stevens JM, Revesz T, Holton JL, Al-Sarraj S, Godbolt AK, Fox NC, Warren JD. Magnetic resonance imaging signatures of tissue pathology in frontotemporal dementia. Arch Neurol. 2005;62:1402–1408. doi: 10.1001/archneur.62.9.1402. [DOI] [PubMed] [Google Scholar]
- 57.Williams DR, de Silva R, Paviour DC, Pittman A, Watt HC, Kilford L, Holton JL, Revesz T, Lees AJ. Characteristics of two distinct clinical phenotypes in pathologically proven progressive supranuclear palsy: Richardson's syndrome and PSP-parkinsonism. Brain. 2005;128:1247–1258. doi: 10.1093/brain/awh488. [DOI] [PubMed] [Google Scholar]
- 58.Yamauchi H, Fukuyama H, Nagahama Y, Katsumi Y, Dong Y, Hayashi T, Konishi J, Kimura J. Atrophy of the corpus callosum, cortical hypometabolism, and cognitive impairment in corticobasal degeneration. Arch Neurol. 1998;55:609–614. doi: 10.1001/archneur.55.5.609. [DOI] [PubMed] [Google Scholar]
- 59.Yekhlef F, Ballan G, Macia F, Delmer O, Sourgen C, Tison F. Routine MRI for the differential diagnosis of Parkinson's disease, MSA, PSP, and CBD. J Neural Transm. 2003;110:151–169. doi: 10.1007/s00702-002-0785-5. [DOI] [PubMed] [Google Scholar]
- 60.Zhukareva V, Joyce S, Schuck T, Van Deerlin V, Hurtig H, Albin R, Gilman S, Chin S, Miller B, Trojanowski JQ, Lee VM. Unexpected abundance of pathological tau in progressive supranuclear palsy white matter. Ann Neurol. 2006 doi: 10.1002/ana.20916. [DOI] [PubMed] [Google Scholar]