

Abstract
A refined battery of neurological tests, SNAP (Simple Neuroassessment of Asymmetric imPairment), was developed and validated to efficiently assess neurological deficits induced in a mouse model of traumatic brain injury. Four to 7-month old mice were subjected to unilateral controlled cortical impact or sham injury (craniectomy only). Several behavioral tests (SNAP, beam walk, foot fault, and water maze) were used to assess functional deficits. SNAP was unique among these in that it required no expensive equipment and was performed in less than five minutes per mouse. SNAP demonstrated a high level of sensitivity and specificity as determined by receiver operator characteristics curve analysis. Interrater reliability was good, as determined by Cohen’s Kappa method and by comparing the sensitivity and specificity across various raters.
SNAP detected deficits in proprioception, visual fields, and motor strength in brain-injured mice at 3 days, and was sensitive enough to detect magnitude and recovery of injury. The contribution of individual battery components changed as a function of time after injury, however, each was important to the overall SNAP score. SNAP provided a sensitive, reliable, time-efficient and cost-effective means of assessing neurological deficits in mice after unilateral brain injury.
Keywords: apolipoprotein E, targeted-replacement, beam walk, foot fault, water maze
Introduction
Traumatic brain injury (TBI) remains a serious clinical problem associated with high mortality and lingering socioeconomic consequences (Thurman and Guerrero, 1999). In the course of investigating the neuropathology and functional deficits caused by TBI, a number of rodent models have been developed. Recently, reproducible mouse models of TBI (Leker et al., 2002; Smith et al., 1995; Statler et al., 2001) have increased the utility of transgenic manipulations to assess the contribution of specific genes to injury and recovery. Such assessment requires the accurate evaluation of neurological function in mice.
Most neurological tests used in TBI mice are adapted from those developed for rats (Fujimoto et al., 2004; McIntosh et al., 1989) or uninjured mice (Crawley, 2000). These protocols can be costly, time-consuming or provide limited assessment of neurological function. They may require extensive evaluator preparation, discouraging their use by untrained investigators. Here, we describe and validate a rapid and inexpensive, yet comprehensive, neurological exam, the Simple Neuroassessment of Asymmetric imPairment (SNAP), to assess magnitude of injury and functional recovery after unilateral TBI.
Materials and Methods
Animals
SNAP initially was used to test apolipoprotein E (APOE) genotype effects following TBI. C57BL/6 (WT) mice were obtained from Taconic Farms, Inc. (Germantown, NY). APOE targeted replacement mice (human APOE sequences under the control of the endogenous mouse apoE promoter, C57BL/6J background) were developed by Dr. Patrick M. Sullivan (Sullivan et al., 1997) and apoE null mice (C57BL/6 background) were a generous gift from Dr. Mary Jo LaDu (Northwestern University, Evanston, IL). The genotypes of the mice were verified by PCR. Since behavioral outcomes were not significantly different between the different genotypes (see Supplemental Fig. 1), the genotypes were grouped together for evaluation of SNAP. The mice (n =145 total; 88 injured, 37 sham, 13 aged naïve, and 7 excluded due to morbidity or mortality; one injured mouse was excluded from the chronic data because of late onset seizure activity) were housed in a barrier facility and maintained in environmentally controlled rooms (22–24°C) with a 12 h light/dark cycle. For two of the experiments, additional mice from subsequent studies were used. The ability of SNAP to detect injury severity was assessed using 19 additional C57BL/6 mice. Interrater agreement was later determined, and included 7 additional mice (COX2 −/−, Taconic). All mice were fed ad libitum with standard mouse/rat chow (Teklad/Harlan Madison, WI USA) containing 5.0% crude fat, 19.0% crude protein, and 5.0% crude fiber. Animals were handled daily to acclimate them to the investigator. For all tests, the examiner performing the neurological assessments was blinded to the injury status and genotype of the individual mice. All experiments were performed in accordance with the U.S. National Institutes of Health Guide for the Care and Use of Laboratory Animals and were approved by the University of Cincinnati Institutional Animal Care and Use Committee.
Histology
Euthanasia was performed by isoflurane induction to deep anesthesia followed by decapitation and rapid removal of the brain, which was then rapidly frozen on a bed of dry ice. Coronal cryostat sections (16 µm thick) were thaw-mounted on superfrost slides and air-dried. Nissl substance was stained with thionin. Images were captured using a Nikon Microphot microscope and a MicroPublisher 5.0 RTV digital camera. Background illumination was corrected using NIH ImageJ (1.34s) software (Landini, 2006). Composite figures were made using Adobe PhotoShop CS (8.0)
Traumatic brain injury
Brain injury was induced with unilateral controlled cortical impact over the somatosensory cortex (Fig. 1A). Mice were 4- to 7-months of age at the time of injury. Anesthesia was induced with isoflurane and anesthesia was maintained with isoflurane via a nonrebreathing apparatus connected to a murine nose cone on a stereotactic platform. Throughout the procedure, the mice were positioned in sternal recumbency on a warm water blanket to maintain body temperature. The cranium was exposed and a 3.5 mm diameter craniectomy performed left of midline, equidistant from lambda, bregma, the midline, and the temporal ridge (Fig. 1A). For injury, the exposed dura was subjected to a 2 mm diameter piston impact (4 m/s velocity, 100 ms duration) at a depth of 1.0 mm using the pneumatic controlled impact device AMS 201 (AmScien Instruments, Richmond, VA USA). For sham mice, a craniectomy was performed but the animal was removed from the platform before activating the piston. Hemostasis was achieved using absorbent sponges, avoiding direct contact with the exposed cortex, and the incision was closed over the open craniectomy. Mice were allowed to recover in a warmed cage until ambulatory. To evaluate SNAP at differing injury levels, mice were injured using an impact depth of either 1.0 or 1.25 mm.
Figure 1.
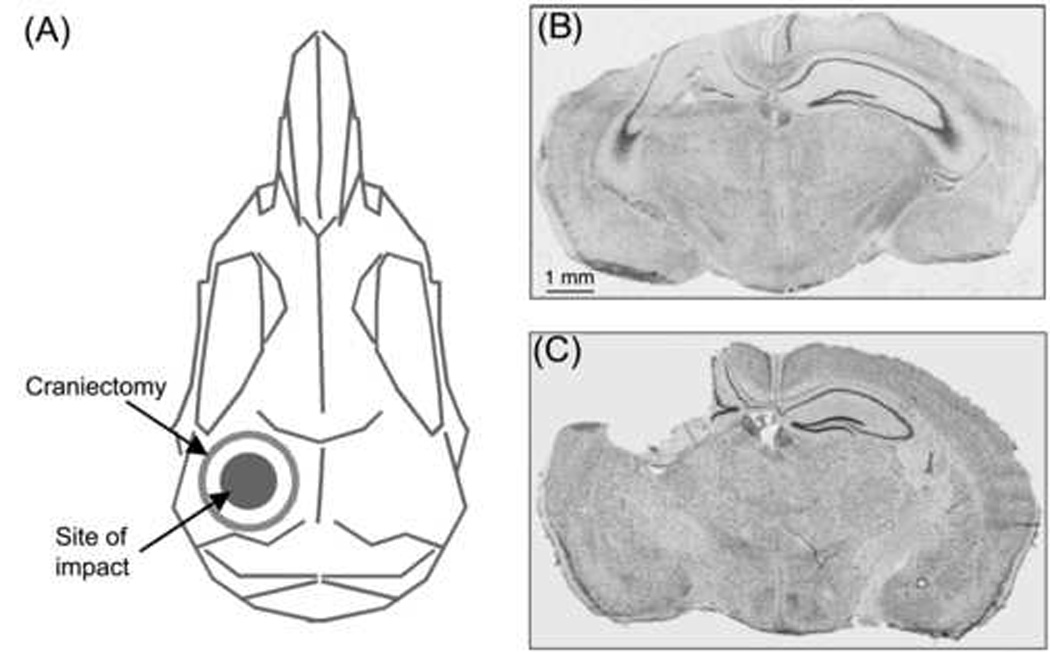
(A) Schematic dorsal view of a mouse skull indicates site of craniectomy and impact. (B) Composite digital micrograph from a 5-month-old wild-type mouse (6 days after injury). In addition to direct cortical neuron loss at the injury site (on the left side of this section), there is ipsilateral loss of dentate granule cells and hippocampal pyramidal neurons. (C) Composite digital micrograph from a 20-month-old 4/4 apoE mouse (14 months after injury). The injured cortex and dorsal hippocampus had been cleared, presumably by macrophages, resulting in a large cavity at the injury site. Composite digital micrographs (B,C) were made from coronal sections stained for Nissl substance (thionin).
Foot fault
A mouse was placed on an epoxy-coated wire grate (bars 2.5 mm in diameter, spaced 1 cm apart) and videotaped for 2 minutes from below the grate (Fig. 2A). Each successful foot placement was recorded as a step. A paw slipping through the grate was considered a foot fault (Hernandez and Schallert, 1988). The number of steps and faults were determined for each paw. The percentage of foot faults was determined by dividing the number of faults by the sum of faults and successful steps (faults/(steps + faults) × 100%). The foot fault evaluation was performed 3 days after surgery.
Figure 2.

(A) Foot fault test. A mouse was placed on an epoxy-coated wire grate and videotaped from below the grate. A brain-injured mouse often misdirected steps taken by the contralateral limbs resulting in those paws slipping through the grate (as shown). (B) Beam walk task. An injured mouse often dragged the contralateral hind limb along the side of the beam, whereas a sham mouse usually had all four paws on the topmost beam surface.
Beam walk
The beam walk is a test of complex motor coordination modified from Hamm et al. (1994). The beam (0.75 m × 1.25 cm, with 3 evenly spaced vertical posts on alternating sides) had a black box with an opening at one end and an aversive stimulus (bright lamp) at the other end (Fig. 2B). The mouse was placed on the beam near the light source and the light was turned on. Animals were trained (the day before and the day of surgery) to ambulate into the box to avoid the aversive stimulus, which was then turned off. Four repetitions (2 minutes maximum) were performed with a 1-minute resting period inside the box. The outcomes measured were the latency (sec) to reach the box and the number of runs with contralateral limb dragging. The beam walk evaluation was performed 3 days after surgery.
Water maze
The water maze was based on previous measures of cognitive deficits in spatial working memory in rodent TBI models (Morris, 1984; Smith et al., 1991; Hamm et al., 1992; Smith et al., 1995). Maze training was initiated two days before surgery. For each 1 minute swim, the mouse was gently placed in an 84 cm diameter tank containing 24°C water made opaque with nontoxic white paint. The objective was to find a 12 cm diameter platform, submerged just below the water’s surface. Each placement of the mouse into the water was rotated among four different positions. During the first four trials, a visible flag (black rubber stopper) was on the platform. If, after 1 minute, the mouse did not climb onto the platform, it was placed there and allowed to orient itself for 15 seconds. The mouse was then removed from the water, gently blotted with a towel, and placed back in a cage for at least 5 minutes between trials. These four training trials with the flagged platform were followed by four more training trials with the flag removed (hidden platform). Eight hidden platform training trials were performed the next day and four more on the day of surgery. A videotaped probe trial (without the platform) was conducted once after the final training trial, approximately 1.5 hours before surgery. Three probe trials to test for retention were performed at 6 days after surgery (greater deficits were observed at 6 days in injured compared with sham mice than at 3 days post-injury; data not shown). EthoVision Basic (v 2.3.19, Noldus Information Technology, Inc, Wageningen, The Netherlands) was used to measure outcomes including average swim speed, least mean square distance from the platform, number of target zone (2X platform diameter) crossings, and the time spent in target zone.
Simple Neuroassessment of Asymmetric imPairment (SNAP)
Mice were evaluated using eight tests to assess neurological parameters including vision, proprioception, motor strength and posture (Table I). The results from each of the eight tests were summed to derive the overall SNAP score. A neurologically intact animal would be expected to have a SNAP score of ”0”. SNAP scores were high when asymmetric deficits were apparent. To better convey what an inexperienced examiner generally observes, the guidelines for SNAP scoring are described in subjective terms (Table I). SNAP allows for ambiguous results (a score of “1”) and test scores of 2 to 5 were assigned when asymmetric deficits were apparent. In addition, a range was allowed when the deficit appeared to span more than one definition for a test score, and ranges were then averaged to derive the test score (e.g., a range of 2–3 would be scored as 2.5 for that test).
Table I. SNAP Guidelines.
Guidelines for SNAP. Each of the eight tests (A–H, depicted in Fig. 3) has a scoring range of 0–5, based on these guidelines. The SNAP score is the sum of the scores derived from all eight tests.
| SCORE: | 0 | 1 | 2 | 3 | 4 | 5 | |
|---|---|---|---|---|---|---|---|
| A. | Interactions | Avoids being handled | Responds quickly only after briefly touched | Freezes before escaping | Responds after multiple nudges | Only moves head | Comatose |
| B. | Cage Grasp | Both paws release simultaneously | CL paw first to release <50% of grasps. Struggles or an otherwise active, alert mouse that does not grasp. | CL paw first to release >50% but <100% of grasps | CL paw always first to release | CL paw does not grasp | Does not grasp with either paw |
| C. | Visual Placing | Once aware of ledge, arches back & reaches out with both forepaws | May reach with both paws but IL leads. Twists body. Taps CL paw | Occasionally does not reach with CL paw | Does not reach with CL paw at all | Head not raised and neither paw reaches | Comatose |
| D. | Pacing or Circling | Random directions | Freezing, but able to guide into either direction | Turns in one direction predominantly | Pacing, obstinate progression in same direction | Tight circling | Rolling |
| E. | Gait and Posture | Normal gait & posture | Occasionally notice CL limb abduction, but inconsistent or also observed IL | CL limb abducts when walking or stays caudal to body when mouse stops | CL limbs knuckle or too weak to support weight of mouse | Drags CL limbs | Recumbent |
| F. | Head tilt | No tilt | Ambiguous head tilt | Occasional head tilt noticed | Obvious head tilt | Torticollis | Recumbent |
| G. | Visual Field | Responds to visual stimulus bilaterally | No response but an otherwise active, alert mouse and/or has other indications of normal vision | <50 % CL responses and >50% IL responses | Consistent positive IL response, consistent lack of CL response | No response on either side and other indications of visual loss | Comatose |
| H. | Baton | Normal | An otherwise alert, active mouse that struggles or does not grasp. Tosses applicator. Loose CL grasp | Occasionally does not grasp with CL paws | Frequently does not use CL paws | Does not use CL paws at all | Unable to grasp swab |
CL, contralateral IL, ipsilateral
The first test, interaction with the handler, not only assessed the level of alertness, but also required integration of vision to escape the evaluator’s hand. Interaction was tested upon removal of the mouse from the home cage (Table I, Fig. 3A). An alert and active mouse that avoided handling was assigned a score of “0” for that test.
Figure 3.
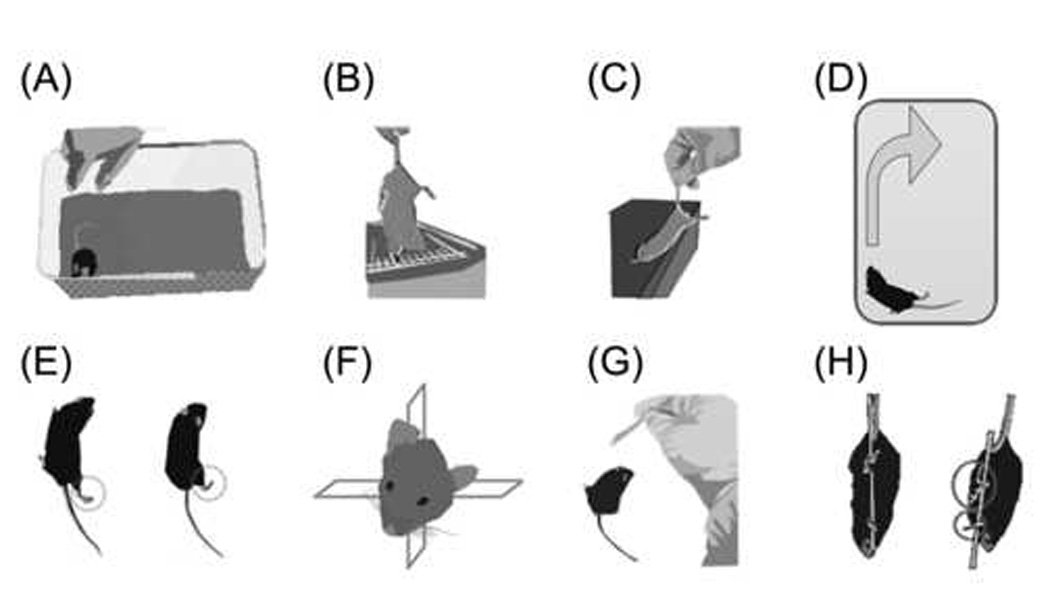
Individual SNAP tests. (A) Interactions. Upon removal from the cage, an uninjured mouse usually avoids being handled whereas an injured mouse would hesitate to escape. (B) Cage grasp. A mouse was suspended by the tail over the cage and allowed to grasp the bars. The mouse was slowly lifted away from the cage, noting the strength of the grasp and whether the paws released simultaneously. (C) Visual placing. A mouse was suspended by the tail and slowly advanced toward a ledge. Uninjured mice arched their back and reached out with both forepaws before touching the ledge (visual component). (D) Pacing/circling. Uninjured mice would ambulate in random directions. Some injured mice paced in the same general direction and were resistant to being guided into the opposite direction. (E) Gait/posture. Uninjured mice kept all four limbs tucked beneath the body when standing or ambulating. Weakness, dragging or abduction of contralateral limbs was observed in many of the injured mice. The mouse on the left shows abduction of the right pelvic limb. The injured mouse on the right shows a standing posture with all but the contralateral pelvic limb tucked well under the body. (F) Head tilt. The head posture of some injured mice was rotated within the coronal plane. (G) Visual field. A fiber-tipped applicator was waved on each side of the mouse, approaching from behind and avoiding contact with the vibrissae. Many uninjured mice would startle or turn toward the movement, whereas injured mice would often not react. (H) Baton. A mouse with sham injury (left) would grasp the applicator stick with all four paws. Often the mouse would attempt to “climb” the stick. A brain-injured mouse (right) had more difficulty locating and grasping the swab with the contralateral fore and hind paws.
The second test, cage grasp, was used to evaluate grip strength, and was performed immediately after removal of the mouse from its home cage. The mouse was held suspended by the tail over the cage lid (metal bars, 1.5 mm in diameter, spaced 6 mm apart) and was allowed to grasp a bar with both forepaws (Table I, Fig. 3B). The mouse was slowly pulled away from the cage, noting which paw released first. An injured mouse was expected to have contralateral grip weakness; therefore, if the contralateral forepaw was the first to release greater than 50% but less than 100% of the time, the score would be “2” as shown in Table I.
For the third test, visual placing (Table I, Fig. 3C), the mouse was held suspended by the tail and slowly advanced toward a countertop or a ledge level with its torso. The uninjured mouse extended its upper torso to simultaneously reach out toward the edge of the countertop with both forepaws. Visual placing evaluated vision, torso strength, forelimb coordination, proprioception and tactile input. Ambiguous responses (score of “1”), seen in a number of injured mice, included twisting of the body or “tapping” of the ledge with the contralateral paw, perhaps due to decreased contralateral vision, decreased proprioception and/or tactile input from the contralateral paw.
The fourth test, pacing/circling, was an observation of the ambulation direction in a test chamber (18 cm deep and 40 cm on each side). An uninjured mouse would ambulate in a random fashion, turning to either the right or the left when facing a corner. Brain-injured mice were expected to consistently turn toward one direction and to not be readily coaxed in the opposite direction (Table I, Fig. 3D). The fifth test was an observation of gait and limb posture. Uninjured mice kept all limbs tucked beneath the body when standing still or ambulating. Weakness, dragging or abduction of contralateral limbs was expected in brain-injured mice (Table I, Fig. 3E). In the sixth test, varying degrees of head tilt were present if the head was rotated within the coronal plane (Table I, Fig. 3F).
The seventh test examined each visual field by waving a fiber-tipped applicator (2 mm diameter) on either side of the head, allowing enough distance to avoid contact with the vibrissae (Table I, Fig. 3G). If the mouse consistently turned its head toward the source of the movement on both sides, the score for the visual field test would be “0” (Table I).
The eighth and final test, “baton,” evaluated coordination and proprioception. The mouse was held suspended by the tail and allowed to grasp a fiber-tipped applicator with all four paws. The applicator was released while the mouse remained suspended. An uninjured mouse would grasp the applicator tightly with all four paws and often would attempt to “climb” it (Table I, Fig. 3H).
Statistical analyses
A p-value less than 0.05 was required to reject the null hypothesis that the group means were equivalent. SNAP score was analyzed using the Mann-Whitney U-test when comparing sham vs. injured, Wilcoxon signed rank test for paired analysis, and Kruskal-Wallis when comparing multiple groups. Beam walk and foot faults were analyzed with one-way analysis of variance (ANOVA) for repeated measures or ANOVA with Scheffé’s post hoc test for comparisons of sham vs. injured. The chi-square test was used to analyze foot dragging during the beam walk trials. Correlations between different assessment methods were determined using Spearman Rank correlation (rs) analysis. Unless stated otherwise, the data are plotted as the mean ± 1 SEM.
The accuracy of each test was assessed using Receiver-Operator Characteristics (ROC) curve analysis. The ROC curve reflects the tradeoff between sensitivity (true positive/(true positive + false negative)) and specificity (true negative/(false positive + true negative)) for detecting a certain condition (in this case, TBI-induced neurological deficits). The sensitivity and specificity are calculated by using each possible SNAP score as a threshold for discriminating injured and sham mice (using GraphPad Prism 4 for Macintosh). Sensitivity is plotted as a function of (1 - specificity) and the area under this curve (AUC) represents the overall accuracy of the test. A perfect diagnostic test would have an AUC equal to 1.0 and a diagnostic test having no more accuracy than the flip of a coin will have the lowest possible AUC of 0.5. The AUC can be interpreted as the probability that a randomly selected injured mouse will have a worse score than a randomly selected sham-injured mouse (Motulsky, 2003; Hanley and McNeil, 1982; Swets, 1988). AUC comparisons between tests were made based on a previously reported method (Hanley and McNeil, 1983).
The variability of SNAP accuracy among different examiners was assessed. SNAP sensitivity and specificity were computed for each of five blinded examiners. The midpoint between the mean SNAP scores for the injured and sham groups was used as the threshold of discrimination for each examiner, with mice scoring above this value scored as injured and below as sham.
Interrater agreement was assessed by measuring the degree of concordance between four inexperienced examiners and an experienced examiner (S.B.S.) using Cohen’s Kappa method (Rosner, 1995; Landis and Koch, 1977; Cohen, 1960). Briefly, for a set of mice assessed by multiple examiners (1 inexperienced examiner evaluated a set of 15 injured and 4 sham mice; 3 additional inexperienced examiners evaluated a set of 20 injured and 12 sham mice), the expected probability of arriving at the same SNAP score by chance, as well as the observed probability of arriving at the same SNAP score, were computed. The Kappa analysis was repeated with the criterion for concordance relaxed to varying degrees in order to derive an estimate of overall SNAP precision. For example, two examiners might be considered to be in agreement if their SNAP scores for a particular mouse were within 2 units of each other. In these instances, the expected probability is the probability of both examiners assigning a given mouse SNAP scores within 2 units of each other by chance. The Kappa statistic is a function of these probabilities (Rosner, 1995), with κ = 1 indicating perfect agreement between the examiners.
Power analyses for ANOVA were carried out by calculating the noncentrality parameter, (where δ is the difference between group means, s is the sample standard deviation, n is the sample number per group, and k is the number of groups being compared (Glantz, 1992)). To calculate the number of animals per group yielding a power of 0.8 or 0.9, power curves with the appropriate degrees of freedom (Glantz, 1992) were used.
Results
Pooling of genotypes
SNAP initially was developed to test APOE genotype effects following TBI in mice. Behavioral outcomes were similar across the genotypes (Supplemental Fig. 1). Thus, mice of all genotypes were pooled into sham or injured groups for the purpose of validating the SNAP battery as an assessment tool for experimental TBI in mice.
Validation of the injury model
To ensure that this mouse model of moderate TBI induced detectable neurological deficits with negligible mortality, the mice were evaluated using currently accepted functional outcome measures (Nakamura et al., 1999; Baskin et al., 2003; Fox et al., 1999). Pathology (Figs. 1B and C) and functional deficits were similar to those obtained with previous reports (Smith et al., 1995). Of the mice used in this study, eight were excluded. Four died during anesthesia induction, one died the day after surgery, and one was sacrificed 3 days after surgery due to moribund condition. One mouse was excluded when a skull fracture was discovered during brain removal and one was sacrificed 213 days after surgery because of frequent seizures (only chronic data were excluded for this mouse).
The total steps taken on each side in the foot fault task were roughly equivalent (Fig. 4A, top) for sham or injured mice. In contrast, injured mice had a greater ratio of contralateral:ipsilateral faults compared with sham (Fig. 4A, bottom). Indeed, as a percentage of total steps, contralateral, but not ipsilateral, foot faults were significantly higher in injured compared with sham mice (Fig. 4B).
Figure 4.
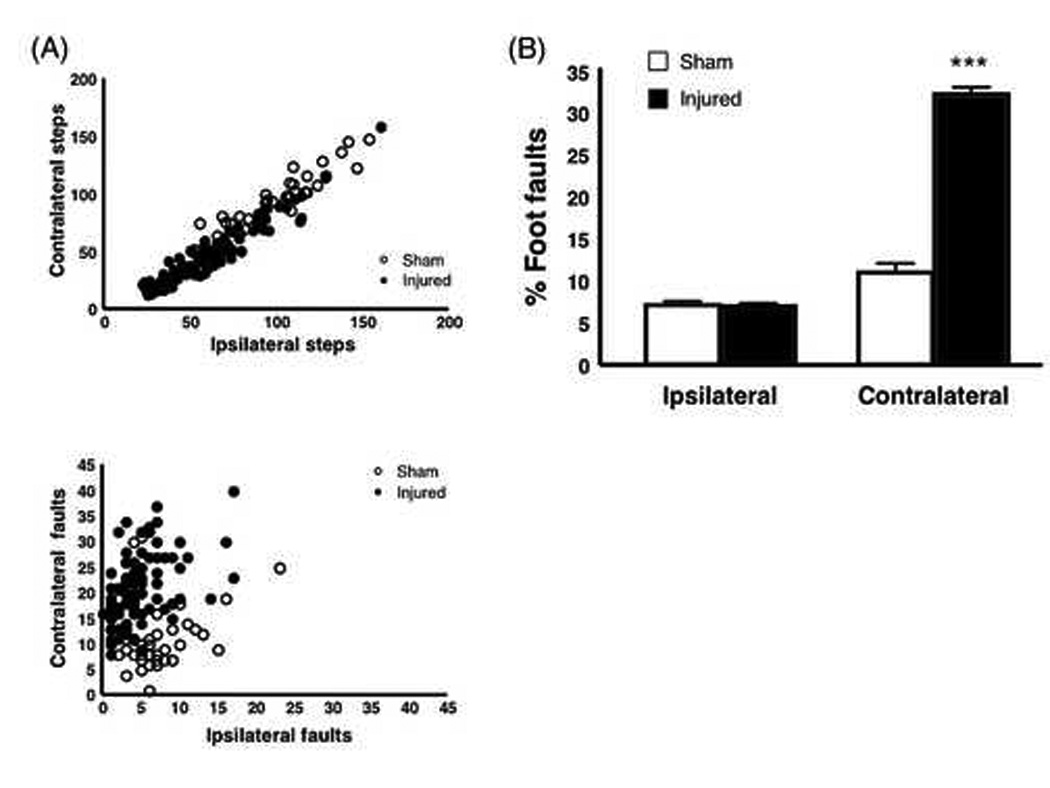
Foot Fault Test. (A) Steps and foot faults in the injured and sham mice 3 days after TBI. Scattergrams show the total number of contralateral steps (top) or contralateral faults (bottom) plotted against ipsilateral steps and faults, respectively. Circles represent values for individual animals. The total number of contralateral steps is highly correlated with the number of ipsilateral steps for both sham and injured mice (R2 = 0.94 and 0.95, respectively). In contrast, the correlation between contralateral and ipsilateral foot faults is weaker (sham, R2 = 0.27; injured R2 = 0.42). (B) Percentage of attempted steps resulting in foot faults. Injured mice had a significantly higher percentage of contralateral foot faults compared with sham mice. The percentage of foot faults on the ipsilateral side was nearly equal in both sham and injured mice. ***p < 0.0001. (sham, n = 37; injured, n = 88)
In the beam walk task, mice were trained the day before and the day of surgery. Before surgery, mice would run easily on the top surface of the beam. However, on day 3 after surgery, injured mice had a tendency to drag the contralateral pelvic limb along the side of the beam (Fig. 2B). This was rarely observed in sham mice. This dragging was recorded for each mouse in each of the three post-surgery trials. The majority of injured mice (75 of 88) dragged the limb during all three trials, whereas most of the sham mice (32 of 37) did not drag the limb during any of the trials (X2 = 99.41, d.f. 3, p < 0.0001). In addition, many injured mice had difficulty passing the vertical posts (Fig. 2B) on the right of the beam (left-sided injury) and a few made several attempts to go around the outside of those posts. Not surprisingly, injured mice had significantly longer latencies to reach the box compared with sham mice 3 days after injury (Fig. 5).
Figure 5.

TBI effects on beam walk performance. Injured mice had significantly longer latencies than sham mice 3 days after surgery. **p < 0.005. (sham, n = 37; injured, n = 88)
In the water maze, mice were trained for 3 consecutive days, including the day of surgery. The mice were tested 6 days after surgery. As expected, injured mice performed significantly worse in all measured parameters except for velocity (Fig. 6).
Figure 6.
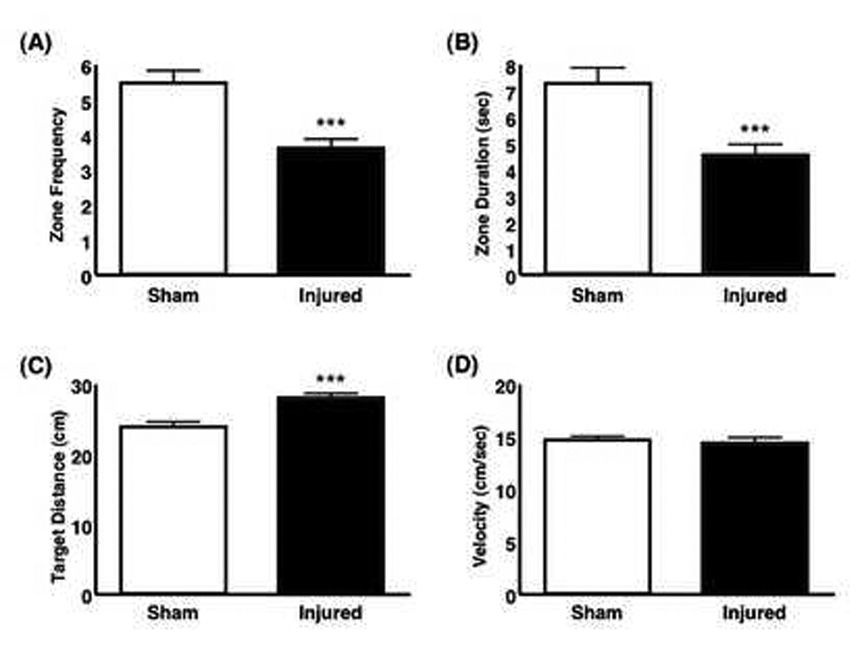
Comparison of injured and sham mice in the water maze probe test 6 days after injury. (A) A bar graph shows the number of times a mouse entered the 24 cm diameter zone encompassing the former platform location within 60 seconds of being placed into the pool. Injured mice had significantly fewer visits to the zone (p = 0.0001). (B) A bar graph shows the duration of total time spent in the 24 cm diameter zone during the 60 seconds in the pool. Injured mice spent significantly less time in the zone (p = 0.0003). (C) A bar graph shows the mean distance (cm) of the mouse from the former platform location. The mean distance from the target area was significantly larger in injured compared with sham mice (p = 0.0001). (D) Swim velocities (cm/sec) were not significantly different between sham and injured mice (p = 0.708). (sham, n = 35; injured, n = 57)
SNAP for detection of neurological deficits in brain injured mice
The SNAP score is a composite of eight separate tests (Table I, Fig. 3). Mice were evaluated both before and after surgery using the guidelines shown in Table I. A scattergram shows the distribution of SNAP scores in injured and sham mice 3 days after surgery with a line indicating the mean for each group (Fig. 7). SNAP scores were significantly higher in injured mice (8.43 ± 0.28, p < 0.0001) compared with the scores of sham-injured mice (2.59 ± 0.29).
Figure 7.
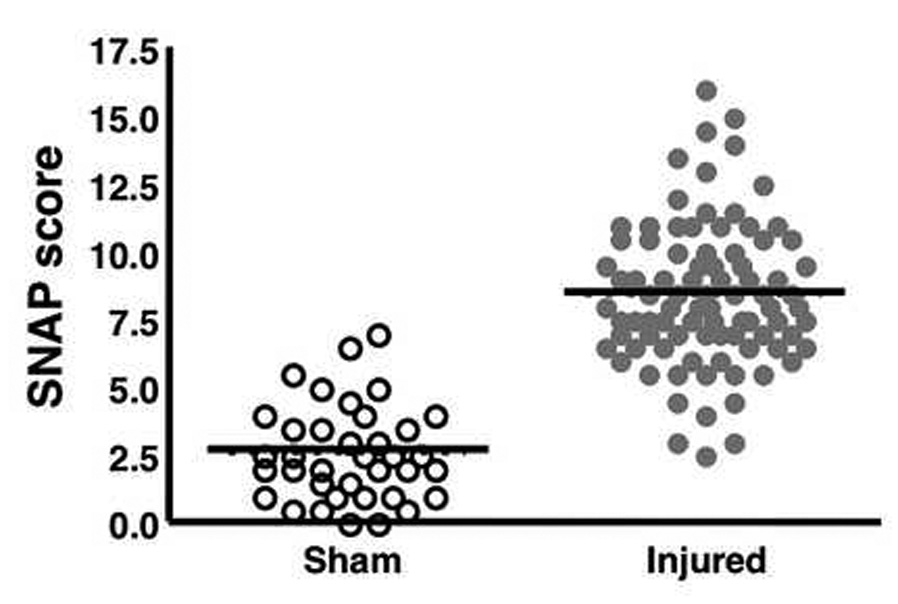
The SNAP scores in injured and sham mice. A scattergram shows the distribution of SNAP scores. Circles represent values for individual animals and the lines indicate the mean for each group (sham, 2.6 ± 0.29; injured 8.4 ± 0.28). Injured mice had significantly higher mean SNAP scores than sham mice 3 days after surgery (p < 0.0001). Median values are sham, 2.5 and injured, 8.0. (sham, n = 37; injured, n = 88)
SNAP compared favorably to the other tests of neurological function. There was a positive correlation between the SNAP score and the percent contralateral foot faults (Fig. 8A; injured: rs = 0.34, p = 0.0012; sham: rs = 0.08, p = 0.6315), which was only significant among the injured animals. Correlations of the SNAP score with beam walk latencies were also positive, again significant only among injured mice (injured: rs = 0.22, p = 0.04; sham: rs = 0.28, p = 0.094; Fig. 8B)
Figure 8.

Correlation of individual SNAP scores with foot fault and beam walk tests. (A) There was a weak, albeit significant positive correlation between the injured SNAP scores and percent of contralateral foot faults (p = 0.024); however, the correlation among the sham animals was not significant (p = 0.251). (B) There also was a significant weak positive correlation between injured SNAP scores and beam walk (p = 0.04) and no significant correlation among the sham mice (p = 0.10). Data analyzed using the Spearman Rank Correlation (rs) test (sham, n = 37; injured, n = 88).
Accuracy
Receiver-Operator Characteristics (ROC) curve analysis was used to assess accuracy. A comparison shows that the total SNAP score, percent contralateral foot faults, and beam walk exhibited AUCs of 0.971, 0.961 and 0.845, respectively (Fig. 9). There was no significant difference between SNAP and percent contralateral foot faults, z = −0.43 (p = 0.667). However, the difference in AUC between SNAP and beam walk was significant, z = 3.2 (p = 0.001), as was the difference in AUC between contralateral foot faults and beam walk, z = 2.71 (p = 0.007). Also, in a test of cognitive function, the various components of the water maze had lower AUC values than the above outcomes (water maze AUCs with 95% confidence intervals: mean distance 0.725 [0.617, 0.832], crossing frequency 0.740 [0.631, 0.849], duration 0.716 [0.600, 0.830], velocity 0.588 [0.469, 0.706]).
Figure 9.
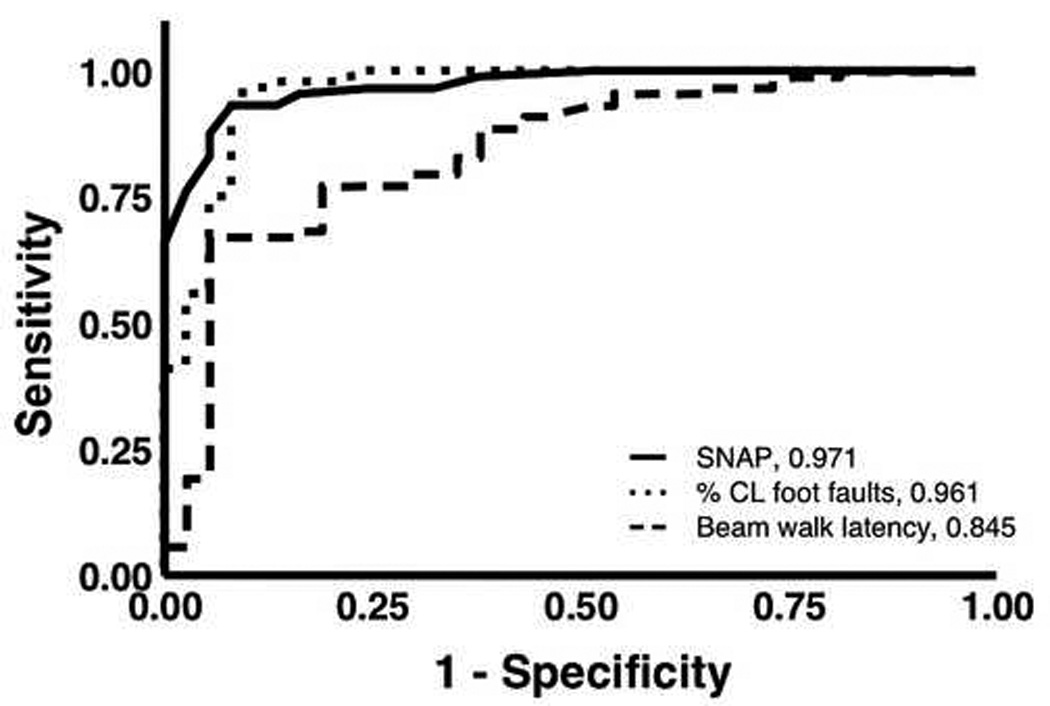
ROC curve analysis. A comparison of three tests used in this study, three days after surgery. SNAP, foot faults (%CL, percentage of contralateral faults to total steps), and beam walk have AUCs of 0.971, 0.961, and 0.845, respectively. The accuracies of both SNAP and foot fault tests were significantly higher than that of beam walk (p = 0.001 and 0.007, respectively). The difference in accuracy between SNAP and foot fault was not significant (p = 0.667). (sham, n = 37; injured, n = 88).
Individual tests composing SNAP were less accurate than the total SNAP score (Table II). In order to determine if all 8 tests contributed meaningful differences in the range of SNAP scores (Table III), AUCs were recalculated using only 7 out of the 8 tests. Only omission of the baton test resulted in a significantly lower AUC (0.936) than SNAP that included all 8 tests (p = 0.01). However, all AUCs corresponding to SNAP with one test omitted, including omission of the baton test, indicated high accuracy (range 0.936 – 0.973).
Table II. Receiver-Operator Characteristics (ROC) analysis: Accuracy of SNAP components.
Accuracy of SNAP components. ROC analysis of each of the SNAP tests shows that the overall sum (SNAP score) has higher accuracy compared to its individual components. AUC represents overall accuracy with a perfect diagnostic test having an AUC of 1.0, and a test performing no better than chance having an AUC of 0.5. The p-value represents statistical significance compared with the null hypothesis, AUC = 0.5. (sham, n = 37; injured, n = 88).
| Accuracy of SNAP components | |||
|---|---|---|---|
| Component | AUC | 95% Confidence Interval | p value |
| Interactions | 0.610 | [0.498, 0.722] | 0.0526 |
| Cage grasp | 0.658 | [0.557, 0.759 | 0.0055 |
| Visual placing | 0.812 | [0.737, 0.887] | < 0.0001 |
| Pacing or circling | 0.502 | [0.391, 0.614] | 0.9698 |
| Gait and posture | 0.790 | [0.710, 0.870] | < 0.0001 |
| Head tilt | 0.722 | [0.631, 0.813] | < 0.0001 |
| Visual field | 0.8146 | [0.738, 0.894] | < 0.0001 |
| Baton | 0.891 | [0.823, 0.958] | < 0.0001 |
| SNAP Score | 0.971 | [0.946, 0.996] | < 0.0001 |
Table III. Average contribution of each test to the total SNAP score.
Mean of the percent contribution (mean ± SEM) for each test component to its corresponding total SNAP score in injured mice at day 3 and 12–14 months after injury. The actual mean scores for each test component (± SEM) are noted in parentheses. (3 d, n = 88; 12–14 mo, n = 36). The overall SNAP score mean is 8.43 ± 0.28 at day 3 and 6.06 ± 0.36 at the 12–14 month time point.
| Test | 3 d | 12–14 m |
|---|---|---|
| Percent (value) | Percent (value) | |
| Interactions | 10.3 ± 1.08 (0.87 ± 0.09) | 10.8 ± 1.51 (0.62 ± 0.08) |
| Cage Grasp | 10.6 ± 1.08 (0.94 ± 0.09) | 7.9 ± 1.75 (0.56 ± 0.12) |
| Visual Placing | 12.0 ± 0.94 (1.02 ± 0.08) | 18.8 ± 2.42 (1.07 ± 0.11) |
| Pacing/Circling | 0.9 ± 0.35 (0.10 ± 0.04) | 4.8 ± 1.76 (0.35 ± 0.12) |
| Gait/Posture | 16.0 ± 1.01 (1.37 ± 0.09) | 17.1 ± 2.05 (1.07 ± 0.14) |
| Head Tilt | 7.2 ± 0.79 (0.68 ± 0.08) | 6.5 ± 1.54 (0.42 ± 0.09) |
| Visual Field | 17.2 ± 1.19 (1.45 ± 0.10) | 17.0 ± 2.21 (1.03 ± 0.12) |
| Baton | 25.8 ± 1.34 (2.08 ± 0.10) | 17.0 ± 2.01 (0.94 ± 0.11) |
Efficiency
In a comparison of the efficiency of the neurological tests, SNAP was the most time efficient and least costly (SNAP requires only a fiber-tipped applicator). SNAP provided a rapid assessment of lateral cortical injury, requiring less than 5 minutes per mouse. In contrast, the foot fault analysis requires videotaping a mouse walking on a grid for 2 minutes and then individually counting each step and fault for each paw. This took approximately 18 minutes per mouse. The beam walk and water maze both required extensive training prior to surgery. The examiner handled and tested each mouse for about 8 minutes per day of beam walk training or testing, totaling about 24 minutes per mouse overall. The water maze was not specifically timed. However, the minimum time required would be an additional 15 minutes per mouse per day (based on minimum time spent in the water).
Interrater reliability and agreement
To determine interrater reliability, four inexperienced examiners were trained by observing the SNAP scoring of 6 injured and sham-injured mice, referring to the guidelines in Table I. After the initial training, the examiners, blinded to injury status, evaluated additional mice over a three-week period. The mean sensitivity of their SNAP scores was 0.85 (± 0.122 SD) and the mean specificity was 0.94 (± 0.070 SD), which were consistent with the results shown in Fig. 9.
Interrater agreement was calculated by comparing SNAP scores obtained by each inexperienced examiner to those obtained by a more experienced examiner (S.B.S.) for the same mice on the same day using Cohen’s Kappa method (Cohen, 1960; Landis and Koch, 1977; Rosner, 1995). The reliability of examiners to arrive at exactly, or within 1 unit of, the same overall SNAP score was low (κ < 0.4, Table IV). Nevertheless, interrater reliability increased to good or excellent levels (Rosner, 1995) when SNAP scores within 2, 3 or 4 units were allowed to be in agreement (Table IV, 0.5 < κ < 0.9).
Table IV. Kappa coefficients for interrater reliability.
Average Kappa coefficients for interrater agreement comparing one experienced evaluator with four inexperienced evaluators. The Kappa analysis was repeated, progressively relaxing the criterion for concordance between evaluators from 0 to 4. The bolded Kappa values are those considered to indicate good or excellent interrater agreement (Rosner, 1995).
| Criterion for interrater agreement (Δ SNAP) | |||||
|---|---|---|---|---|---|
| 0 | 1 | 2 | 3 | 4 | |
| κ | 0.13 | 0.36 | 0.56 | 0.71 | 0.83 |
Power analysis
Using as few as 6 animals per group, SNAP can identify significant differences of 3 units (or greater) between multiple group means with 80% power (Table V). Finer distinctions (significant differences of 2 units) between 2 to 4 group means can be expected using 14 to 18 animals per group. The number required for the 8 individual tests to discriminate significant differences between 2 group means was, in all cases, greater than the number required for the total SNAP score (data not shown).
Table V. Statistical power of SNAP to distinguish between group means.
Statistical power of SNAP to distinguish between group means. Derivation of the number of animals required to determine significant differences (α = 0.05) between group means at power = 80% (left column) or 90% (right column). ΔSNAP = 2, 3, or 4, is the detectable difference between group mean scores. The overall standard deviation for the entire validation set (sham and injured) was 3.6. The group standard deviations for sham and injured animals were 1.8 (n = 37) and 2.6 (n = 88), respectively. The values were derived from the power curves for ANOVA tests (assumes equal group sizes (Glantz, 1992).
| Δ SNAP | ||||||
|---|---|---|---|---|---|---|
| # Groups compared |
Power = 80% | Power = 90% | ||||
| 2 | 3 | 4 | 2 | 3 | 4 | |
| 2 | 14 | < 6 | < 6 | 19 | 9 | < 6 |
| 3 | 16 | 6 | < 6 | 22 | 12 | 6 |
| 4 | 18 | 9 | < 6 | 26 | 18 | 8 |
Chronic injury
Chronic injury was measurable using SNAP (Fig. 10). Greater deficits were observed in brain-injured mice at 12–14 months post-injury (6.06 ± 0.36; Fig. 10A), compared with age-matched naïve mice (3.77 ± 0.40, p = 0.0014). Also, SNAP scores were significantly lower (indicating more intact neurological function) at the 12–14 month time point (6.06 ± 0.36) compared with the 3-day time point (8.43 ± 0.28) (Fig. 10B, p < 0.0001). In a subset of mice (n = 12) that were examined longitudinally, SNAP detected improvement in neurological function between the 3-day and 12–14 month time points (p = 0.021, Supplemental Fig. 2).
Figure 10.

Mean SNAP values in chronic injury. (A) There is a significant difference between chronic injured mice (n = 36) and age-matched naïve mice (n = 13, p = 0.0014). (B) There is a significant difference in SNAP score at 12–14 mo (6.1 ± 0.36) compared to 3 days (8.4 ± 0.28) after injury (p < 0.0001). The dotted line indicates the mean value for sham mice at day 3 after surgery (2.6 ± 0.29) for reference. (3 d, n = 88; 12–14 mo, n = 36).
Attempts were made to test beam walk, foot fault and water maze in the chronic injured and aged naïve mice. However, age-related changes, most notably arthritis, hampered their ability to stay on the beam or move around on the foot fault grid. Also, many of the aged mice were unable to complete the water maze training.
There were differences in the contribution of individual SNAP components to the total SNAP score as a function of chronicity (Table III). The baton (27%) was the highest contributor to SNAP scores in injured mice after 3 days. Visual field (17%) and gait/posture (15%) components were the next highest contributors at that time point. For chronic injuries, four components had nearly equivalent contribution: visual placing (19%), gait/posture (17%), visual field (17%) and baton (17%). Interestingly, the pacing/circling component contributed the least to injured scores in all injured mice, but the contribution became stronger in chronic mice (5%) compared with acutely injured mice (< 1%).
Injury Severity
A comparison was made for injury severity in a separate cohort of C57BL/6 mice (n=19). Mice were injured with either a piston depth of 1.0 (n = 10) or 1.25 mm (n = 9). SNAP scores were determined at day 3 after injury. One of the mice injured with a piston depth of 1.25 mm showed very little neurological deficit (SNAP score of 1.0), which was consistently observed among 3 separate blinded examiners (data not shown). This mouse also performed similarly to the sham-injured group on the beam walk. Because of this mouse, the difference between these two groups was not statistically significant (Fig. 11, p = 0.067). However, when the score from this mouse was omitted, the difference between the two groups of mice was significant (graph not shown, p = 0.017).
Figure 11.
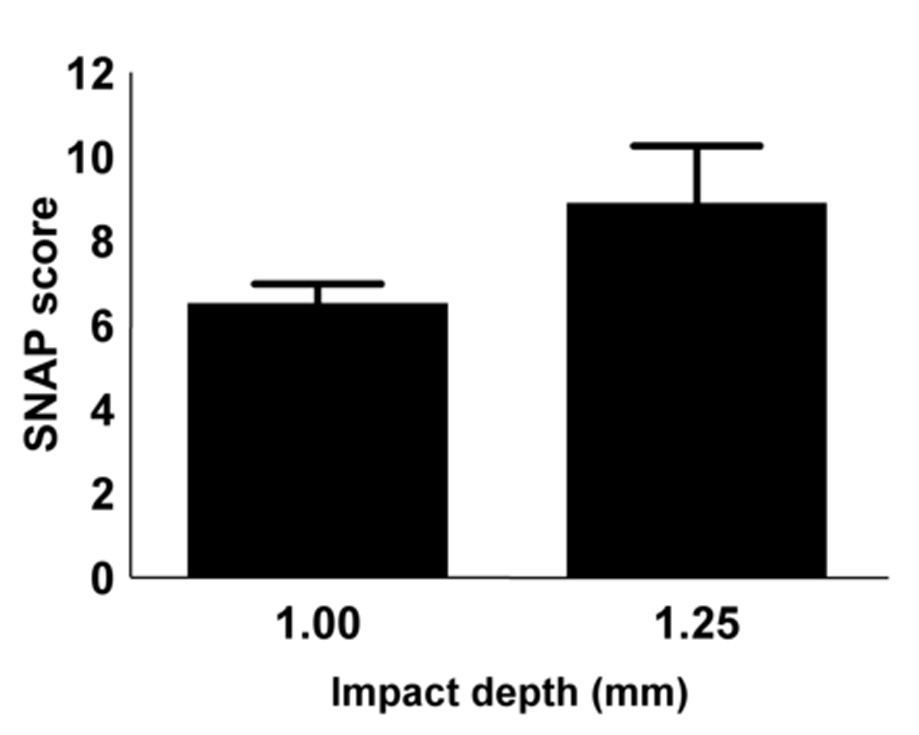
SNAP scores obtained at day 3 from C57BL/6 mice injured using a piston depth of either 1.00 mm (n = 10) or 1.25 mm (n = 9). There was a trend toward higher SNAP scores with greater injury severity (p = 0.067, Mann Whitney test).
Discussion
Several protocols have been established to evaluate mouse neurological status. One such protocol, the Irwin Observational Test Battery, systematically assessed 50 categories of observations (e.g., pupil size, gait, skin color, body temperature, tail pinch). It was developed to evaluate pharmacological responses in mice (Crawley, 2000). Another group designed an exhaustive series of behavioral, neurophysiological, histopathological, and imaging analyses (“SHIRPA”, Rogers et al., 1997). However, this excellent tool for comprehensive characterization of neurological differences between mouse strains (Lalonde et al., 2005; Rogers et al., 1999) requires large amounts of time and expensive instrumentation.
There are tests that evaluate neurological deficits specific to unilateral brain injury. The corner test (Zhang et al., 2002) was developed to test chronic (90 days) sensorimotor deficits after focal cerebral ischemia. In this test, the mouse was placed facing a 30° corner. After the mouse reached the corner, it would rear up and turn around. The turn direction was recorded for ten repetitions. Like SNAP, the corner test was reliable and inexpensive. However, SNAP has the advantage of covering a broader range of neurological deficits. In this study, foot fault and beam walking were also reliable tests of asymmetric proprioceptive and motor coordination deficits (Hernandez and Schallert, 1988; Maier, 1935), but were time-consuming and/or required elaborate testing apparatuses.
SNAP evaluated several parameters affected by brain injury (coordination, strength, proprioception, vision, gait and mental status/affect), yet could be completed in just a few minutes for each mouse. As the mouse was removed from the cage, interaction with the handler and cage grasp were evaluated. Contralateral strength was evaluated through the cage grasp test. Truncal strength was a major part of the visual placing test, as were vision and coordination. Most of the injured mice had contralateral proprioceptive deficits, consistent with a parietal cortex lesion. These deficits were observed in the gait/posture and in the baton test. The visual field test was a little more difficult for the inexperienced testers to score, initially, than the other components. It became easier when the reactions to a moving object in the ipsilateral and contralateral field were compared for each mouse.
Any subjective assessment of neurological function needs to permit the possibility of an ambiguous response, as is the case for SNAP (Table I). Although many mice received an ambiguous score in at least one component, SNAP scores were consistently higher in the injured compared with sham mice (Fig. 7). Thus, some deviation from normal performance was detected without having to necessarily assign a score corresponding to a clearly defined deficit in every test, which, overall, tended to make SNAP a robust measure of neurological status.
ROC curve analysis was used to demonstrate the accuracy of SNAP. The AUCs for all but one of the individual component scores (pacing/circling) showed significant, or nearly significant deviation in the case of interactions, from chance (Table II) and together were very accurate in assessing deficits relating to TBI. A subtractive ROC analysis showed that only the baton test, when omitted, significantly decreased the AUC compared to that corresponding to all 8 tests. That the accuracy of SNAP is not substantially reduced by omitting any test suggests that, overall, this assessment method is robust and not overly dependent on the outcome of one or a subset of the tests. Pacing/circling was not significantly accurate in detecting deficits under the conditions of the injury and the time points used in this study. Given that this test may reveal deficits under other conditions, requires little time or effort, and its omission does not significantly affect overall SNAP accuracy, there is little reason to drop it from the SNAP battery.
The SNAP exam discriminated relatively small improvements of neurological function over time as statistically significant (change of ~2 SNAP units, Fig. 10B). The method revealed both sustained deficits and recovery of function months after injury (Fig. 10A,B, Supplemental Fig. 2). In contrast, no chronic changes were noted in water maze performance in the few mice that were able to complete the training (data not shown). Furthermore, many of the chronic injured mice (and aged naïve mice) fell from the beam and ambulated poorly on the foot fault grid.
SNAP was found to be a rapid and efficient discriminatory tool for evaluating neurological status after moderate TBI. The SNAP score was not compromised by the lack of a deficit in any of the 8 tests because it is the sum, rather than the average, of the tests. Also, the contribution of individual test components was important to the overall SNAP score (Table II). During the first hour of surgical recovery, it was commonly noted that the injured mice paced toward the contralateral side, but this was rarely observed at 3 days or 12–14 months. Thus, this deficit appears to be transient, manifesting only acutely after this particular injury. Again, pacing/circling may be a more important component of SNAP in injuries involving other brain regions, and because all of the eight tests are simple to perform and not time consuming, we include all eight tests as part of the SNAP score.
Inexperienced observers were easily trained and able to perform the test with high sensitivity and specificity. Cohen’s Kappa method showed low interrater agreement when requiring the exact same SNAP score, but when allowance was made for agreement of SNAP scores within a few units, the Kappa coefficient increased to κ ≥ 0.5. This suggests that interrater variability limits the precision of SNAP to detect reliable group differences less than 2 units but differences of 2 units or greater may be robustly detected.
The differences in SNAP scores between acute and chronic injured mice (Fig. 10B) suggest that SNAP may be used to assess functional recovery after brain injury in mice. Moreover, SNAP can discriminate between different severities of injury. The data show higher SNAP scores for a piston depth of 1.25 mm compared with 1.0 mm (Fig. 11). One of the 1.25 mm injury mice had a low SNAP score (1.0, consistent among 3 blinded examiners). Due to inherent biological variability, injured animals respond with different degrees of neurological impairment, even after severe injuries (Ruff et al., 1993). In this case, the mechanical parameters of the injury were not predictive of neurological impairment. Beam walk, an independent test of neurological function, confirmed that this animal performed similarly to sham-injured mice (data not shown).
In conclusion, the current study shows that SNAP is a highly accurate, reliable, and efficient measure of neurological deficits. The SNAP exam is less physically challenging for the mouse than other tests of neurological function, making it more amenable for use with aged mice or mice with comorbidities. The individual tests within SNAP are straightforward, require only a fiber-tipped applicator to perform, and are, together, at least as accurate as previously established measures. Thus, SNAP represents a rapid, economical, and comprehensive method to evaluate neurological outcomes and functional recovery in brain-injured mice.
Supplementary Material
No detectable differences in test scores of brain injured mice grouped by genotype (see Methods, Sullivan et al., 1997). (A) Foot Fault. There was no significant genotype effect in day 3 contralateral foot faults (% of total contralateral steps; p = 0.087, ANOVA). (B) Beam Walk. There was no significant genotype effect in day 3 beam walk latencies (p = 0.077, ANOVA). (C) Water Maze. No significant differences were observed 6 days after injury in mean target distances across the genotypes (p = 0.182, ANOVA). (D) SNAP. There was no significant genotype effect detected using SNAP (p = 0.217, Kruskal-Wallis test).
SNAP detects functional recovery in chronic injury. There is a significant improvement in SNAP scores 12–14 months after injury (6.04 ± 0.51) compared with 3 days after injury (8.0 ± 0.68) in a subset of mice that were examined longitudinally (p = 0.021; n = 12).
Acknowledgments
We wish to thank Dr. Mary Jo LaDu for providing mice; Kristina Bielewicz and Dr. Aixiang Xue for their valuable technical assistance, as well as our chairman, Dr. Raj K. Narayan (University of Cincinnati, Department of Neurosurgery), for his continued support and encouragement. This work was funded in part by NINDS R01 NS38654 (K.I.S), and R01 AG20249 (K.A.C).
Footnotes
Publisher's Disclaimer: This is a PDF file of an unedited manuscript that has been accepted for publication. As a service to our customers we are providing this early version of the manuscript. The manuscript will undergo copyediting, typesetting, and review of the resulting proof before it is published in its final citable form. Please note that during the production process errors may be discovered which could affect the content, and all legal disclaimers that apply to the journal pertain.
References
- Baskin YK, Dietrich WD, Green EJ. Two effective behavioral tasks for evaluating sensorimotor dysfunction following traumatic brain injury in mice. J Neurosci Methods. 2003;129:87–93. doi: 10.1016/s0165-0270(03)00212-7. [DOI] [PubMed] [Google Scholar]
- Cohen JA. A coefficient of agreement for nominal scales. Educ Psychol Meas. 1960;20:37–46. [Google Scholar]
- Crawley JN. What's Wrong with My Mouse? Behavioral Phenotyping of Transgenic and Knockout Mice. Vol. 65. NY: Wiley-Liss; 2000. [Google Scholar]
- Fox GB, LeVasseur RA, Faden AI. Behavioral responses of C57BL/6, FVB/N, and 129/SvEMS mouse strains to traumatic brain injury: implications for gene targeting approaches to neurotrauma. J Neurotrauma. 1999;16:377–389. doi: 10.1089/neu.1999.16.377. [DOI] [PubMed] [Google Scholar]
- Fujimoto ST, Longhi L, Saatman KE, McIntosh TK. Motor and cognitive function evaluation following experimental traumatic brain injury. Neurosci Biobehav Rev. 2004;28:365–378. doi: 10.1016/j.neubiorev.2004.06.002. [DOI] [PubMed] [Google Scholar]
- Glantz SA. Primer of Biostatistics. New York: McGraw Hill; 1992. [Google Scholar]
- Hamm RJ, Dixon CE, Gbadebo DM, Singha AK, Jenkins LW, Lyeth BG, Hayes RL. Cognitive deficits following traumatic brain injury produced by controlled cortical impact. J Neurotrauma. 1992;9:11–20. doi: 10.1089/neu.1992.9.11. [DOI] [PubMed] [Google Scholar]
- Hanley JA, McNeil BJ. The meaning and use of the area under a receiver operating characteristic (ROC) curve. Radiology. 1982;143:29–36. doi: 10.1148/radiology.143.1.7063747. [DOI] [PubMed] [Google Scholar]
- Hanley JA, McNeil BJ. A method of comparing the areas under receiver operating characteristic curves derived from the same cases. Radiology S. 1983;148:839–843. doi: 10.1148/radiology.148.3.6878708. [DOI] [PubMed] [Google Scholar]
- Hernandez TD, Schallert T. Seizures and recovery from experimental brain damage. Exp Neurol. 1988;102:318–324. doi: 10.1016/0014-4886(88)90226-9. [DOI] [PubMed] [Google Scholar]
- Lalonde R, Dumont M, Staufenbiel M, Strazielle C. Neurobehavioral characterization of APP23 transgenic mice with the SHIRPA primary screen. Behav Brain Res. 2005;157:91–98. doi: 10.1016/j.bbr.2004.06.020. [DOI] [PubMed] [Google Scholar]
- Landini G. How to correct background illumination in brightfield microscopy. 2006 [Google Scholar]
- Landis JR, Koch GG. The measurement of observer agreement for categorical data. Biometrics. 1977;33:159–174. [PubMed] [Google Scholar]
- Leker RR, Shohami E, Constantini S. Experimental models of head trauma. Acta Neurochir Suppl. 2002;83:49–54. doi: 10.1007/978-3-7091-6743-4_9. [DOI] [PubMed] [Google Scholar]
- Maier NRF. The cortical area concerned with coordinated walking in the rat. J Comp Neurol. 1935;61:395–405. [Google Scholar]
- McIntosh TK, Vink R, Noble L, Yamakami I, Fernyak S, Soares H, Faden AL. Traumatic brain injury in the rat: characterization of a lateral fluid-percussion model. Neuroscience. 1989;28:233–244. doi: 10.1016/0306-4522(89)90247-9. [DOI] [PubMed] [Google Scholar]
- Morris RGM. Development of a water-maze procedure for studying spatial learning in the rat. J Neurosci Methods. 1984;11:47–60. doi: 10.1016/0165-0270(84)90007-4. [DOI] [PubMed] [Google Scholar]
- Motulsky HJ. Prism 4 Statistics Guide -Statistical Analyses for Laboratory and Clinical Researchers. Vol. 122. San Diego CA: GraphPad Software Inc; 2003. [Google Scholar]
- Nakamura M, Saatman KE, Galvin JE, Scherbel U, Raghupathi R, Trojanowski JQ, McIntosh TK. Increased vulnerability of NFH-LacZ transgenic mouse to traumatic brain injury-induced behavioral deficits and cortical damage. J Cereb Blood Flow Metab. 1999;19:762–770. doi: 10.1097/00004647-199907000-00006. [DOI] [PubMed] [Google Scholar]
- Rogers DC, Fisher EMC, Brown SDM, Peters J, Hunter AJ, Martin JE. Behavioral and functional analysis of mouse phenotype: SHIRPA, a proposed protocol for comprehensive phenotype assessment. Mamm Genome. 1997;8:711–713. doi: 10.1007/s003359900551. [DOI] [PubMed] [Google Scholar]
- Rogers DC, Jones DN, Nelson PR, Jones CM, Quilter CA, Robinson TL, Hagan JJ. Use of SHIRPA and discriminant analysis to characterise marked differences in the behavioural phenotype of six inbred mouse strains. Behav Brain Res. 1999;105:207–217. doi: 10.1016/s0166-4328(99)00072-8. [DOI] [PubMed] [Google Scholar]
- Rosner B. Fundamentals of Biostatistics. Belmont, CA: Wadsworth Publishing Company; 1995. [Google Scholar]
- Ruff RM, Marshall LF, Crouch J, Klauber MR, Levin HS, Barth J, Kreutzer J, Blunt BA, Foulkes MA, Eisenberg HM, Jane JA, Marmarou A. Predictors of outcome following severe head trauma: follow-up data from the Traumatic Coma Data Bank. Brain Inj. 1993;7:101–111. doi: 10.3109/02699059309008164. [DOI] [PubMed] [Google Scholar]
- Smith DH, Okiyama K, Thomas MJ, Claussen B, McIntosh TK. Evaluation of memory dysfunction following experimental brain injury using the Morris water maze. J Neurotrauma. 1991;8:259–269. doi: 10.1089/neu.1991.8.259. [DOI] [PubMed] [Google Scholar]
- Smith DH, Soares HD, Pierce JS, Perlman KG, Saatman KE, Meaney DF, Dixon CE, McIntosh TK. A model of parasagittal controlled cortical impact in the mouse: cognitive and histopathologic effects. J Neurotrauma. 1995;12:169–178. doi: 10.1089/neu.1995.12.169. [DOI] [PubMed] [Google Scholar]
- Statler KD, Jenkins LW, Dixon CE, Clark RS, Marion DW, Kochanek PM. The simple model versus the super model: translating experimental traumatic brain injury research to the bedside. J Neurotrauma. 2001;18:1195–1206. doi: 10.1089/089771501317095232. [DOI] [PubMed] [Google Scholar]
- Sullivan PM, Mezdour H, Aratani Y, Knouff C, Najib J, Reddick RL, Quarfordt SH, Maeda N. Targeted replacement of the mouse apolipoprotein E gene with the common human APOE3 allele enhances diet-induced hypercholesterolemia and atherosclerosis. J Biol Chem. 1997;272:17972–17980. doi: 10.1074/jbc.272.29.17972. [DOI] [PubMed] [Google Scholar]
- Swets JA. Measuring the accuracy of diagnostic systems. Science. 1988;240:1285–1293. doi: 10.1126/science.3287615. [DOI] [PubMed] [Google Scholar]
- Thurman D, Guerrero J. Trends in hospitalization associated with traumatic brain injury. JAMA. 1999;282:954–957. doi: 10.1001/jama.282.10.954. [DOI] [PubMed] [Google Scholar]
- Zhang L, Schallert T, Zhang ZG, Jiang Q, Arniego P, Li Q, Lu M, Chopp M. A test for detecting long-term sensorimotor dysfunction in the mouse after focal cerebral ischemia. J Neurosci Methods. 2002;117:207–214. doi: 10.1016/s0165-0270(02)00114-0. [DOI] [PubMed] [Google Scholar]
Associated Data
This section collects any data citations, data availability statements, or supplementary materials included in this article.
Supplementary Materials
No detectable differences in test scores of brain injured mice grouped by genotype (see Methods, Sullivan et al., 1997). (A) Foot Fault. There was no significant genotype effect in day 3 contralateral foot faults (% of total contralateral steps; p = 0.087, ANOVA). (B) Beam Walk. There was no significant genotype effect in day 3 beam walk latencies (p = 0.077, ANOVA). (C) Water Maze. No significant differences were observed 6 days after injury in mean target distances across the genotypes (p = 0.182, ANOVA). (D) SNAP. There was no significant genotype effect detected using SNAP (p = 0.217, Kruskal-Wallis test).
SNAP detects functional recovery in chronic injury. There is a significant improvement in SNAP scores 12–14 months after injury (6.04 ± 0.51) compared with 3 days after injury (8.0 ± 0.68) in a subset of mice that were examined longitudinally (p = 0.021; n = 12).