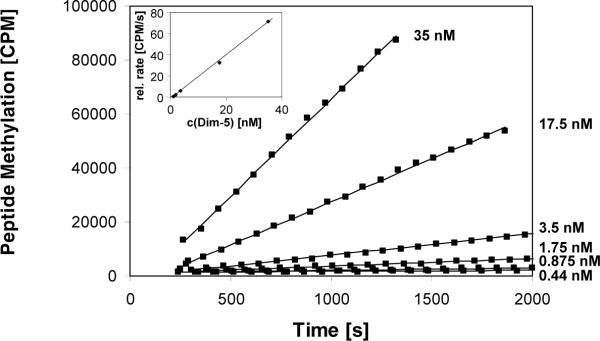
Figure 2. Validation of the assay.
The continuous peptide methylation assay responds linearly with respect to enzyme concentration. Peptide methylation experiments were carried out at different enzyme concentrations ranging from 0.44 to 35 nΜ in wells coated with 320 pmol peptide. Initial slopes were determined and plotted against the enzyme concentration (insert). The standard error of the initial slopes of the linear regressions, as determined using Excel Analysis Functions at 95% confidence interval, was smaller than 10% in each case. The regression line of the secondary plot had an R value of 0.9993, and its slope has a standard error of ±2%.

