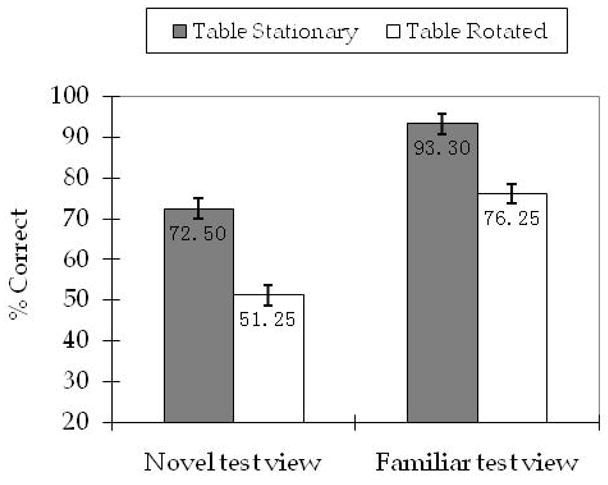
Figure 2.

Correct percentage in detecting position change as the function of table movement and test view in Experiment 1. (Error bars are confidence intervals corresponding to ±1 standard error of the mean, as estimated from the analysis of variance.)
