

Abstract
High-glucose/low-dose insulin-mediated insulin resistance of glucose transport was studied in 3T3-L1 adipocytes. In this model, proximal insulin signaling, including insulin receptor substrate (IRS)-1-bound phosphatidylinositol 3-kinase (PI 3-kinase) activation, is preserved, but insulin-stimulated protein kinase B (Akt) activation is markedly impaired. To assess a difference in acute insulin-stimulated production of phosphatidylinositol 3,4,5-trisphosphate [PtdIns(3,4,5)P3], cells were labeled with [32P]orthophosphate, and glycerophosphoinositides were quantified by HPLC. Although basal PtdIns(3,4,5)P3 was similar, insulin stimulated its production 33.6% more in controls (P < 0.03) than in insulin-resistant cells. Phosphatase and tensin homolog deleted on chromosome 10 (PTEN) protein, a lipid phosphatase that dephosphorylates PtdIns(3,4,5)P3 in the 3-position, was significantly and specifically increased in insulin-resistant cells. Treatment with rapamycin [a specific inhibitor of mammalian target of rapamycin complex 1 (mTORC1)] inhibited the increased PTEN expression and partially restored insulin-stimulated glucose transport and Akt activation to insulin-resistant cells. Acute insulin markedly stimulated Ser636/639 phosphorylation of IRS-1; this was rapamycin inhibited but was significantly decreased in cells that had been preexposed to insulin, whereas total IRS-1 was unaffected. These findings were essentially paralleled by changes in the activation of p70 S6 kinase and S6-ribosomal protein. Overexpression of uncoupling protein-1 or manganese superoxide dismutase did not prevent the development of insulin-resistant glucose transport and impaired Akt activation in high-glucose/low-insulin-pretreated cells. The insulin resistance associated with glucotoxicity in our model reflects in part decreased availability of PtdIns(3,4,5)P3, which correlates with increased PTEN protein expression. Chronic activation of mTORC1 plays a role in stimulating PTEN expression and possibly in activation or induction of a phosphoprotein phosphatase. No evidence was found for a role for increased mitochondrial superoxide production in this model.
Keywords: phosphatidylinositol 3,4,5-trisphosphate; phosphatase and tensin homolog deleted on chromosome 10; mammalian target of rapamycin complex 1; rapamycin; protein kinase B
one of the major metabolic effects of insulin is stimulation of glucose utilization. The rate-limiting step in this process is stimulation of glucose transport by cells expressing the insulin-responsive glucose transporter GLUT4, which translocates from an intracellular compartment to the plasma membrane (PM) in response to insulin (15, 24). GLUT4 expression is essentially limited to skeletal and heart muscle and to adipocytes. Insulin resistance is the hallmark of type 2 diabetes but is also associated with numerous other conditions, e.g., obesity, disuse or denervation in muscles, polycystic ovary syndrome, etc. Clinically, it is defined as the reduced blood glucose-lowering effect of insulin. Although the mechanism(s) by which insulin promotes GLUT4 translocation are still incompletely understood, there is consensus that phosphatidylinositol (PI) 3-kinase mediated activation (phosphorylation) of protein kinase B (Akt) is an essential step. When insulin binds to the α-subunit of the insulin receptor, the intracellular β-subunit becomes activated by phosphorylation of certain tyrosine (Tyr) residues, which in turn cause binding and activation (Tyr phosphorylation) of the insulin receptor substrate (IRS) proteins, with IRS-1 being the most important in cells that respond to insulin with GLUT4 translocation. Tyr-phosphorylated IRS-1 binds the p85 subunit of PI 3-kinase, which activates the enzyme, leading to generation of phosphatidylinositol 3,4,5-trisphosphate [PtdIns(3,4,5)P3] and phosphatidylinositol 3,4-bisphosphate [PtdIns(3,4)P2] from phosphatidylinositol 4,5-bisphosphate [PtdIns(4,5)P2] and phosphatidylinositol 4-phosphate, respectively. The expression of these residues attracts molecules that express pleckstrin homology (PH) domains, such as Akt, which translocates to the inner leaflet of the PM where it binds with high affinity to 3-phosphoinositides. This causes a conformational change that renders Akt susceptible to phosphorylation by phosphatidylinositol-dependent kinase (PDK) 1 on Thr308 and by PDK2 [which has recently been identified as the mammalian target of rapamycin (mTOR)/rictor complex (mTORC) 2] on Ser473, leading to full Akt activation (24, 27, 29).
Because insulin resistance develops in response to multiple stimuli, it is not surprising that different mechanisms may be involved. For example, in fatty acid-induced insulin resistance (lipotoxicity) in muscle, the rate-limiting defect appears to occur in the proximal portion of the insulin-signaling cascade, at the level of IRS-1 activation. This reflects stimulation of certain protein kinase C isoforms by diacylglycerol, which in turn promote Ser/Thr phosphorylation of IRS-1 on certain residues, which decreases Tyr phosphorylation of IRS-1 in response to the insulin receptor, decreases PI 3-kinase activation by IRS-1, and may promote IRS-1 degradation. The end result is a marked reduction in insulin-stimulated Akt activation. This mechanism appears to be important in the etiology of insulin resistance in human type 2 diabetes (24).
We have studied a model of high-glucose/insulin-induced insulin resistance in 3T3-L1 adipocytes, which mimics the effects of “glucotoxicity.” This term has been coined based on studies in experimental animals and humans, which showed that prolonged exposure to high glucose impairs the subsequent insulin response of glucose transport (26, 40). Garvey et al. (9) reported in primary rat adipocytes that preexposure to high glucose acted synergistically with preexposure to a physiological insulin dose in reducing the response of glucose transport to stimulation by insulin. In the model described here, 3T3-L1 adipocytes are preexposed for 18 h to 5 or 25 mM glucose with or without a relatively low dose of insulin (0.6 nM) in media containing 1% FBS. They are then equilibrated for 2 h in media devoid of FBS or insulin to allow glucose transport to return to normal and then stimulated or not for 15 min with insulin, followed by a 3-min measurement of glucose transport. Only the cells that were preexposed to high glucose in the presence of insulin show a 40-60% reduction in maximally insulin-stimulated glucose transport compared with the other three groups. There were no differences in GLUT1 or GLUT4 expression, and the proximal insulin signaling cascade appeared to be intact as judged by the insulin response of IRS-1-bound PI 3-kinase activity (20, 21). However, there were marked differences between groups in insulin-stimulated Akt activation. Compared with cells that were preincubated in 5 mM glucose without insulin, high glucose alone modestly impaired Akt activation, insulin in low glucose was much more effective, and the effects of high glucose and insulin were additive in impairing insulin-stimulated Akt activation. Note, however, that only the latter condition resulted in impaired insulin-stimulated glucose transport (22).
When 3T3-L1 adipocytes are chronically exposed to pharmacological doses of insulin (100 nM or greater), there is a marked diminution of the proximal insulin signaling molecules, particularly IRS-1, as a result of IRS-1 Ser/Thr phosphorylation and degradation. This phenomenon is thought to be primarily orchestrated by overstimulation of TORC1 (12, 41). However, this does not occur when these cells are preexposed to high physiological concentrations of insulin, although insulin resistance of glucose transport and of Akt activation develops in both instances. The experiments presented here describe our attempts to understand the mechanisms involved.
RESEARCH DESIGN AND METHODS
Cell Culture and Glucose Transport Assay
3T3-L1 fibroblasts were differentiated into adipocytes as previously described (20). Experiments were performed on days 8-12 from the initiation of the differentiation protocol, when >95% of the cells exhibited the adipocyte phenotype. They were maintained in DMEM containing 25 mM glucose and 10% FBS. Before experiments, cells were incubated for 18 h in DMEM containing 1% FBS and either 5 or 25 mM glucose, with or without 0.6 nM insulin. They were then serum and insulin deprived for 2 h and, after washing, placed in Krebs-Ringer-bicarbonate-HEPES (KRBH) buffer without glucose for 10 min and then incubated with or without an acute insulin dose (100 or 0.6 nM) for 15 min. Glucose transport was measured as the uptake of 2-deoxy-d-glucose for 3 min as previously described (20) and normalized to protein concentration determined by Coomassie Protein Reagent (Pierce).
Measurement of Phosphoinositide Levels in 3T3-L1 Adipocytes (Adapted from Ref. 6)
Phosphoinositide pool labeling and insulin stimulation
3T3-L1 fibroblasts were cultured and differentiated according to the standard protocol in 100-mm tissue culture dishes (20). After the differentiation protocol was initiated (10 days), cells were washed with PBS and placed in DMEM containing 1% FBS and either 5 mM glucose or 25 mM glucose + 0.6 nM insulin for 18 h. Cells were washed with PBS-0.5% BSA and placed in serum- and phosphate-free DMEM containing 0.5% BSA, 5 or 25 mM glucose, and 1 mCi/ml [32P]orthophosphate (MP Biomedicals) for 4 h. In preliminary experiments, we established that phosphate deprivation did not alter the subsequent insulin response in either group of cells. Cells were stimulated or not with 100 nM insulin for 5 min, then washed with PBS, and incubated in ice-cold 10% TCA on ice for 30 min. Cells were scraped in this medium and centrifuged for 5 min at 20,000 g. Pellets were resuspended in 5% TCA and 1 mM EDTA and centrifuged as before, and pellets were stored at -80°C.
Lipid extraction
Pellets were resuspended in 1.25 ml chloroform-methanol-HCl concentration (40:80:1) by vortexing 15 s four times with sample on ice for 15-s intervals and then sonicated on ice for 10 min, and the whole process was repeated. Samples were divided into two 0.62-ml aliquots, and after 0.42 ml chloroform and 0.75 ml of 0.1 M HCl were added, they were vortexed vigorously for 1 min and centrifuged at 10,000 g for 3 min, and the aqueous and organic layers were separated. Ammonia (1 M, 50 μl) was added to the organic layer, chloroform (0.4 ml) was added to the aqueous layer and interphase, and the samples were vortexed and centrifuged as in the previous step. The organic layers were combined, neutralized with 84 μl of 1 M NH4OH, and evaporated under vacuum.
Deacylation of phosphoinositides
Dried pellets were resuspended in 0.5 ml of methylamine reagent (1.1 ml 40% methylamine-1.8 ml methanol-0.456 ml n-butanol-0.644 ml water) by sonication for 10 min with occasional vortexing. Mixtures were heated at 53°C for 50 min and then evaporated to dryness.
Extraction of glycerophosphoinositides
Pellets were resuspended in 0.75 ml of distilled water by sonication then extracted with 0.5 ml n-butanol-petroleum ether-ethyl formate (20:4:1). Samples were vortexed vigorously for 1 min and then centrifuged for 3 min at 10,000 g. The aqueous phase was saved and extracted two more times with 0.5 ml of the organic extraction solution, evaporated to dryness, and stored at -80°C until analysis.
HPLC analysis of glycerophosphoinositides
HPLC analysis was performed on a 4.6 × 250 mm Partisil 10 SAX anion exchange column eluted with the following concentrations of ammonium phosphate, pH 3.8 in the mobile phase at a flow rate of 1 ml/min: 5 min isocratic 10 mM, 60 min linear gradient from 10 to 800 mM, 10 min linear gradient from 800 mM to 1 M, and 10 min isocratic 1 M. Fractions were collected every 20 s, mixed with scintillation fluid, and analyzed in a scintillation counter. Radioactive content was normalized to the amount of radioactivity in the glycerophosphoinositide 4,5-bisphosphate [gI(4,5)P2] peak and plotted against fraction number, and the area of the peaks was quantified using NIH Image software. The eluates were standardized by the location of ATP, ADP, and AMP standards (6) and by that of 32P-labeled glycerophosphoinositide 3,4,5-trisphosphate [gI(3,4,5)P3]. The latter was prepared by labeling PtdIns(4,5)P2 with [γ-32P]ATP in the presence of active PI 3-kinase expressed in baculovirus (a generous gift of Dr. Alex Toker, Harvard University, School of Medicine).
Electroporation of 3T3-L1 Adipocytes for Introduction of Green Fluorescent Protein-Labeled PH Domain Peptides
The green fluorescent protein (GFP) fusion of the PH domain of general receptor for phosphoinositides-1 (GRP1) expressed in pEGFP-C1 (Clontech) was a kind gift of Dr. Mark Lemmon (Univ. of Pennsylvania); the GFP fusion of the Akt PH domain in the same plasmid was a generous gift of Dr. Dario Alessi (University of Dundee, Scotland, UK). The plasmids were amplified in DH5-α Escherichia coli and purified by CsCl gradient centrifugation.
Differentiated adipocytes on day 9 postinitiation of differentiation were washed with PBS and trypsinized for 10 min at 37°C, and then DMEM containing 25 mM glucose and 10% FBS were added, and cells were pelleted and washed two times with PBS. Cells were resuspended in 0.5 ml PBS at a concentration of 2 × 10⁷ cells/ml and electroporated with 100 μg pPH-GRP1GFP or with pPH-AktGFP at 160 V, 975 μF using a Gene Pulser II (Bio-Rad) and a 0.4-mm gap cuvette (25). Cells were diluted with 1 ml of DMEM containing 25 mM glucose and 10% FBS, floating debris was removed, and cells were reseeded at a density of 3.5 × 10⁵ cells/cm2 in six-well dishes containing 22-mm cover slips coated with collagen VI (Sigma). After overnight incubation in DMEM containing 25 mM glucose and 10% FBS, the medium was refreshed for 6 h and then replaced with DMEM containing 1% FCS and 5 mM glucose or 25 mM glucose with 0.6 nM insulin for 18 h. Cells were serum deprived for 2 h in DMEM containing 0.5% BSA and 5 or 25 mM glucose. Cells were stimulated or not with 100 nM insulin for 5 min, washed with PBS, fixed in 4% paraformaldehyde for 15 min, washed and treated with Slow Fade (Molecular Probes), and stored at 4°C in the dark until analyzed by confocal microscopy using a Leica LCS SP2 AOB confocal microscope. Ten fields from each dish were examined and photographed for later analysis using a ×63 objective. Translocation to the PM was assessed by two individuals in a blinded fashion, assigning scores of 1-10 for the degree of translocation to the PM. The proportion of cells that was successfully electroporated varied between experiments from 20 to 50%; each field that was scored contained at least one complete image of a transfected cell.
Adenovirus Infection
Adenoviruses expressing uncoupling protein (UCP)-1 or manganese superoxide dismutase (MnSOD) (7, 23, 39) or empty controls were kindly provided by Dr. Michael Brownlee, Albert Einstein College of Medicine, Bronx, NY. The adenoviruses were amplified in human embryonic kidney 293 cells, purified, and titrated as previously described (25). 3T3-L1 adipocytes were infected on day 6 of the differentiation protocol, and the experiments were performed 5 days later, following the protocol established in Ref. 25. Successful infection was documented by Western blots for UCP-1 or MnSOD.
Western Blots
Total postnuclear cell lysates were prepared in lysis buffer as previously described (20, 25). Cell extracts (20 μg protein) were separated on 7, 10, or 12% SDS-PAGE and transferred to nitrocellulose. They were blocked for 1 h and then incubated overnight in blocking buffer containing one of the following: rabbit polyclonal P-Akt (Ser473) antibody, rabbit phosphatase and tensin homolog deleted on chromosome 10 (PTEN) antibody (both 1:1,000; Cell Signaling), goat UCP-1 antibody (1:200; Santa Cruz Biotechnology), rabbit MnSOD antibody (1:1,000; Upstate Biotechnology), rabbit P-IRS-1(Ser636/639) antibody, rabbit P-p70 S6 kinase-β (Thr389) antibody, or rabbit P-S6 ribosomal protein (Ser240/244) antibody (1:1,000; all three from Cell Signaling). After being washed, membranes were incubated in goat anti-rabbit IgG or donkey anti-goat IgG (both 1:10,000; Jackson Immunoresearch) for 1 h, washed, developed with West Pico ECL Reagent (Pierce), exposed to film, and quantified by photodensitometry using a National Institute of Health Image Analyzer Program. Under some conditions (as indicated in the legend of Fig. 6) to enhance the sensitivity, membranes were developed with West Dura ECL Reagent (Pierce). Membranes that had been exposed to P-Akt (Ser473) antibody were stripped and reanalyzed with an antibody to Akt-1/2 (Santa Cruz Biotechnology); blots developed with P-IRS-1 antibody were stripped and analyzed with anti-IRS-1 antibody (1:1,000, rabbit; Upstate Biotechnology), whereas blots developed with anti-P-p70 S6 kinase-β or with anti-phospho S6 ribosomal protein antibody were stripped and analyzed with mouse p70 S6 kinase β-antibody (1:200; Santa Cruz) or with rabbit anti-S6 ribosomal protein antibody (1:1,000; Cell Signaling), respectively. Finally, most gels were stripped and analyzed with rabbit β-tubulin antibody (1:200; Santa Cruz) to document equal loading of the gel.
Materials
Tissue culture supplies were obtained from Invitrogen. Unless otherwise indicated in the text, all other reagents were purchased from Sigma.
Statistics
Statistical analyses were performed by the unpaired Student’s t-test. Results are presented as means ± SE. A value of P < 0.05 was considered significant.
RESULTS
Phosphoinositide Analysis
Because our previous results indicated that, in the high-glucose/insulin model of insulin resistance insulin-induced activation of IRS-1-bound PI 3-kinase was unimpaired (20), while insulin-induced activation of Akt was markedly diminished (22), the first question we addressed was whether insulin stimulated the production of PtdIns(3,4,5)P3 equally in control and insulin-resistant cells. Figure 1 summarizes the results of four separate experiments. Cells preincubated in 5 mM glucose were compared with cells preincubated in 25 mM glucose + 0.6 nM insulin in the basal state and following 5 min stimulation with 100 nM insulin. Figure 1A illustrates a representative HPLC run, using an extract of cells that were preincubated in 5 mM glucose and then stimulated with 100 nM insulin. The location of the standards are indicated, as well as that of gI(4,5)P2 against which the radioactivity associated with the small gI(3,4,5)P3 peak was normalized. We were unable to localize glycerophosphoinositide 3,4-bisphosphate, which had a signal too small for detection, even after acute insulin stimulation. This confirms previous observations that found that the yield of PtdIns(3,4)P2 from 3T3-L1 adipocytes as well as their response to acute insulin stimulation was very small (6). Figure 1B illustrates a representative analysis comparing the normalized gI(3,4,5)P3 response from control and insulin-resistant cells to acute insulin stimulation. The graphs show only the fractions collected after fraction 150, i.e., starting 50 min after the start of the HPLC run. Finally, data from four experiments are quantified in Fig. 1C. The counts per minute in the gI(3,4,5)P3 peaks (after background subtraction) were normalized to the corresponding gI(4,5)P2 peaks, the areas under the curves were graphed (Fig. 1B), analyzed by NIH Image Analyzer, and expressed in arbitrary units. There was no apparent difference in PtdIns(3,4,5)P3 generation between the two groups in the basal state. However, after acute insulin stimulation, the insulin-resistant group generated 21% less PtdIns(3,4,5)P3 than the controls (P < 0.02). If this is expressed as insulin-stimulated generation above basal (Δinsulin), the decrement in the insulin-resistant cells was 33.6% (P < 0.03).
Fig. 1.

Analysis of phosphatidylinositol 3,4,5-trisphosphate [PtdIns(3,4,5)P3] in 3T3-L1 adipocytes. A: representative HPLC run of deacylated extracts prepared from cells that were labeled with [32P]orthophosphate, preincubated in 5 mM glucose, and then stimulated for 5 min with 100 nM insulin. The location of glyceroinositide phosphates are indicated, i.e., that of glycerophosphoinositide 4,5-bisphosphate [gI(4,5)P2], which was used to normalize the data in each run, and that of glycerophosphoinositide 3,4,5-trisphosphate [gI(3,4,5)P3].The location of ATP, ADP, and AMP, used for standardization of the data, is also indicated. B: normalized data from a representative experiment. Deacylated extracts were prepared from labeled cells that had been preincubated in 5 mM glucose (top) or in 25 mM glucose + 0.6 nM insulin (bottom) and then either analyzed in the basal state (left) or after acute stimulation for 5 min with 100 nM insulin (right). The gI(3.4.5)P3 peak elutes in fractions 170 -175 (indicated by arrow); after background subtraction, it was normalized to the radioactivity in the gI(4,5)P2 peak. C: analysis from 4 experiments. The normalized data were graphed, as in B, analyzed by NIH Image Analyzer, and expressed in arbitrary units. *P < 0.02 compared with cells acutely stimulated with insulin but preincubated in 5 mM glucose.
Translocation of PH Domain-Containing Peptides to the PM Following Acute Insulin Stimulation
We questioned whether the marked difference in Akt activation between control and insulin-resistant cells could be caused by the relatively modest decrease in the generation of PtdIns(3,4,5)P3 observed in response to acute insulin stimulation. We therefore used a second method to assess differences in PtdIns(3,4,5)P3 production between control and insulin-resistant cells. The translocation of PH domain-containing peptides such as GRP-1 and Akt to the PM in response to insulin stimulation is considered a sensitive, and selective probe to assess the generation of PtdIns(3,4,5)P3 in cells in vivo (10). We therefore expressed GFP fusion proteins of the PH domain of GRP-1 or Akt in 3T3-L1 adipocytes by electroporation, allowed the cells to recover for ∼24 h, and then submitted the cells to 18 h preincubation in 5 mM glucose or in 25 mM glucose + 0.6 nM insulin. After 2 h in media devoid of FBS and insulin, cells were stimulated (or not) with 100 nM insulin for 5 min, fixed, and examined by confocal microscopy. Because it was reasonable to assume that there would be variability in the proportion of cells that respond to a maximal stimulating dose of insulin with translocation of the PH domain, as well as variability in the degree of the response of individual cells, i.e., the percentage of the PH domain that remained intracellular vs. that appearing at the cell membrane, we devised a semiquantitative method to assess these parameters. Figure 2A shows some cells from a representative experiment, as well as the assigned numerical score for each cell. The scores (scale of 1-10) were assigned by 2 “blinded” observers whose mean scores were within 90% agreement, and the numbers were averaged. The quantitation of the experiments for the translocation of the PH domains of GRP-1 and Akt are illustrated in Fig. 2, B and C, respectively. Figure 2B represents means of six experiments, each using duplicate samples. Because at least 10 cells were analyzed from each dish, each bar represents the analysis of at least 120 cells by two observers. Figure 2C represents the mean of four experiments, i.e., the analysis of at least 80 cells for each mean. Acute insulin stimulation caused a marked increase in the translocation of both PH domains to the plasma membrane. In Fig. 2C, we tested two concentrations of insulin, the maximally stimulating one (100 nM) and a half-maximally stimulating dose (0.6 nM), and observed a graded translocation response. However, we were unable to find a difference in either the basal or the insulin-stimulated translocation response between control cells (preincubated in 5 mM glucose) or the cells with insulin-resistant glucose transport, which had been pretreated with 25 mM glucose and 0.6 nM insulin. Discrepancies between the results obtained with the two methods of analyzing the response of intracellular PtdIns(3,4,5)P3 to hormonal stimulation have been reported previously (33). Our results suggest that the intracellular PtdIns(3,4,5)P3 pool may not be homogeneous, that possibly only a fraction of the pool is on the inner leaflet of the PM in a location where the translocation of PH domain peptides to the PM can be observed, and that the decreased concentration of PtdIns(3,4,5)P3 we found in insulin-resistant cells may pertain to another cellular domain. Alternatively, the degree of PH domain translocation may not be directly proportional to the PtdIns(3,4,5)P3 concentration, and a decrement of ∼20% may be too small for detection.
Fig. 2.

Translocation of green fluorescent protein (GFP)-labeled pleckstrin homology (PH) domains of general receptor for phosphoinositide-1 (GRP1) and protein kinase B (Akt) to the plasma membrane (PM) in response to acute stimulation with insulin. A: representative experiment. Fully differentiated 3T3-L1 adipocytes were electroporated with pPH-GRP1GFP as described in research design and methods. Later (∼24 h), they were preincubated in media containing 1% FBS with 5 or 25 mM glucose, with or without 0.6 nM insulin, for 18 h. They were then deprived of insulin and FBS for 2 h and either fixed in the basal state with 4% paraformaldehyde or stimulated with 100 nM insulin for 5 min for later analysis by confocal microscopy. At least 10 fields were analyzed from each dish, and each condition was tested in duplicate. Translocation was assessed by two “blinded” observers; the average scores assigned for each cell are shown. B: mean scores ± SE from 6 separate experiments in which the translocation of PH-GRP1GFP was tested. The conditions of preincubation are indicated below the bars; acute insulin stimulation (basal vs. 100 nM insulin) are indicated by the colors of the bars. C: mean scores ± SE from 4 experiments in which the translocation of PH-AktGFP was tested in response to acute stimulation with 0.6 or 100 nM insulin. The conditions of preincubation are indicated below the bars.
Increased PTEN Protein Expression in Insulin-Resistant Cells
PTEN is a lipid phosphatase that specifically dephosphorylates the 3 position of the inositol ring of PtdIns(3,4,5)P3, thus inactivating downstream signaling (17, 19). It is ubiquitously expressed in cells, and its loss appears to be involved in tumor genesis (16). Clearly, increased expression of PTEN could account for the decreased concentration of PtdIns(3,4,5)P3 we observed in the insulin-resistant cells as well as for the impaired activation of Akt. Figure 3 illustrates the effect of preincubation under different conditions on PTEN protein expression. Preincubation in 25 mM glucose in the presence of 0.6 nM insulin increased PTEN protein expression by 49% vs. control in 5 mM glucose (P < 0.001). It was also increased compared with preincubation in 5 mM glucose + 0.6 nM insulin (P < 0.03). The latter caused a small (22%) but significant (P < 0.02) stimulation of PTEN expression vs. controls preincubated in 5 mM glucose. Acute stimulation with a maximal (100 nM) insulin dose for 15 min had no effect on PTEN protein expression, irrespective of the preincubation conditions (data not shown). For each preincubation condition, alternate dishes were treated with rapamycin (100 nM) during the last 30 min of the 2-h period when cells were deprived of FBS and of insulin. Rapamycin completely abolished the increased PTEN protein expression in cells that had been preincubated in-high glucose + insulin (P < 0.001) as well as the smaller effect in cells pretreated with insulin in 5 mM glucose. Rapamycin affected PTEN expression only in cells where it was increased, suggesting that mTORC1 activation was required for increased PTEN expression.
Fig. 3.
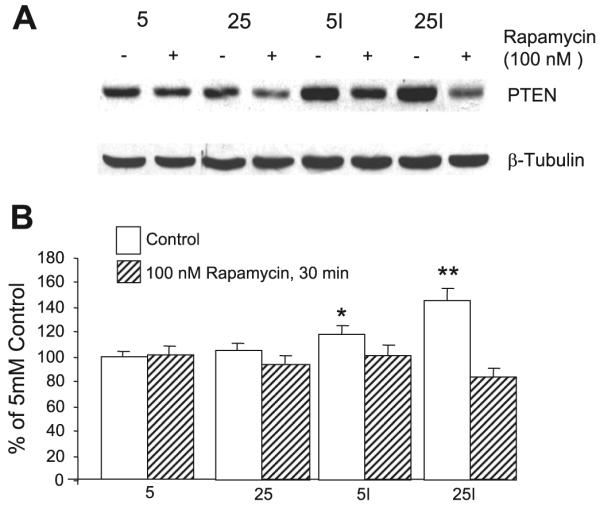
Increased phosphatase and tensin homolog deleted on chromosome 10 (PTEN) protein expression by insulin-resistant cells. 3T3-L1 adipocytes were preincubated for 18 h in 5 or 25 mM glucose, ±0.6 nM insulin, and then deprived of insulin and FBS for 2 h before lysing the cells for preparation of Western blots. Acute stimulation with insulin (100 nM) before lysis had no effect (data not shown). Alternate samples were incubated with 100 nM rapamycin for 30 min before cells were lysed. A: representative Western blot of cells incubated in 5 or 25 mM glucose. I indicates presence of 0.6 nM insulin during preincubation. The addition of rapamycin is indicated. A Western blot of β-tubulin is shown as a control for equal gel loading. B: quantitative analysis (means ± SE) from 3 separate experiments; n = 11/group. I indicates the addition of 0.6 nM insulin during preincubation. Significantly increased vs. control (5 mM glucose), P < 0.02 (*) and P < 0.001 (**).
A Role for Mitochondrial Superoxide Production?
In recent years, evidence has accumulated that many of the deleterious effects of chronic exposure to high glucose may be attributable to enhanced mitochondrial superoxide production. Brownlee and collaborators showed in endothelial cells that several apparently independent biochemical pathways that are thought to contribute to the vascular complications of diabetes can be normalized by overexpression of genes that prevent the high-glucose-induced mitochondrial overproduction of superoxide, i.e., UCP-1, which uncouples mitochondrial oxidative phosphorylation and MnSOD, the mitochondrial isoform of superoxide dismutase (3, 23). It therefore seemed logical to ask the question whether or not the insulin resistance caused by pretreating cells with high glucose and insulin could be prevented by this approach. Figure 4A shows that this is not the case. Although both basal and insulin-stimulated glucose transport increased significantly in cells overexpressing both genes, UCP being more effective in the basal state than MnSOD, the difference in the insulin response between controls and insulin-resistant cells persisted, with the latter transporting 60% less 2-deoxyglucose than the controls upon acute insulin stimulation. Overexpression of both genes was verified by Western blotting (Fig. 4D). Furthermore the impaired insulin response of Akt activation, which characterizes the insulin-resistant cells, also failed to improve in cells overexpressing either gene (Fig. 4, B and C).
Fig. 4.

Overexpression of uncoupling protein (UCP)-1 or manganese superoxide dismutase (MnSOD) does not prevent the development of high-glucose/insulin-mediated insulin resistance. A: 3T3-L1 adipocytes were infected with adenovirus expressing UCP-1 or MnSOD or with empty vector as described in research design and methods. Controls not treated with adenovirus (NA) were also assayed. After infection (5 days), cells were preincubated for 18 h in 5 mM glucose (open bars) or in 25 mM glucose with 0.6 nM insulin (filled bars) and then deprived of serum and insulin for 2 h before acute stimulation for 15 min with 100 nM insulin followed by measurement of glucose transport [assessed as the uptake of 2-deoxyglucose (2-DOG) over 3 min]. Cells that were not stimulated with insulin acutely are indicated as “Basal”. Overexpression of UCP-1 stimulated glucose transport in the basal state (*P < 0.05-P < 0.01), and both the overexpression of UCP-1 and MnSOD enhanced stimulation of glucose transport by insulin in cells that were preincubated in 5 mM glucose (*P < 0.01). However, neither UCP-1 nor MnSOD prevented the marked impairment in insulin-stimulated glucose transport in cells that had been preincubated in high glucose + insulin (filled bars); n = 4 for basal and 8 for “Acute Insulin” from 4 independent experiments. B: Western blots of cells expressing UCP-1 or MnSOD or no adenovirus (NA), incubated for 18 h with 5 mM glucose (5) or 25 mM glucose + 0.6 nM insulin (25I), and then stimulated acutely with 100 nM insulin. The blots are developed with an antibody against phosphorylated Akt (p-Ser). C: quantitative analysis of data in B; n = 4 from 2 experiments. D: Western blots of cell lysates obtained under conditions as in B but in the basal state and developed with antibodies against UCP-1 and MnSOD.
A Role for mTOR
The protein kinase mTOR is a member of the PI 3-kinase family and is a key regulator of cell growth and proliferation. The mTOR pathway integrates signals from nutrient availability, energy status, and growth factors. Insulin is a potent stimulator of mTOR; however, prolonged or excessive stimulation by insulin results in downregulation of insulin signaling that is mediated by mTORC1 and can be reversed by treatment with rapamycin (12, 31, 32, 36, 38). Because rapamycin abolished the increased PTEN expression in insulin-resistant cells, we asked the question whether mTORC1 played a role in the high-glucose/insulin-mediated insulin resistance of glucose transport in our model. The data in Fig. 5 shows that this is the case. 3T3-L1 adipocytes were preincubated under different conditions as described in research design and methods and then stimulated or not with 100 nM insulin for 15 min. Rapamycin (100 nM) was included during the last 90 min of the experiment, which included the time of insulin stimulation and glucose transport measurement (Fig. 5A). Cells that had been preincubated in high glucose + 0.6 nM insulin showed a significant diminution of basal and acutely insulin-stimulated glucose transport, and this downregulation was significantly improved by rapamycin (P < 0.02). Of note is that the rapamycin effect appeared to be relatively selective for the insulin-resistant state, since addition of the inhibitor to cells that were preincubated in high or low glucose without insulin had no effect. Brief time course and dose-response experiments showed that 100 or 200 nM rapamycin were about equally effective and that the effect of rapamycin in partially reversing insulin-resistant glucose transport was already present after 30 min exposure and was essentially unchanged after treatment for 45, 60, 75, and 90 min. However, after rapamycin treatment for 150 min or for 18 h, the effect had markedly diminished (data not shown). To exclude the possibility that rapamycin may interfere with the acute insulin stimulus or glucose transport per se, we ran a second study (Fig. 5B) where rapamycin (100 nM) was included in the medium for 30 min during the last portion of the 2-h period where cells were deprived of FBS and of insulin but was not included during the subsequent 30 min of incubation in KRBH medium, which included acute insulin stimulation and glucose transport measurement. Rapamycin again significantly increased the response of glucose transport to acute insulin stimulation by ∼30%, (P < 0.001) but only in the insulin resistant cells, which had been preincubated in media containing high glucose and 0.6 nM insulin. The small (∼10%) increase in insulin-stimulated glucose transport in response to rapamycin observed in cells preincubated in 5 mM glucose + insulin was not statistically significant. In the experiments shown in Fig. 5B, we also assessed the effect of rapamycin treatment on the insulin-stimulated activation of Akt (Fig. 5C). In the cells that had been preincubated with high glucose and 0.6 nM insulin, the acute insulin response of Akt, as assessed by its phosphorylation on Ser473, was reduced by ∼40%. The smaller (∼20%) reduction in Ser phosphorylation observed in cells preincubated in 5 mM glucose + insulin did not reach statistical significance. Although rapamycin treatment tended to increase the insulin response of Akt phosphorylation in several treatment groups, only its effect on restoring the insulin response of Akt in the group preincubated in high glucose + insulin reached statistical significance (P < 0.005).
Fig. 5.

Mammalian target of rapamycin (mTOR) plays a role in the development of high-glucose and/or insulin-mediated insulin resistance. Cells were preincubated under different conditions as in Figs. 2 and 3 and then withdrawn from insulin and FBS for 2 h before acute stimulation for 15 min (or not, basal) with 100 nM insulin, followed by a 3-min glucose transport assay (A and B). The conditions of preincubation are indicated below the bars. A: alternate dishes were supplemented with 100 nM rapamycin for 90 min at the end of the experiment, which included the period of insulin stimulation and the glucose transport assay. B: 100 nM rapamycin was included for the last 30 min of the 2-h period of withdrawal of FBS and low-dose insulin but was not present during the acute insulin stimulation and the glucose transport assay. In A and B, the marked impairment of the insulin response of glucose transport is evident in cells that had been preincubated in 25 mM glucose + 0.6 nM insulin, and this downregulation is partially prevented by rapamycin. *P < 0.02 in A and P < 0.001 in B. Cells from B were also immunoblotted with the P-Akt antibody (Ser473); C is a representative blot, and D shows the quantitative analysis. A blot for β-tubulin is included in C as a loading control. Rapamycin prevented the downregulation of the Akt activation response to acute insulin in cells preincubated in 25 mM glucose + 0.6 nM insulin (*P < 0.005; D); n = 4 from 2 experiments in A and n = 8 from 4 experiments in B and D.
Excessive stimulation of mTORC1 is known to promote Ser/Thr phosphorylation of IRS-1 at various sites, the most prominent one being Ser636/639 in human IRS-1, which corresponds to Ser632/635 in rat or mouse (35, 36, 38). The mechanism has not been totally clarified; it is thought to involve the kinase activities of mTORC1 and of its substrate S6 kinase (S6K) 1 and to be rapamycin reversible. We therefore tested the Ser phosphorylation of IRS-1 with an antibody specific to human (h) hSer636/639 after incubation in different media as in Fig. 3, followed by acute stimulation with insulin for 15 min after 2 h deprivation of FBS and of insulin (Fig. 6). Acute insulin markedly stimulated the Ser phosphorylation of IRS-1 at this site within 15 min, irrespective of the preincubation conditions (Fig. 6F), and this was markedly inhibited by rapamycin. On closer inspection, we made the surprising observation that the cells that had been chronically exposed to low-dose insulin, in the presence of 5 or 25 mM glucose, showed a marked (∼50-60%) reduction in P-IRS-1(Ser636/639) upon acute stimulation with insulin compared with the cells that had been preincubated without insulin (P < 0.001-0.005; Fig. 6, A, D, and F). The response under basal conditions was qualitatively similar, but more difficult to quantitate, because it was one to two orders of magnitude weaker than that seen after acute stimulation with insulin (Fig. 6, A, D, and F). We then examined the expression of IRS-1 in the different treatment groups. Figure 6, B and E, shows minimal decrements (∼15%) in total IRS-1 expression in cells that had been preincubated in low-dose insulin before acute insulin stimulation. Cells without acute insulin stimulation present a similar picture. None of the changes in total IRS-1 expression are statistically significant. The data are consistent with rapid, selective degradation of the phosphorylated species (which has to be a small proportion of total IRS-1) in cells that have been preexposed to low-dose insulin and/or induction or activation of Ser/Thr phosphatase(s).
Fig. 6.

Effect of acute insulin stimulation on the phosphorylation of Ser636/639 of insulin receptor substrate (IRS)-1 is modified by the conditions of chronic preincubation and by rapamycin. Cells were processed as in Figs. 3 and 5 and then lysed and analyzed by Western blotting. A: representative Western blot prepared from cells that had been lysed in the basal state (left) or after 15 min of acute stimulation with 100 nM insulin (right) before lysis and immunoblotting with an antibody specific to P-IRS-1 hSer636/639. The conditions of preincubation were 5 mM glucose (5), 25 mM glucose (25), 5 mM glucose + 0.6 nM insulin (5I), and 25 mM glucose + 0.6 nM insulin (25I). Cells that were not stimulated acutely with insulin (basal) showed no evidence of phosphorylation when developed under the same conditions as the cells that had been acutely stimulated with insulin, as shown in F. The Western blot shown in A prepared from cells in the basal state was developed using WestDura ECL Reagent (Pierce) to increase sensitivity instead of the West Pico ECL reagent used routinely. B: identical to A except that the gel was stripped and developed with an antibody to total IRS-1. C: blots with β-tubulin antibody as a loading control. D and E: quantitative analyses of A and B, respectively. *P < 0.001 and **P < 0.005, all compared with control preincubated in 5 mM glucose; n = 4 for cells in the basal condition and n = 7 for cells after acute stimulation with insulin. F: cells that were preincubated in 5 mM glucose or in 25 mM glucose + 0.6 nM insulin and then either left in the basal state (B), or acutely stimulated with 100 nM insulin (I) for 15 min. Half of the dishes were exposed to 100 nM rapamycin for 30 min. Neither insulin nor rapamycin affected the total expression of IRS-1. Acute insulin without rapamycin slightly retarded the migration of IRS-1, and this was abolished by rapamycin. Acute insulin stimulated the phosphorylation of IRS-1 on Ser636/639, and this was diminished in cells that were preincubated in 25 mM glucose + low-dose insulin. Rapamycin markedly inhibited the phosphorylation of IRS-1. The gel is representative of 4 similar gels, from two separate experiments.
Figure 7 shows the phosphorylation of S6K and of S6 ribosomal protein, known substrates of mTORC1, in response to acute insulin stimulation after preincubation with 5 mM glucose or with 25 mM glucose + 0.6 nM insulin. The experiments were carried out exactly as in Figs. 5 and 6, i.e., acute insulin stimulation for 15 min was preceded by a 2-h period of withdrawal of FBS and of insulin. Although acute insulin stimulation markedly stimulated the phosphorylation of S6K and of S6 ribosomal protein, in contrast to our observation with the phosphorylation of IRS-1 on Ser636/639, there was no difference between cells that had been preincubated in 5 mM glucose or in high glucose + low-dose insulin. Similarly, there was no difference in the total expression of either mTORC1 substrate (data not shown).
Fig. 7.

Acute insulin treatment activates S6 kinase and S6 ribosomal protein equally, regardless of preincubation conditions, in cells deprived for 2 h of FBS and low-dose insulin. Cells were treated as described in Fig. 6. The gel shown in A compares cells preincubated in 5 mM glucose with cells preincubated in 25 mM glucose + 0.6 nM insulin. After a 2-h withdrawal of FBS and low-dose insulin, cells were stimulated for 15 min with 100 nM insulin (I) or assayed in the basal state (B). Cells were lysed and immunoblotted for phosphorylated S6 kinase and for phosphorylated S6 ribosomal protein. β-Tubulin is shown as a loading control. B: quantitative analysis of cells harvested after 15 min acute insulin stimulation; n = 13 from 4 separate experiments. Glc, glucose.
A possible explanation for the lack of difference between the effect of the preincubation conditions on the phosphorylation of two major substrates of mTORC1 would be that the effect had been transient and had been reversed by the action of a phosphoprotein phosphatase during the 2 h of withdrawal of FBS and of low-dose chronic insulin infusion. We therefore repeated the experiment but eliminated the period of FBS and insulin withdrawal and tested the cells before and after a 15 min acute stimulation with 100 nM insulin (Fig. 8). As expected, before acute stimulation with insulin, the phosphorylation of S6K and of S6 ribosomal protein was significantly enhanced in cells that had been preincubated in high glucose + 0.6 nM insulin compared with preincubation in 5 mM glucose (P < 0.04). No other comparisons reached statistical significance. Acute stimulation with 100 nM insulin markedly increased the phosphorylation of both substrates in all groups. However, as previously observed with the phosphorylation of IRS-1 on hSer636/639, cells that had been preincubated with low-dose insulin, in the presence of 5 or 25 mM glucose, showed significantly less activation of either mTORC1 substrate compared with cells preincubated without insulin. Treatment with rapamycin (100 nM, 30 min) completely abolished the insulin-mediated activation of S6K and of S6 ribosomal protein. The total expression of either mTORC1 substrate was not affected by any of the treatments.
Fig. 8.


Preincubation conditions modify S6 kinase and S6 ribosomal protein phosphorylation when cells are tested at the end of preincubation, omitting the 2-h deprivation of FBS and of low-dose insulin. Experiments were carried out exactly as described for Fig. 7, except that the 15-min acute stimulation with 100 nM insulin was administered at the end of the preincubation period (I), and the nonstimulated cells (B) were lysed at the same time, i.e., the 2-h deprivation of FBS and of low-dose insulin was omitted. A and B: representative gel where cells preincubated in 5 mM glucose or in 25 mM glucose + 0.6 nM insulin are analyzed after (I) or without (B) acute stimulation with 100 nM insulin. A was blotted with an antibody to phosphorylated S6 kinase and B with an antibody to phosphorylated S6 ribosomal protein. C: blot for β-tubulin. D-G: representative gels and quantitative analyses of cells preincubated in 5 or 25 mM glucose with or without 0.6 nM insulin, as well as 5 mM glucose and 25 mM glucose + 0.6 nM insulin treated with 100 nM rapamycin for 30 min, analyzed in the basal condition (D and F) and after 15 min stimulation with 100 nM insulin (E and G). Left: blots are analyzed after developing with an antibody against phosphorylated S6 kinase (D and E) or against phosphorylated S6 ribosomal protein (F and G). Right: blots stripped and analyzed with antibodies against total S6 kinase (D and E) or against total S6 ribosomal protein (F and G); n = 7 for cells analyzed without acute insulin stimulation and 11 for cells after stimulation with 100 nM insulin. In A and B: cells with and without acute insulin treatment were analyzed on the same gel. D-G: cells with and without acute insulin stimulation analyzed on separate gels. *P < 0.04 in D and F; P < 0.03 in E, and P < 0.005 and **P < 0.02 in G, all compared with control, preincubated in 5 mM glucose.
DISCUSSION
This study revealed several interesting findings relevant to the mechanism of glucose- and/or insulin-induced insulin resistance. Because our previous data indicated that the proximal effects of insulin, including IRS-1 activation of PI 3-kinase, were not affected, it was of interest that the acute stimulation by insulin of PI(3.4.5)P3 production was diminished by ∼30%. This could represent decreased production or enhanced degradation, e.g., by a lipid phosphatase. In support of the latter hypothesis, we found that the expression of PTEN protein was increased in cells following chronic pretreatment with low-dose insulin and that the insulin effect was significantly enhanced by the presence of high glucose vs. low glucose. Furthermore, the effect on PTEN expression was abolished by rapamycin, suggesting that mTORC1 activity was required for the effect, and may be mediating it. Because the regulation of PTEN expression by chronic exposure to insulin and glucose is a novel finding, it opens a number of questions. Is the effect transcriptional, or does it reflect PTEN protein stabilization? Because PTEN activity is regulated not only by protein abundance but also by the phosphorylation status of the protein (16), how does chronic exposure to insulin and glucose affect PTEN activity? The mechanisms involved are currently being investigated in our laboratory. To our knowledge, this is the first demonstration of a link between PTEN protein expression and insulin resistance under physiological conditions, e.g., in the absence of genetic manipulations (18, 19, 34), as well as the first demonstration of a regulatory role of mTORC1 activity on PTEN expression.
The failure of the indirect method of measuring PI(3,4,5)P3 abundance to confirm the direct measurement suggests that the indirect method may have its limitations, as discussed in RESULTS. Insulin-induced insulin resistance of glucose transport is associated with altered intracellular IRS-1 trafficking, which is rapamycin responsive (35); it may also affect the intracellular distribution of Akt, i.e., that of the Akt PH domain, which is measured in the indirect assay.
Our data also suggest that mTOR activation plays an important role in the development of glucose- and/or insulin-mediated insulin resistance. The chronic effects of high doses of insulin have been well documented in 3T3-L1 adipocytes (12, 41) and clearly involve mTOR activation, resulting in phosphorylation of IRS-1 and subsequent proteasomal degradation. Such results were obtained with high doses of insulin (20 nM) after exposure of 1 h or longer. In contrast, in the experiments reported here, cells were exposed to 0.6 nM insulin for 18 h, which results in even lower insulin concentrations (∼0.2 nM) at the time of the experiments (11). Nevertheless, prolonged exposure to these near-physiological concentrations of insulin also resulted in mTOR activation, but with the major end points of impaired activation of Akt and glucose transport by insulin, with small or no effects on IRS-1 degradation. Marette’s (35) laboratory, who studied the effect of acute stimulation with high doses of insulin on the rapamycin-responsive downregulation of the insulin response, also failed to observe an effect on IRS-1 degradation.
Whereas activation of mTOR in response to acute insulin occurs within 5 min, the downregulation of the insulin response takes longer and was detected at the earliest after 15 min of stimulation with insulin (35). However, this is within the time frame of our insulin stimulation experiments and raises the question why we did not observe a rapamycin response in all experiments after acute insulin stimulation, regardless of the preincubaton conditions. Although we stimulated with insulin for 15 min, the time elapsed between insulin stimulation and measurement of glucose transport was longer in Ref. 35 than in our experiments, because glucose transport was measured for 8 min vs. 3 min by us, and there was a buffer change included before measuring glucose transport in Ref. 35. An alternative cause for the discrepancy may be that, in our experiments, the cells were exposed for 30 min to KRBH buffer devoid of glucose and amino acids at the end of the experiment, which included the time of insulin stimulation and measurement of glucose transport. This may have had a restraining effect on the mTOR stimulation by acute insulin but allowed us to clearly observe the potentiating effects of chronic preincubation with low-dose insulin in the presence of high glucose. Note that phosphorylation of IRS-1 on Ser636/639 was detected following acute insulin stimulation as in Ref. 35. Assuming that the major effects observed, i.e., impaired insulin stimulation of glucose transport and Akt activation, indeed represented mTOR-mediated effects distal to PI 3-kinase activation, this may have been mediated by increased expression of PTEN, and possibly by activation or induction of a protein phosphatase that dephosphorylates Akt (2, 8, 37). It takes at least 6 h to develop maximal insulin resistance in the model described here (unpublished results), suggesting the involvement of transcriptional regulation. Similar conclusions have been reached in isolated muscles (14).
The downregulation of IRS-1 phosphorylation on Ser636/639 in cells that had been chronically exposed to low-dose insulin was an unexpected finding, particularly because total IRS-1 expression was not significantly altered, although it was mildly decreased. Thus, assuming that IRS-1 phosphorylation at this site was mTORC1 mediated (it was abolished by rapamycin), one would expect that conditions that cause insulin resistance would either increase Ser636/639 phosphorylation or significantly accelerate IRS-1 degradation. Neither of these was observed. A possible interpretation of our findings is that chronic exposure to low-dose insulin induced or activated a phosphoprotein phosphatase(s) that decreased the mTORC1-mediated increased phosphorylation of IRS-1 on Ser636/639. The same phosphatase(s) could also accelerate the dephosphorylation of Akt, which would promote insulin resistance. Because rapamycin blocked the latter event (Fig. 5, C and D), one may postulate that the chronic insulin-mediated enhancement of phosphoprotein phosphatase activity was also mediated by mTORC1. Clearly, these speculations need experimental validation.
To verify that mTORC1 was indeed activated in our model of insulin resistance, we analyzed the activation of a known direct substrate of the complex, p70 S6K, and that of the latter’s direct substrate, S6 ribosomal protein. As expected, acute stimulation with insulin markedly enhanced the phosphorylation (activation) of both substrates. However, there was no detectable difference between cells that were submitted to the various incubation conditions (Fig. 7). A possible explanation for the lack of difference between groups was that the effect may have worn off during the 2-h period of cell withdrawal from FBS and from insulin, which was part of the design of the glucose transport experiments. Note that the impaired glucose transport, Akt activation, and enhanced PTEN expression were maintained during this period, indicating that different cellular processes normalize at different rates. Figure 8 shows that this is the case, i.e., when the period of withdrawal from insulin and FBS is omitted, we still see marked activation of S6K and S6 ribosomal protein upon acute stimulation with insulin, but now the pattern is identical to that seen with IRS-1 phosphorylation on Ser636/639, i.e., cells that had been preexposed to chronic low-dose insulin showed diminished activation of these substrates upon acute stimulation with 100 nM insulin. It is noteworthy that this downregulation was independent of the glucose concentration during preincubation, whereas downregulation of the other parameters (glucose transport, Akt activation, and PTEN expression) all showed some (Akt and PTEN) or complete (glucose transport) dependence on the presence of high glucose during preincubation. Although the mechanism of the glucose effect is unknown, it seems to act downstream or parallel to mTORC1.
Note that rapamycin only partially restored the impaired insulin response of glucose transport in cells pretreated with insulin in high glucose, suggesting that mTOR is only one of the factors that mediate the insulin resistance. On the other hand, we were unable to treat the cells with rapamycin during the entire time of their preexposure to insulin because rapamycin gradually lost its effectiveness after 2 h. Rapamycin is one of the kinase inhibitors with the highest selectivity and specificity (5). When bound to FK506-binding protein-12, rapamycin interacts with and inhibits the activity of the multiprotein complex composed of mTOR, Gβ-like protein (GβL), and raptor (mTORC1), which represents the classical effect we studied. However, with time, and dependent on the cell type, rapamycin interferes with the assembly of mTORC2, consisting of mTOR, GβL, and rictor. mTORC2 is a critical agent in Akt activation; it is the kinase that phosphorylates it on Ser473. Thus prolonged exposure to rapamycin can impair Akt activation by an alternative mechanism (30).
A model of insulin-resistant glucose transport, similar to that described here, has been studied in 3T3-L1 adipocytes following preincubation for 12 h with low-dose insulin (5 nM) (4). The results differ from ours in that the development of insulin-resistant glucose transport was independent of the glucose concentration during preincubation, and Akt activation by insulin was unimpaired. It was accompanied by a marked loss of cortical filamentous F-actin and a loss of phosphatidylinositol bisphosphate (PIP2) from the cell membrane. Using a PIP2 delivery system, the authors observed restoration of PIP2, cortical F-actin, and insulin responsiveness (4). The reason for the discrepancies between the two models are not clear; they may represent clonal differences between 3T3-L1 fibroblasts. Nevertheless, it demonstrates that chronic exposure to low-dose insulin can cause insulin resistance by different mechanisms. TORC2 is known to control the actin cytoskeleton (13, 28), and there is recent evidence that TORC1 may also be involved (1). It will be of great interest to establish whether the actin cytoskeleton is regulated in our model of insulin resistance and whether the mTOR kinases are involved.
In conclusion, our data indicate that high-glucose/low-dose insulin-mediated insulin resistance of glucose transport and Akt activation in 3T3-L1 adipocytes reflects in part decreased availability of PI(3,4,5)P3 which correlates with the increased expression of PTEN. The latter appears to be mediated by mTORC1. In addition, chronic activation of mTORC1 may play a role by inducing or activating phosphoprotein phosphatase(s), which may impair Akt activation. Our data do not support a role for increased mitochondrial superoxide production as a causative factor in this model.
ACKNOWLEDGMENTS
We gratefully acknowledge the expert technical assistance of Mary Berkaw in some experiments and the valuable advice of Dr. Jeffrey Pessin and his associates in developing electroporation procedures. We thank the Medical University of South Carolina Hollings Cancer Center Molecular Imaging Core Facility for the use of the confocal microscope and Dr. Margaret Kelly for patient guidance. We thank Dr. Mark Lemmon, Dr. Dario Alessi, and Dr. Michael Brownlee for generous gifts of different plasmids and adenovirus preparations, Dr. Alex Toker for the gift of recombinant active phosphatidylinositol 3-kinase, and Lilly Research Laboratories for recombinant human insulin.
GRANTS
This work was supported by National Institute of Diabetes and Digestive and Kidney Diseases Grant DK-02001 to M. G. Buse.
REFERENCES
- 1.Aronova S, Wedaman K, Anderson S, Yates J, 3rd, Powers T. Probing the membrane environment of the TOR kinases reveals functional interactions between TORC1, actin, and membrane trafficking in Saccharomyces cerevisiae. Mol Biol Cell. 2007;18:2779–2794. doi: 10.1091/mbc.E07-03-0274. [DOI] [PMC free article] [PubMed] [Google Scholar]
- 2.Brognard J, Sierecki E, Gao T, Newton AC. PHLPP and a second isoform, PHLPP2, differentially attenuate the amplitude of Akt signaling by regulating distinct Akt isoforms. Mol Cell. 2007;25:917–931. doi: 10.1016/j.molcel.2007.02.017. [DOI] [PubMed] [Google Scholar]
- 3.Brownlee M. The pathobiology of diabetic complications: a unifying mechanism. Diabetes. 2005;54:1615–1625. doi: 10.2337/diabetes.54.6.1615. [DOI] [PubMed] [Google Scholar]
- 4.Chen G, Raman P, Bhonagiri P, Strawbridge AB, Pattar GR, Elmendorf JS. Protective effect of phosphatidylinositol 4,5-bisphosphate against cortical filamentous actin loss and insulin resistance induced by sustained exposure of 3T3-L1 adipocytes to insulin. J Biol Chem. 2004;279:39705–39709. doi: 10.1074/jbc.C400171200. [DOI] [PMC free article] [PubMed] [Google Scholar]
- 5.Davies SP, Reddy H, Caivano M, Cohen P. Specificity and mechanism of action of some commonly used protein kinase inhibitors. Biochem J. 2000;351:95–105. doi: 10.1042/0264-6021:3510095. [DOI] [PMC free article] [PubMed] [Google Scholar]
- 6.DeWald DB. Measurements of cellular phosphoinositide levels in 3T3-L1 adipocytes. Methods Mol Med. 2003;83:145–154. doi: 10.1385/1-59259-377-1:145. [DOI] [PubMed] [Google Scholar]
- 7.Du XL, Edelstein D, Dimmeler S, Ju Q, Sui C, Brownlee M. Hyperglycemia inhibits endothelial nitric oxide synthase activity by posttranslational modification at the Akt site. J Clin Invest. 2001;108:1341–1348. doi: 10.1172/JCI11235. [DOI] [PMC free article] [PubMed] [Google Scholar]
- 8.Gao T, Furnari F, Newton AC. PHLPP: a phosphatase that directly dephosphorylates Akt, promotes apoptosis, and suppresses tumor growth. Mol Cell. 2005;18:13–24. doi: 10.1016/j.molcel.2005.03.008. [DOI] [PubMed] [Google Scholar]
- 9.Garvey WT, Olefsky JM, Matthaei S, Marshall S. Glucose and insulin co-regulate the glucose transport system in primary cultured adipocytes. A new mechanism of insulin resistance. J Biol Chem. 1987;262:189–197. [PubMed] [Google Scholar]
- 10.Gray A, Van Der Kaay J, Downes CP. The pleckstrin homology domains of protein kinase B and GRP1 (general receptor for phosphoinositides-1) are sensitive and selective probes for the cellular detection of phosphatidylinositol 3,4-bisphosphate and/or phosphatidylinositol 3,4,5-trisphosphate in vivo. Biochem J. 1999;344:929–936. [PMC free article] [PubMed] [Google Scholar]
- 11.Greene EL, Nelson BA, Robinson KA, Buse MG. alpha-Lipoic acid prevents the development of glucose-induced insulin resistance in 3T3-L1 adipocytes and accelerates the decline in immunoreactive insulin during cell incubation. Metab Clin Exp. 2001;50:1063–1069. doi: 10.1053/meta.2001.25601. [DOI] [PubMed] [Google Scholar]
- 12.Haruta T, Uno T, Kawahara J, Takano A, Egawa K, Sharma PM, Olefsky JM, Kobayashi M. A rapamycin-sensitive pathway down-regulates insulin signaling via phosphorylation and proteasomal degradation of insulin receptor substrate-1. Mol Endocrinol. 2000;14:783–794. doi: 10.1210/mend.14.6.0446. [DOI] [PubMed] [Google Scholar]
- 13.Jacinto E, Loewith R, Schmidt A, Lin S, Ruegg MA, Hall A, Hall MN. Mammalian TOR complex 2 controls the actin cytoskeleton and is rapamycin insensitive. Nat Cell Biol. 2004;6:1122–1128. doi: 10.1038/ncb1183. [DOI] [PubMed] [Google Scholar]
- 14.Kawanaka K, Han DH, Gao J, Nolte LA, Holloszy JO. Development of glucose-induced insulin resistance in muscle requires protein synthesis. J Biol Chem. 2001;276:20101–20107. doi: 10.1074/jbc.M010599200. [DOI] [PubMed] [Google Scholar]
- 15.Klip A, Paquet MR. Glucose transport and glucose transporters in muscle and their metabolic regulation. Diabetes Care. 1990;13:228–243. doi: 10.2337/diacare.13.3.228. [DOI] [PubMed] [Google Scholar]
- 16.Leslie NR, Downes CP. PTEN function: how normal cells control it and tumour cells lose it. Biochem J. 2004;382:1–11. doi: 10.1042/BJ20040825. [DOI] [PMC free article] [PubMed] [Google Scholar]
- 17.Maehama T, Dixon JE. PTEN: a tumour suppressor that functions as a phospholipid phosphatase. Trends Cell Biol. 1999;9:125–128. doi: 10.1016/s0962-8924(99)01519-6. [DOI] [PubMed] [Google Scholar]
- 18.Mosser VA, Li Y, Quon MJ. PTEN does not modulate GLUT4 translocation in rat adipose cells under physiological conditions. Biochem Biophys Res Commun. 2001;288:1011–1017. doi: 10.1006/bbrc.2001.5876. [DOI] [PubMed] [Google Scholar]
- 19.Nakashima N, Sharma PM, Imamura T, Bookstein R, Olefsky JM. The tumor suppressor PTEN negatively regulates insulin signaling in 3T3-L1 adipocytes. J Biol Chem. 2000;275:12889–12895. doi: 10.1074/jbc.275.17.12889. [DOI] [PubMed] [Google Scholar]
- 20.Nelson BA, Robinson KA, Buse MG. High glucose and glucosamine induce insulin resistance via different mechanisms in 3T3-L1 adipocytes. Diabetes. 2000;49:981–991. doi: 10.2337/diabetes.49.6.981. [DOI] [PubMed] [Google Scholar]
- 21.Nelson BA, Robinson KA, Buse MG. Insulin acutely regulates Munc18-c subcellular trafficking: altered response in insulin-resistant 3T3-L1 adipocytes. J Biol Chem. 2002;277:3809–3812. doi: 10.1074/jbc.C100645200. [DOI] [PubMed] [Google Scholar]
- 22.Nelson BA, Robinson KA, Buse MG. Defective Akt activation is associated with glucose- but not glucosamine-induced insulin resistance. Am J Physiol Endocrinol Metab. 2002;282:E497–E506. doi: 10.1152/ajpendo.00438.2001. [DOI] [PubMed] [Google Scholar]
- 23.Nishikawa T, Edelstein D, Du XL, Yamagishi S, Matsumura T, Kaneda Y, Yorek MA, Beebe D, Oates PJ, Hammes HP, Giardino I, Brownlee M. Normalizing mitochondrial superoxide production blocks three pathways of hyperglycaemic damage. Nature. 2000;404:787–790. doi: 10.1038/35008121. [DOI] [PubMed] [Google Scholar]
- 24.Petersen KF, Shulman GI. Etiology of insulin resistance. Am J Med. 2006;119:S10–S16. doi: 10.1016/j.amjmed.2006.01.009. [DOI] [PMC free article] [PubMed] [Google Scholar]
- 25.Robinson KA, Ball LE, Buse MG. Reduction of O-GlcNAc protein modification does not prevent insulin resistance in 3T3-L1 adipocytes. Am J Physiol Endocrinol Metab. 2007;292:E884–E890. doi: 10.1152/ajpendo.00569.2006. [DOI] [PMC free article] [PubMed] [Google Scholar]
- 26.Rossetti L, Giaccari A, DeFronzo RA. Glucose toxicity. Diabetes Care. 1990;13:610–630. doi: 10.2337/diacare.13.6.610. [DOI] [PubMed] [Google Scholar]
- 27.Saltiel AR, Kahn CR. Insulin signalling and the regulation of glucose and lipid metabolism. Nature. 2001;414:799–806. doi: 10.1038/414799a. [DOI] [PubMed] [Google Scholar]
- 28.Sarbassov DD, Ali SM, Kim DH, Guertin DA, Latek RR, Erdjument-Bromage H, Tempst P, Sabatini DM. Rictor, a novel binding partner of mTOR, defines a rapamycin-insensitive and raptor-independent pathway that regulates the cytoskeleton. Curr Biol. 2004;14:1296–1302. doi: 10.1016/j.cub.2004.06.054. [DOI] [PubMed] [Google Scholar]
- 29.Sarbassov DD, Guertin DA, Ali SM, Sabatini DM. Phosphorylation and regulation of Akt/PKB by the rictor-mTOR complex. Science. 2005;307:1098–1101. doi: 10.1126/science.1106148. [DOI] [PubMed] [Google Scholar]
- 30.Sarbassov DD, Ali SM, Sengupta S, Sheen JH, Hsu PP, Bagley AF, Markhard AL, Sabatini DM. Prolonged rapamycin treatment inhibits mTORC2 assembly and Akt/PKB. Mol Cell. 2006;22:159–168. doi: 10.1016/j.molcel.2006.03.029. [DOI] [PubMed] [Google Scholar]
- 31.Sarbassov dos D, Ali SM, Sabatini DM. Growing roles for the mTOR pathway. Curr Opin Cell Biol. 2005;17:596–603. doi: 10.1016/j.ceb.2005.09.009. [DOI] [PubMed] [Google Scholar]
- 32.Shah OJ, Wang Z, Hunter T. Inappropriate activation of the TSC/Rheb/mTOR/S6K cassette induces IRS1/2 depletion, insulin resistance, and cell survival deficiencies. Curr Biol. 2004;14:1650–1656. doi: 10.1016/j.cub.2004.08.026. [DOI] [PubMed] [Google Scholar]
- 33.Stratford S, DeWald DB, Summers SA. Ceramide dissociates 3′-phosphoinositide production from pleckstrin homology domain translocation. Biochem J. 2001;354:359–368. doi: 10.1042/0264-6021:3540359. [DOI] [PMC free article] [PubMed] [Google Scholar]
- 34.Tang X, Powelka AM, Soriano NA, Czech MP, Guilherme A. PTEN, but not SHIP2, suppresses insulin signaling through the phosphatidylinositol 3-kinase/Akt pathway in 3T3-L1 adipocytes. J Biol Chem. 2005;280:22523–22529. doi: 10.1074/jbc.M501949200. [DOI] [PubMed] [Google Scholar]
- 35.Tremblay F, Gagnon A, Veilleux A, Sorisky A, Marette A. Activation of the mammalian target of rapamycin pathway acutely inhibits insulin signaling to Akt and glucose transport in 3T3-L1 and human adipocytes. Endocrinology. 2005;146:1328–1337. doi: 10.1210/en.2004-0777. [DOI] [PubMed] [Google Scholar]
- 36.Tzatsos A, Kandror KV. Nutrients suppress phosphatidylinositol 3-kinase/Akt signaling via raptor-dependent mTOR-mediated insulin receptor substrate 1 phosphorylation. Mol Cell Biol. 2006;26:63–76. doi: 10.1128/MCB.26.1.63-76.2006. [DOI] [PMC free article] [PubMed] [Google Scholar]
- 37.Ugi S, Imamura T, Maegawa H, Egawa K, Yoshizaki T, Shi K, Obata T, Ebina Y, Kashiwagi A, Olefsky JM. Protein phosphatase 2A negatively regulates insulin’s metabolic signaling pathway by inhibiting Akt (protein kinase B) activity in 3T3-L1 adipocytes. Mol Cell Biol. 2004;24:8778–8789. doi: 10.1128/MCB.24.19.8778-8789.2004. [DOI] [PMC free article] [PubMed] [Google Scholar]
- 38.Um SH, Frigerio F, Watanabe M, Picard F, Joaquin M, Sticker M, Fumagalli S, Allegrini PR, Kozma SC, Auwerx J, Thomas G. Absence of S6K1 protects against age- and diet-induced obesity while enhancing insulin sensitivity. Nature. 2004;431:200–205. doi: 10.1038/nature02866. [DOI] [PubMed] [Google Scholar]
- 39.Yao D, Taguchi T, Matsumura T, Pestell R, Edelstein D, Giardino I, Suske G, Ahmed N, Thornalley PJ, Sarthy VP, Hammes HP, Brownlee M. Methylglyoxal modification of mSin3A links glycolysis to angio-poietin-2 transcription. Cell. 2006;124:275–286. doi: 10.1016/j.cell.2005.11.024. [DOI] [PubMed] [Google Scholar]
- 40.Yki-Jarvinen H, Helve E, Koivisto VA. Hyperglycemia decreases glucose uptake in type I diabetes. Diabetes. 1987;36:892–896. doi: 10.2337/diab.36.8.892. [DOI] [PubMed] [Google Scholar]
- 41.Zhande R, Mitchell JJ, Wu J, Sun XJ. Molecular mechanism of insulin-induced degradation of insulin receptor substrate 1. Mol Cell Biol. 2002;22:1016–1026. doi: 10.1128/MCB.22.4.1016-1026.2002. [DOI] [PMC free article] [PubMed] [Google Scholar]