Abstract
This review shows the current analytical quality for the following analytes used as tumour markers in the external quality assessment (EQA)-programmes of Instand e.V., a national EQA-organiser in Germany: Corticotropin (ACTH), growth hormone (GH, hGH), prolactin (PRL), chorionic gonadotropin (CG, hCG), calcitonin (CT, hCT), thyroglobulin (Tg), carcinoembryonic antigen (CEA), CA-Antigens 125, 72-4, 15-3 and 19-9, alpha foetoprotein (AFP) and prostate-specific antigen (PSA).
The results from the participants show a large variation in the precision of the methods used as well as in the comparability of results between methods for the same analyte. In general, the hormones used as tumour markers show better performance than the "CA-markers", which are often inadequately standardised and defined. In the case of one CA-marker (CA 72-4/TAG 72-4), the differences between the lowest kit median concentration and highest kit median concentration for one sample pair were 440% and 580%. The corresponding figures for ACTH were 123% and 156% and for CEA 180% and 184%.
The classical tumour markers such as carcinoembryonic antigen (CEA) and alpha foetoprotein (AFP) performed markedly better than the CA-markers and PSA with regards to both inter- and intra-method comparability.
The inter-laboratory precision for a given kit and marker was acceptable in many cases.
The results show that only results from the same kit/method for each tumour marker can be used for cumulative or time-dependent comparison of results - for example pre-operative and post-operative follow up. In the case of prostate specific antigen (PSA), the kits used for free and total PSA must come from the same producer, if the generally accepted ratios are to have any diagnostic value.
The need for kit- and laboratory-specific reference ranges and cut-off values for setting diagnostic specificity and sensitivity is highlighted from the EQA-results. The situation for inter-method comparability for the CA-Markers has not improved over the past decade.
With the exception of calcitonin for detecting medullary thyroid carcinoma, chorionic gonadotropin in germ-cell tumours in men and thyroglobulin after total thyroidectomy, none of the remaining analytes appear to be suitable for screening purposes.
Keywords: external quality assessment (EQA), tumour markers, precision, accuracy, standardisation, method comparison, diagnostic specificity, diagnostic sensitivity, immunoassay
Abstract
Diese Übersicht stellt die analytische Qualität von einigen Tumormarkern in den Ringversuchen dar. Es handelt sich um die Analyte: Corticotropin (ACTH), Wachstumshormon (GH, hGH), Prolaktin (PRL), Choriongonadotropin (hCG und CG), Calcitonin (CT), Thyreoglobulin (Tg), Carcinoembryonales Antigen (CEA), CA-Antigene 125, 72-4, 15-3 und 19-9, Alpha-Fetoprotein (AFP) und Prostata-spezifisches Antigen (PSA). Die Analysenergebnisse der Ringversuchsteilnehmer weisen eine relativ große Unpräzision und mangelhafte Vergleichbarkeit bei demselben Analyten auf. Lediglich bei den Hormonen, soweit sie als Tumormarker verwendet werden, sind die Analysenergebnisse besser vergleichbar als diejenigen der anderen Protein-Tumormarker, bei denen offenbar eine durchgreifende Standardisierung noch aussteht. Als Beispiel sei genannt der Analyt CA 72-4 (TAG 72-4), bei dem die Unterschiede der Medianwerte der verschiedenen Analyseverfahren zum Teil 440% - 580% betragen. Für ACTH waren die vergleichbaren Zahlen 123% und 156%, für CEA 180% - 184%. Die klassischen Tumormarker wie AFP und CEA erzielten bessere Ergebnisse als die CA-Marker und PSA.
Die Ergebnisse der Studie zeigen, dass für die Langzeitüberwachung von Patienten nur das gleiche Analysesystem bzw. der gleiche Testkit eingesetzt werden darf. Für Prostata-spezifisches Antigen sollten die Reagenzien zur Bestimmung von gesamt- und freiem PSA vom selben Hersteller bezogen werden und auf äquimolarer Basis funktionieren. Jedes Labor sollte seine eigenen Referenzbereiche und cut-off Werte für jeden Tumormarker selbst erstellen oder vom Hersteller angeben lassen. Die Übernahme von cut-off Werten aus Lehrbüchern für alle Analysensysteme ist nicht angezeigt. Bedauerlicherweise hat sich die Vergleichbarkeit zwischen den Reagenziensystemen für die CA-Marker von verschiedenen Herstellern über die letzten Jahre nicht wesentlich verbessert.
Mit Ausnahme von Calcitonin zur Diagnose von medullären Schilddrüsenkarzinomen, Choriongonadotropin für Keimzelltumoren bei Männern und Thyreoglobulin nach totaler Thyreoidektomie ist keiner der aufgeführten Marker für das Tumor-Screening geeignet.
Introduction
The concept of using markers for the monitoring of tumour growth and efficiency of therapeutic intervention is not new. The first attempts at monitoring tumour growth and/or activity were with monoclonal immunoglobulinopathies using electrophoretic techniques and endocrine tumours using hormones as markers. The chemical analysis of hapten hormones such as adrenaline, noradrenaline, serotonin in urine or plasma and their metabolites, homovanillic acid, vanillylmandelic acid and 5-hydroxyindole acetic acid in urine were used as differential markers for suprarenal neoplasia (neuroblastoma, phaeochromocytoma, carcinoid) [1], [2], [3], [4]. Tartrate-inhibited acid phosphatase (ti-AcP) was used as an indicator of benign or malignant prostatic disorders [5].
The introduction of immunoassays allowed the measurement of peptide hormones, at first mainly for pituitary disorders (corticotropin (ACTH), growth hormone (GH, hGH), chorionic gonadotropin (CG, hCG), prolactin (PRL), thyrotropin (TSH)), steroid hormones (cortisol, aldosterone) and thyroid hormones (thyroxine (T4) and triiodothyronine (T3)) [6], [7], [8], [9], [10], [11], [12].
The search for more specific markers for non-endocrine tumours led to the development of carcinoembryonic antigen (CEA), alpha foetoprotein (AFP) and the "CA-immunoassays", originally from Centocor. The latter include CA 19-9 (gastrointestinal tumours), CA 125 (ovarian cancer), CA 15-3 (breast cancer) and CA 72-4 (TAG 72-4, gastric tumours) [13], [14], [15], [16], [17], [18].
The use of prostate-specific antigen (PSA) as a more specific tumour marker became interesting after the discovery that PSA was present in at least three forms in serum (free and complexed with either α1-antichymotrypsin (α1-ACT) and α2-macroglobulin (α2-MG), the latter of which is not detectable by immunoassay, as the PSA is surrounded by the α2-MG and is therefore "invisible" to antibodies). Assays were developed for total, free and complexed PSA [19], [20], [21]. The ratio of "free" PSA to complexed PSA (= PSA-α1-ACT) has been propagated as being able to differentiate between benign (hyperplasia) and malignant (neoplastic) prostatic disease [22], [23].
With the advent of the polymerase chain reaction (PCR) - methods, the accent of diagnosis is shifting toward the use of genetic markers. Examples here are the BRCA-1 and BRCA-2 genes which are associated with breast and ovarial cancer [24], [25], [26].
This publication deals with the review of tumour-marker external quality assessment (EQA) - schemes offered by Instand e.V. with a critical appraisal of performance and method comparability and their influence on the estimation of the diagnostic sensitivity and specificity.
The large variation in kit-performance, as far as numerical values are concerned, raises the question as to whether the "cut-off" values generally accepted but not validated for each method/kit, are of any use in terms of setting limits for diagnostic sensitivity and specificity.
Materials and methods
The data used in this publication was obtained from the EQA schemes run by Instand e.V. during 2003 and 2004.
Two samples - lyophilised processed serum for the proteohormones, thyroglobulin and α-foetoprotein; liquid processed serum for the CA-markers, carcinoembryonic antigen and prostate-specific antigen - containig different analyte concentrations were sent for analysis with each survey.
Participants were requested to return the analysis data together with details concerning the measuring device and method/kit used.
Data was used from EQA-schemes for the following analytes: calcitonin (CT, hCT), thyroglobulin, α-foetoprotein (AFP), chorionic gonadotropin, prolactin, corticotropin, prostate-specific antigen (free, total and complexed: f-PSA; t-PSA; c-PSA), carcinoembryonic antigen (CEA), CA-125, CA 19-9, CA 72-4 and CA 15-3.
Statistics
Any statistical comparisons used were based on the calculation of the measure of central tendency (mean, median) and dispersion (standard deviation and coefficient of variation (normally distributed data)) defined confidence intervals as centiles (non-Gaussian data distribution) and mainly included box and whisker plots and data distribution curves for graphic illustration of group-results.
Statistical comparisons between methods for a given analyte were not made because the study was designed to present data in a visual way, rather than to compare the inter-method performance.
Results
The results are given separately for each analyte. Samples 1 and 2 were the same pair in Tables 1-3 (Tab. 1), (Tab. 2), (Tab. 3). Sample 1 was pooled adult male serum, Sample 2 pooled adult female serum. Both samples were spiked and filtered (0.2 µm pore size).
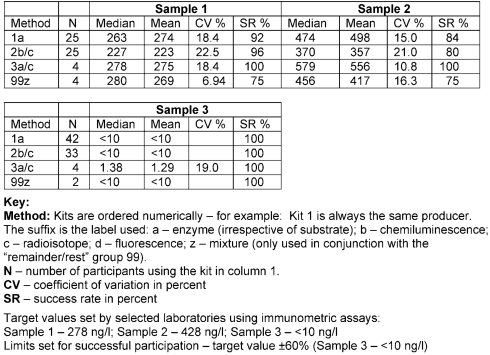
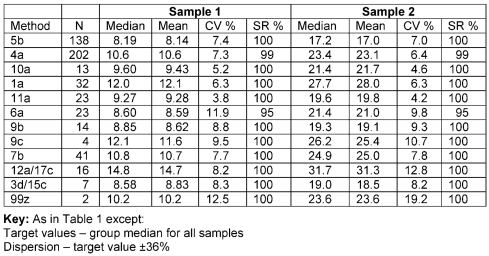
Table 1. 1-39 ACTH - EQAS results - arranged according to methods.
ACTH concentrations in ng/l
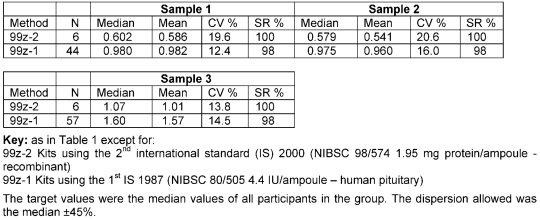
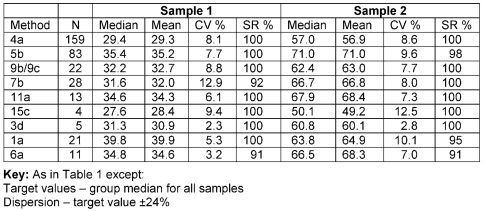
Table 2. Growth hormone - EQAS results - arranged according to methods .
Growth hormone concentrations in µg/l
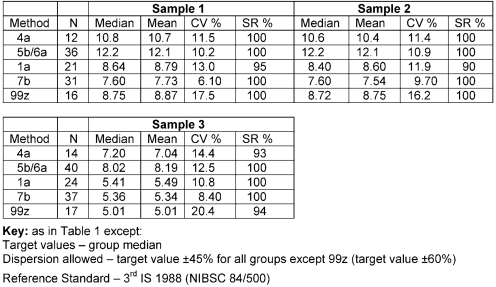
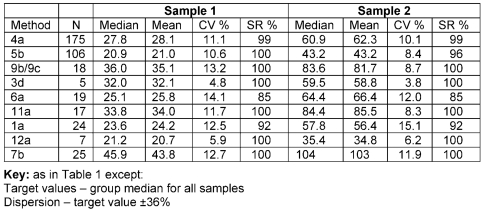
Table 3. Prolactin - EQAS results - arranged according to methods .
Prolactin concentrations in µg/l
Generally accepted cut-off levels for the "CA-Markers", CEA and total PSA have been given in the text [27], (see also [28]). These "decision-limits" have usually been made many years ago for assay-designs (e.g. competitive radioimmunoassay) no longer existing. They have not been validated for immunometric methods and should be interpreted with care.
There are no such "dogmatic-limits" for the other analytes used as tumour markers.
a. Corticotropin (1-39 ACTH)
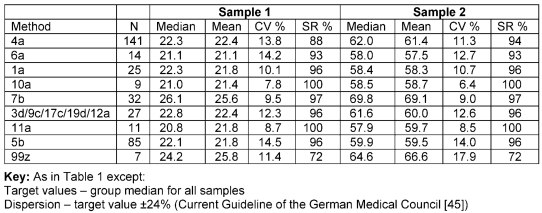
The problems with 1-39 ACTH are due more to stability of the analyte than to analytical problems, although some kits react more "allergically" than others.
Table 1 (Tab. 1) shows the results from three samples sent in different EQA-surveys in 2004.
b. Growth Hormone (GH, hGH)
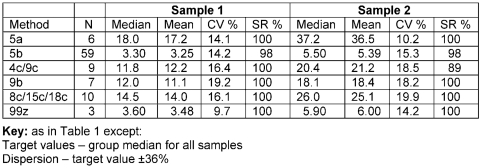
At present, kits are using both the 1st IS, which is an extract from human pitutitaries, as well as the recombinant 22 kD 2nd IS. The comparison between kits is so good that all kits using the same reference standard can be grouped together. The values obtained using the recombinant material are substantially lower than those from the extracted human pituitaries.
Table 2 (Tab. 2) shows the results for growth hormone assays from three samples sent in different EQA-surveys (EQAS) in 2004.
c. Prolactin (PRL)
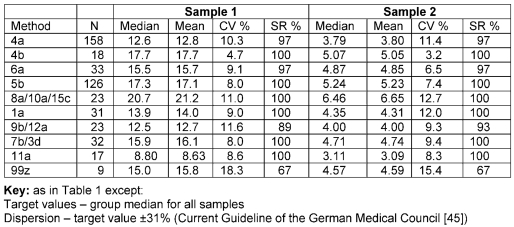
Prolactin kits were calibrated exclusively with the 3rd international standard. Table 3 (Tab. 3) shows the results for prolactin results from three samples distributed in 2004.
d. Chorionic Gonadotropin (CG, hCG)
The kits were divided into those measuring only holo-hCG, holo-hCG + free β-chain and only free β-chain. Results were given as method specific in the first two cases and as a single group in the latter case.
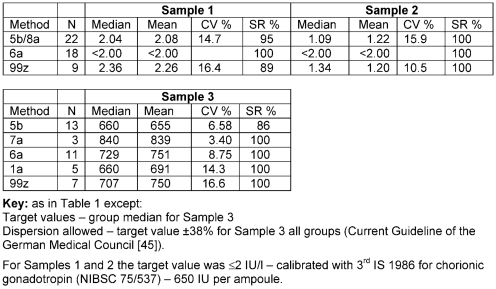
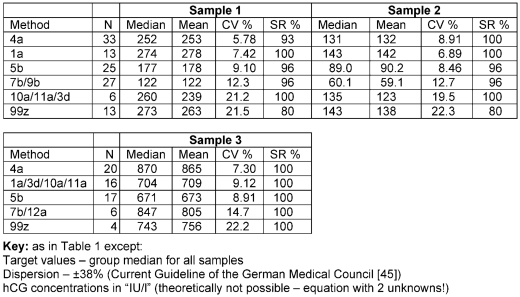
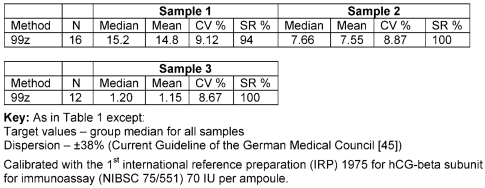
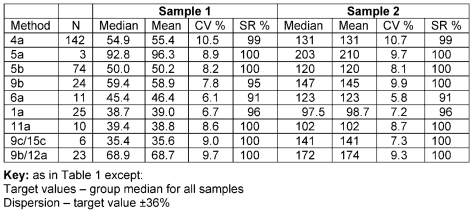
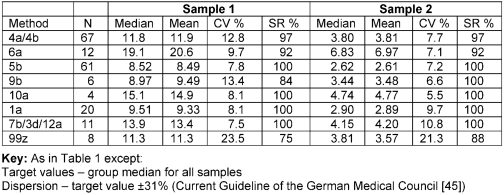
The calibration of methods for holo-hCG was with the 3rd IS (NIBSC 75/537), for free β-chain with the 1st IRP for immunoassay (NIBSC 75/551). Accurate calibration of kits which determine both holo-hCG and free β-chain is impossible, as there are two unknown variables. Both reference preparations are given in IU/ampoule, but 1 IU holo-hCG is not equal to 1 IU free β-chain. The specificity of the antibodies for holo-hCG is well documented in Table 4 (Tab. 4). The cross-reactivity of the free β-chain in the "mixed" assays can be seen by comparing the values for samples 1 and 2 in Tables 4 (Tab. 4) and 5 (Tab. 5). The results from three EQA samples sent in 2004 are shown in Tables 4-6 (Tab. 4), (Tab. 5), (Tab. 6).
Table 4. Holo-hCG - EQAS results - arranged according to methods .
hCG concentrations in IU/l (NIBSC 75/537)
Table 5. Holo-hCG + free β-chain - EQAS results - arranged according to methods.
Table 6. Free β-chain - EQAS results - arranged according to methods .
β-hCG concentration in IU/l (NIBSC 75/551)
e. Calcitonin (CT, hCT)
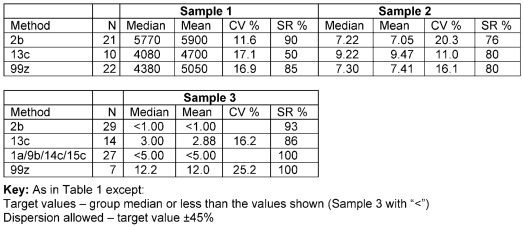
The assays for calcitonin must be able to recognise very high values as such, so that a high-dose hook effect must be eliminated from hCT-assays. The concentrations of calcitonin seen in the serum of unoperated medullary thyroid caricinoma (MCT) patients is in the ng/l to mg/l range. The physician requires accurate pre- and post-operative values in order to assess the success of the operation. Values "greater than" are of little or no use here.
The results from three EQA-samples distributed in 2004 are shown in Table 7 (Tab. 7).
Table 7. Calcitonin - EQAS results - arranged according to methods .
Calcitonin concentration - ng/l
f. Thyroglobulin (Tg)
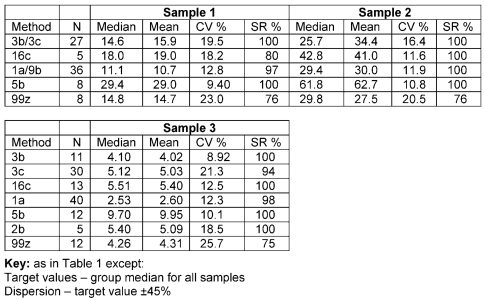
The kits must measure precisely at the lowest concentration possible (≤2 µg/l) if they are to be used as tumour markers after total thyroidectomy, where recurrence of thyroglobulin in serum or plasma indicates metastatic growth. The precision of the kits shown in Table 8 (Tab. 8) is acceptable at all three levels controlled. Kit 5b measures precisely, but consistently higher than the other methods. This could prove a problem for the physician responsible for monitoring thyroid cancer if the laboratory changed methods - for example from manufacturer 3 to manufacturer 5 - and this information failed to reach the physician.
Table 8. Thyroglobulin - EQAS results - arranged according to methods .
Thyroglobulin concentration - µg/l
g. Carcinoembryonic Antigen (CEA)
CEA is generally used in assessing colorectal cancers and liver metastases. The generally accepted cut-off values for CEA are between 1.5 and 5 µg/l, depending upon the kit used.
Table 9 (Tab. 9) shows the results from different manufacturers for CEA Kits in 2 samples dispatched in 2002. Samples were liquid and were commercially prepared from pooled patient sera specially for Instand e.V.
Table 9. Carcinoembryonic antigen - EQAS results - arranged according to methods .
CEA concentration - µg/l
The median values for each method/method-group varied by up to 85%.
h. CA 15-3
CA 15-3 is used in the in-vitro monitoring of breast cancer. The generally accepted cut-off value for CA 15-3 is 25 kU/l, independent of the kit used.
Table 10 (Tab. 10) shows the results for CA 15-3 for the same samples as in Table 9 (Tab. 9).
Table 10. CA 15-3 - EQAS results - arranged according to methods .
CA 15-3 concentration - kU/l
The inter-kit comparison of the distribution of results was comparable for both samples (variation of the method-median: Sample 1 - 44%; Sample 2 - 42%).
i. CA 19-9
CA 19-9 is often used in conjunction with CEA in monitoring intestinal cancer. The generally accepted cut-off value for CA 19-9 is 37 kU/l.
Table 11 shows the results for CA 19-9 for the same samples as in Table 9 (Tab. 9). Figure 1 (Fig. 1) shows a box and whisker plot for Sample 2 in Table 11 (Tab. 11).
Figure 1. Spread of results for Sample 2 in Table 11 listed according to kit/method .
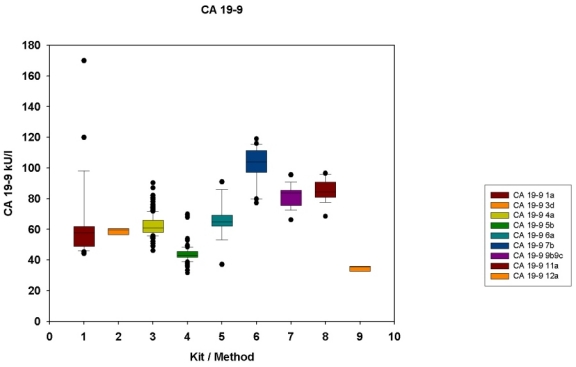
The kit/method is shown on the abscissa and in the legend, the CA 19-9 concentrations on the ordinate. The values between the lower and upper quartiles (25th-75th centiles) are within the box. The whiskers represent the limits ±1.5 x (75th-25th centile values). Outliers are shown as filled circles. The median is shown by the horizontal line within the box. The number of participants for each kit/method is given in Table 11.
Table 11. CA 19-9 - EQAS results - arranged according to methods .
CA 19-9 concentration - kU/l
The inter-kit comparison was not comparable for both samples (variation of the method-median: Sample 1 - 116%; Sample 2 - 140%). The method comparison results for CA 19-9 was worse than for CA 15-3.
j. CA 125
CA 125 was found to be useful in monitoring ovarian cancer. The generally accepted cut-off level for CA 125 is 35 kU/l.
Table 12 (Tab. 12) shows the results for CA 125 for the same samples as in Table 9 (Tab. 9).
Table 12. CA 125 - EQAS results - arranged according to methods .
CA 125 concentration - kU/l
The inter-kit comparison was again not comparable for both samples (variation of the method-median: Sample 1 - 162%; Sample 2 - 108%). The inter-kit variation was similar to that for CA 19-9.
k. CA 72-4
CA 72-4 (formerly known as Tennessee Antigen (TAG)) is used in the follow-up of gastric cancer. The generally accepted cut-off level for CA 72-4 (TAG 72-4) is 4 kU/l.
Table 13 (Tab. 13) shows the results for CA 72-4 (TAG 72-4) for the same samples as in Table 9 (Tab. 9).
Table 13. CA 72-4 - EQAS results - arranged according to methods .
CA 72-4 concentration - kU/l
The inter-kit comparison was comparable for both samples (variation of the method-median: Sample 1 - 445%; Sample 2 - 576%). The variation of results from different kits was the greatest here, although one kit (5b) gave much lower results that the other kits. Even another kit offered by the same manufacturer (5a) gave results between 6 and 7 times higher than kit 5b. This reflects the absence of standardisation in the determination of the "CA"- tumour markers as a whole, with perhaps the exception of CA 15-3.
l. Alpha-Foetoprotein (AFP)
Alpha foetoprotein has mainly been used for monitoring primary hepatic cancer. The accepted range for healthy non-pregnant individuals is ≤7 kIU/l (≈10 µg/l) (calibrated with NIBSC 72/225).
Table 14 (Tab. 14) shows the results for AFP for the same samples as in Table 9 (Tab. 9).
Table 14. Alpha-foetoprotein - EQAS results - arranged according to methods .
AFP concentration - µg/l
The inter-kit comparison of results is much better than for the "CA"-markers, the variation of the kit-medians for Sample 1 being 25% and for Sample 2, 22%. This may be due to the fact that all AFP kits have been calibrated against the WHO Standard (NIBSC 72/225), which is no longer available.
m. Total Prostate-Specific Antigen (t-PSA); Free PSA (f-PSA); Complexed PSA (c-PSA)
The various forms of circulating prostate-specific antigen (PSA) have been widely used - both singly and in combination - to monitor and differentiate between benign and malignant disorders of the prostate. The generally accepted cut-off for t-PSA is 4 µg/l. The ratios between t-PSA and f-PSA or c-PSA and f-PSA are strictly method-dependent. t-PSA assays may be calibrated with the first international standard (NIBSC 96/670), a mixture of c-PSA (90%) and f-PSA (10%).
Table 15 (Tab. 15) shows the results for t-PSA, Table 16 (Tab. 16) for f-PSA and Table 17 (Tab. 17) for c-PSA in the same samples as for Table 9 (Tab. 9).
Table 15. Total PSA - EQAS results - arranged according to methods .
PSA concentration - µg/l
Table 16. Free PSA - EQAS results - arranged according to methods .
Free PSA concentration - µg/l
Table 17. Complexed PSA - EQAS results - arranged according to methods .
Complexed PSA concentration as µg/l PSA (not µg/l PSA-ACT complex)
The difference in specificity of the antibody-pairs for PSA determination can be seen in Tables 15 (Tab. 15) and 16 (Tab. 16). The material used for spiking was from seminal fluid, known to be mainly composed of free PSA. Whereas kit 5b differentiated well between "total" and "free" PSA, kit 6a measured more free PSA than total PSA! The results in Table 17 (Tab. 17) shows the amount of PSA-α1-antichymotrypsin (PSA-ACT) in each sample, which is usually much more abundant than free PSA and reflects the non-physiological nature of both samples, due to the reason stated above.
Figures 2 (Fig. 2) and 3 (Fig. 3) show the results from Tables 15-17 (Tab. 15), (Tab. 16), (Tab. 17) in the form of a box-and whisker plot.
Figure 2. Spread of results for total PSA .
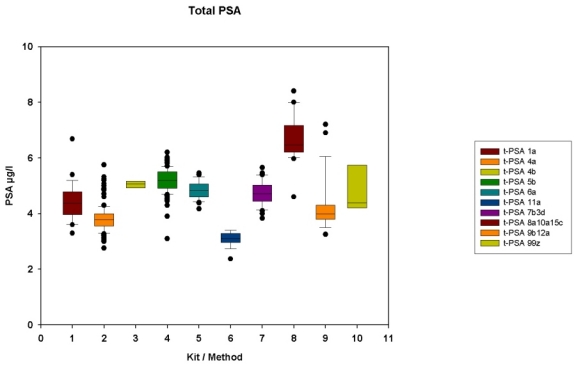
The layout for Figure 2 is identical to that in Figure 1.
Figure 3. Spread of results for free (10 kits/methods) and complexed PSA (1 kit) .
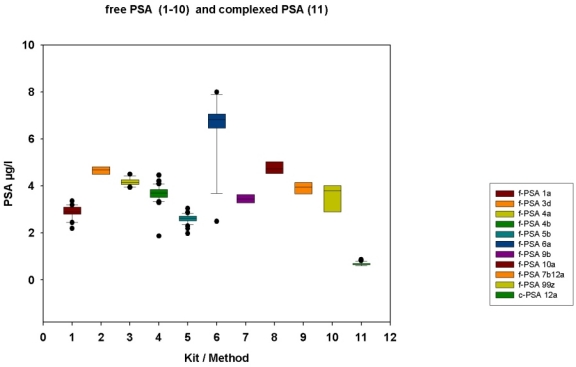
The layout for Figure 3 is identical to that in Figure 1.
There were large variations in the median values from both total and free PSA kits as can easily be seen in Figures 2 (Fig. 2) and 3 (Fig. 3).
Discussion
The results from the EQA-surveys show that the standardisation of assays used as tumour markers is in many cases far from being optimised. The data presented show that at the present time the hormone assays used for tumour monitoring are on the whole more precise and give rise to more comparable results than the less-specific mucin-carbohydrate "CA-markers" and the various circulating forms of PSA.
The problems of tumour marker measurement have both a physiological and methodological component. For example the determination of CA 19-9, a marker related to the Lewis-antigens [29], [30], [31] is not produced in patients who are both Lewis a and Lewis b negative [31]. This means, that such patients can have large intestinal tumours, which are "negative" for CA 19-9 in serum. Many tumour markers are influenced by renal function, so that dialysis patients and those with impaired renal function may have different (mostly elevated) concentrations when compared with patients with normal renal function [32], [33]. Others, such as AFP, are increased in pregnancy.
There are very few "specific" tumour markers. Examples are calcitonin (CT) in medullary thyroid cancer (MTC) and thyroglobulin (Tg) in thyroidectomised patients, although the latter may be masked by the presence of circulating antibodies to Tg. Elevated levels of chorionic gonadotropin (CG) is relatively specific in males as a marker of germinal-cell cancer.
The commercial interest in tumour-markers cannot be ignored, both from the side of kit-producers as well as from kit-users. The clinical use is far more restricted, many "tumour markers" not being able to fulfil their specifications with regard to both analytical and diagnostic sensitivity and specificity. Clinical decisions made purely on levels of tumour markers - with the exception of perhaps CT, Tg and CG in males - must be seen as irresponsible, especially in a decentralised health system with the free choice of analytical laboratory and methods used.
The EQA results clearly show that the comparability of results and continuity in monitoring patient progress is only possible when using the same method with the same components over a long period of time. The danger of "rationalisation" and "cost-saving" (= buying the cheapest kit offered) practiced by many administrators, coupled with the ignorance of the medical staff on the methodological problems mentioned above, further limits the quality of data obtained from analysing "tumour markers".
The effect of numerical values can be visualised in comparing the diagnostic sensitivity (the correct prediction of a positive (=tumour present) result) and diagnostic specificity (the correct prediction of a negative (=tumour not present) result). Figures 4 (Fig. 4) and 5 (Fig. 5) show the ideal case for a tumour marker, where healthy (red) and sick (blue) patients are clearly separated from each other (diagnostic sensitivity and specificity 100%). Figures 6 (Fig. 6) and 7 (Fig. 7) show the more common situation, i.e. where both groups overlap. In Figure 7 (Fig. 7), there are three ways of setting a decision point. At point A we have the lowest analyte concentration where all sick patients are correctly allocated (diagnostic sensitivity 100%). A number of healthy patients have however concentrations higher than this point (diagnostic specificity <100%) and would be classified as sick. At point B we have the converse situation - the highest concentration where all healthy individuals are correctly classified (diagnostic specificity 100%), but where some sick individuals (those under the blue curve to the left of B) are to be found (diagnostic sensitivity <100%) and are classified wrongly as being healthy. Point C represents the best compromise where the degree of false classification is minimised, but where sick and healthy individuals in the border region may be wrongly classified (diagnostic sensitivity and specificity in this case <100%).
Figure 4. Data for setting diagnostic sensitivity and specificity as histograms .
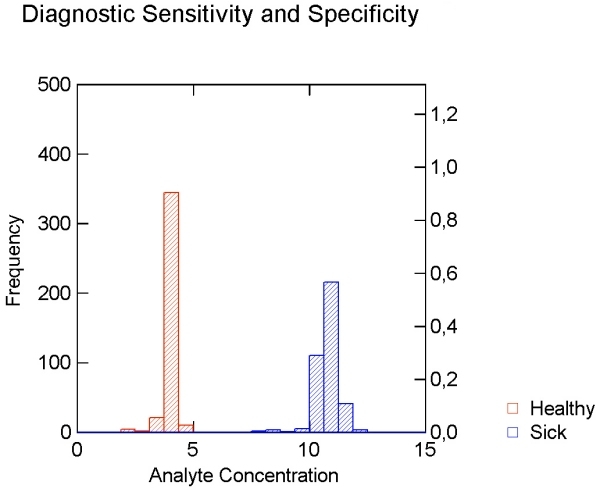
Figure 4 shows the ideal situation where healthy (red) and sick (blue) patients are clearly separated from each other. The abscissa shows the analyte concentration, the left ordinate the frequency in each column. The right ordinate shows the relative frequency distribution (Value: 0=0%; 1=100%).
Figure 5. Smoothed data distribution curves for the data in Figure 4 .
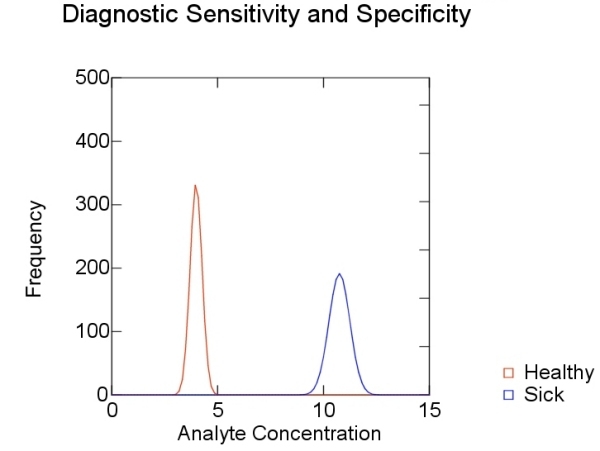
The abscissa and left ordinate are as in Figure 4.
Figure 6. Data for setting diagnostic sensitivity and specificity as histograms .
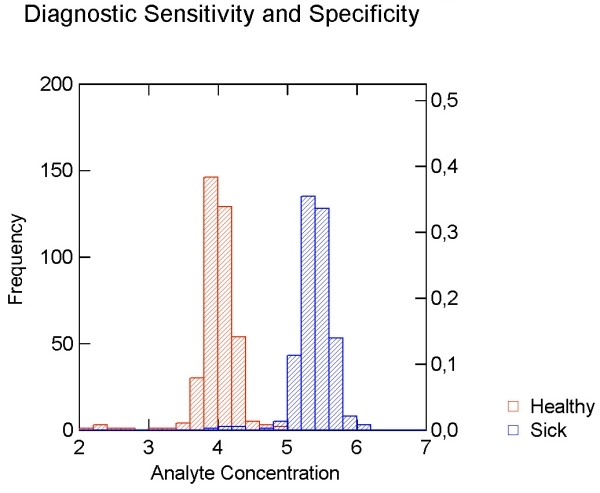
Figure 6 shows the real situation where the groups of healthy (red) and sick (blue) patients overlap. The abscissa shows the analyte concentration, the left ordinate the frequency in each column. The right ordinate shows the relative frequency distribution (Value: 0=0%; 1=100%).
Figure 7. Smoothed data distribution curves for the data in Figure 6 .
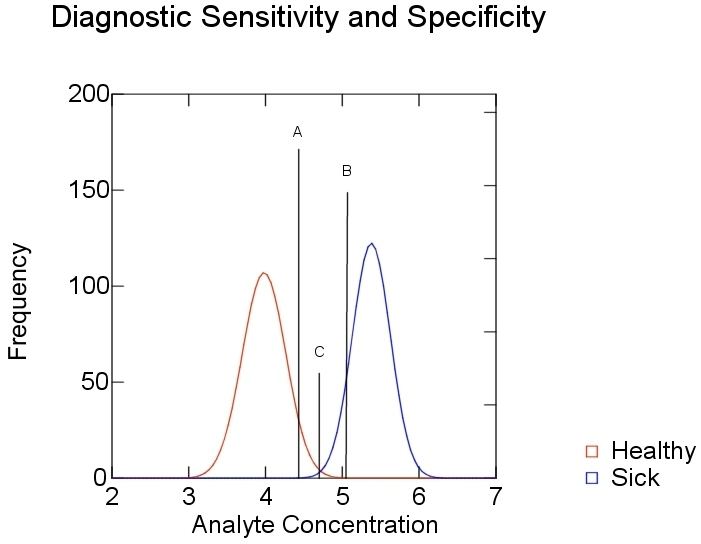
Figure 7 shows the analyte concentration for 100% diagnostic sensitivity (A) and 100% diagnostic specificity (C). Point B shows the compromised "real-life" situation, where both diagnostic sensitivity and specificity are less than 100%. The abscissa and ordinates are as in Figure 6.
In the case of t-PSA, if we leave the points A, B and C in Figure 7 (Fig. 7) where they are and measure patient sera with the methods in Table 15, it becomes obvious that the red and blue curves will be moved - either to the right or to the left - thus changing the diagnostic sensitivity and specificity according to the method/kit used. The points A,B and C must be evaluated for each kit.
Figure 8 (Fig. 8) shows the distribution of data of the t-PSA Sample 2 in Table 15. Both the mean values and precision of measurement (seen by the different degrees of kurtosis) make it clear that the variability in measurement - here taking t-PSA as the example - must lead to different kit-specific cut-off values, thus nullifying a static point of decision at 4 µg/l. Both extremes are shown by the points A (Kit 11a) and B (Kits 8a, 10a and 15c).
Figure 8. Data for Sample 2 in Table 15 (total PSA) highlighting the variabilty of measurement, both in absolute concentration and precision for the different kits on the market .
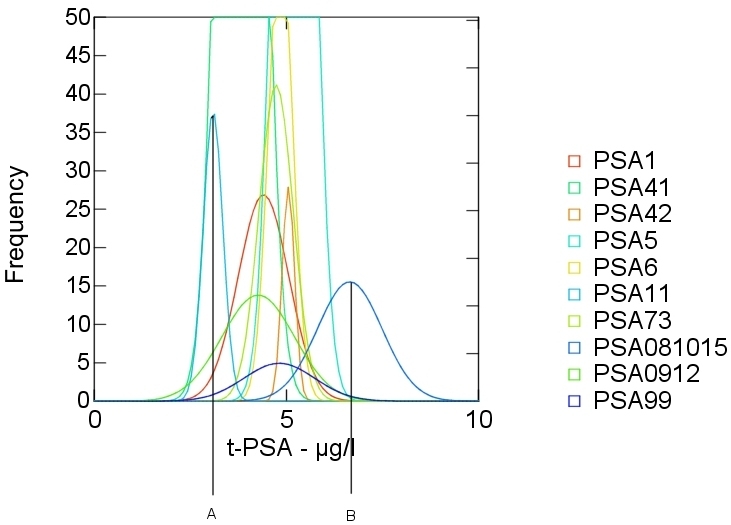
The abscissa and ordinate are as in Figures 5 and 7.
Standardisation of methods - not with international antigen preparations but with defined antigenic epitopes recognised by defined monoclonal antibodies, as in the case of the tumour marker Cyfra 21-1 [34], can lead to more comparability between manufacturers and to an improvement in the interpretation of results by clinical staff, thus improving the benefits to patients subjected to such analyses.
Method-dependent differences in results, especially in the case of PSA, make it imperative that method-specific reference ranges and "cut-off" values must be established for each analyte. In the case of PSA, where ratios between free and total PSA or complexed and total PSA are used in differentiating between benign and malignant disease, kits from the same manufacturer must be used for free and total/complexed PSA, if the ratios given by the manufacturer are to have any clinical use. General reference-ranges and ratios often given in text books are of no use, due to the individual nature of results from different manufacturers, although some authors [35] point out the importance of using kit-specific reference ranges. The importance of this is shown in Tables 15 and 16 above, even though the samples were not physiological (concentration of free PSA much higher than complexed PSA). Even kits from the same manufacturer, but developed for different instruments with different measuring techniques may give rise to statistically different results from the same sample - here seen in kits 41 and 42 for t-PSA.
The use of generalised figures for the diagnostic sensitivity and specificity of tumour-marker kits must be discouraged, as seen in the results from this study (as an example, see Figure 1 (Fig. 1)). Each laboratory must therefore estimate its own diagnostic sensitivity and specificity for all tumour-markers from data obtained from the kit used and the group(s) of patients studied. The relatively low diagnostic sensitivity and/or specificity shown by many tumour-markers reflects their inability to be used for screening purposes. Despite this, medical staff still use tumour markers for patient screening - especially PSA - although no prospective randomised trial has been performed to validate or reject the use of PSA in screening for prostate cancer [36]. Recently, the value of PSA in diagnosis and monitoring of prostate cancer has again been questioned [37]. Even in review articles, the cut-off for t-PSA decision taking is set at 4 µg/l, despite evidence for method dependent reference ranges cited in the same article [38]!
Even in the case of post-operative follow up, it is possible, that when metastasis occurs, "tumour-specific-antigens" may be produced which are structurally different from those in the primary tumour, thus rendering the further use of the original marker for follow-up useless.
The future of detection and post-operative follow-up of tumours may very well lie in the developing field of gene-expression chips [39]. That synthesis of tumour markers can change during the development of neoplasms has been shown in immunohistochemical studies [40].
Even the use of genetical markers can at present only predict a predisposition for - in this case - the development of a certain tumour. The time of appearance of the lesion cannot be predicted from the presence of or mutations in certain genes - for example BRCA-1 [24], which usually lead to the development of breast and/or ovarian cancer before the 5th decade of life.
Classical methods of detection and control, such as x-ray, sonography, PET, MRT and computer tomography, will remain the "golden" standards of tumour detection and control of tumour progression/remission for many years to come, although "gene-chips" will play an increasingly important role in detection of those at risk, as well as post-operative follow-up of cancer patients [41], [42], [43], [44].
To conclude, the majority of analytes used as tumour markers are unsuitable for screening purposes. Exceptions are the measurement of calcitonin, chorionic gonadotropin and thyroglobulin when used in the situations stated above. The use of the other analytes reported in this article may be of use in longitudinal follow-up pre- and post-operatively, with the restriction that the method used for a given analyte must always be the same, at least until both an acceptable standardisation of methods/results and comparability of numerical values (concentrations) is achieved. The latter has not been realised and is not to be expected in the near future, at least for the majority of analytes. Until then, defined individual cut-off values must be established for each tumour marker kit on the market.
References
- 1.von Euler U, Lishajko F. Improved technique for the fluorimetric estimation of catecholamines. Acta Physiol Scand. 1961;51:348–355. doi: 10.1111/j.1748-1716.1961.tb02128.x. [DOI] [PubMed] [Google Scholar]
- 2.Turler K, Kaser H. Quantitative fluorimetric determination of urinary dopa and its significance for the diagnosis of neural crest tumours. Clin Chim Acta. 1971;32(1):41–51. doi: 10.1016/0009-8981(71)90461-x. [DOI] [PubMed] [Google Scholar]
- 3.Wood WG, Mainwaring-Burton RW. The development and evaluation of a semi-automated assay for catecholamines suitable for plasma and urine. Clin Chim Acta. 1975;61(3):297–308. doi: 10.1016/0009-8981(75)90420-9. [DOI] [PubMed] [Google Scholar]
- 4.Feldman JM. Serotonin metabolism in patients with carcinoid tumors: incidence of 5-hydroxytryptophan-secreting tumors. Gastroenterology. 1978;75(6):1109–1114. [PubMed] [Google Scholar]
- 5.Huggins C, Hodges CV. Studies on prostatic cancer. The effects of castration, of estrogen and of androgen injection on serum phosphatases in metastatic carcinoma of the prostate. Cancer Res. 1941;1:293–297. [Google Scholar]
- 6.Berson SA, Yalow RS. Radioimmunoassay of ACTH in plasma. J Clin Invest. 1968;47(12):2725–2751. doi: 10.1172/JCI105955. [DOI] [PMC free article] [PubMed] [Google Scholar]
- 7.Bloomfield GA, Holdaway IM, Corrin B, Ratcliffe JG, Rees GM, Ellison M, Rees LH. Lung tumours and ACTH production. Clin Endocrinol (Oxf) 1977;6(2):95–104. doi: 10.1111/j.1365-2265.1977.tb02000.x. [DOI] [PubMed] [Google Scholar]
- 8.Rushworth AG, Orr AH, Bagshawe KD. The concentration of HCG in the plasma and spinal fluid of patients with trophoblastic tumours in the central nervous system. Br J Cancer. 1968;22(2):253–257. doi: 10.1038/bjc.1968.33. [DOI] [PMC free article] [PubMed] [Google Scholar]
- 9.Tashjian AH, Jr, Melvin EW. Medullary carcinoma of the thyroid gland. Studies of thyrocalcitonin in plasma and tumor extracts. N Eng J Med. 1968;279(6):279–283. doi: 10.1056/NEJM196808082790602. [DOI] [PubMed] [Google Scholar]
- 10.Murphy BE. Radioassays of non-antigenic hormones. Trans Assoc Am Physicians. 1968;81:92–103. [PubMed] [Google Scholar]
- 11.Midgley AR, Jr, Niswender GD, Ram JS. Hapten-radioimmunoassay: a general procedure for the estimation of steroidal and other haptenic substances. Steroids. 1969;13(6):731–737. doi: 10.1016/0039-128x(69)90069-5. [DOI] [PubMed] [Google Scholar]
- 12.Charters AC, Odell WD, Thompson JC. Anterior pituitary function during surgical stress and convalescence. Radioimmunoassay measurement of blood TSH, LH, FSH and growth hormone. J Clin Endocrinol Metab. 1969;29(1):63–71. doi: 10.1210/jcem-29-1-63. [DOI] [PubMed] [Google Scholar]
- 13.Gold P, Freedman SO. Demonstration of tumor specific antigens in human colonic carcinoma by immunologic tolerance and absorption technique. J Exp Med. 1965;121:439–462. doi: 10.1084/jem.121.3.439. [DOI] [PMC free article] [PubMed] [Google Scholar]
- 14.Krupey J, Gold P, Freedman SO. Physicochemical studies of the carcinoembryonic antigens of the human digestive system. J Exp Med. 1968;128(3):387–398. doi: 10.1084/jem.128.3.387. [DOI] [PMC free article] [PubMed] [Google Scholar]
- 15.Del Villano BC, Zurawski VR., Jr The carbohydrate antigenic determinant 19-9 (CA 19-9):a monoclonal antibody defined tumor marker. Lab Res Methods Biol Med. 1983;8:269–282. [PubMed] [Google Scholar]
- 16.Gang Y, Adachi I, Ohkura H, Yamamoto H, Mizuguchi Y, Abe K. CA 15-3 is present as a novel tumour marker in the sera of patients with breast cancer and other malignancies. Gan To Kagaku Ryoho. 1985;12(12):2379–2386. [PubMed] [Google Scholar]
- 17.Bast RC, Jr, Feeney M, Lazarus H, Nadler LM, Colvin RB, Knapp RC. Reactivity of a monoclonal antibody with human ovarian carcinoma. J Clin Invest. 1981;68(5):1331–1337. doi: 10.1172/JCI110380. [DOI] [PMC free article] [PubMed] [Google Scholar]
- 18.Ohuchi N, Takahashi K, Matoba N, Mori S. A radioimmunometric assay for circulating tumor-associated glycoprotein (TAG-72) using the antigen determinant CA 72-4. Gan To Kagaku Ryoho. 1988;15(9):2761–2766. [PubMed] [Google Scholar]
- 19.Wood WG, van der Sloot E, Böhle A. The establishment and evaluation of luminescent-labelled immunometric assays for prostate-specific antigen-alpha 1-antichymotrypsin complexes in serum. Eur J Clin Chem Clin Biochem. 1991;29(12):787–794. doi: 10.1515/cclm.1991.29.12.787. [DOI] [PubMed] [Google Scholar]
- 20.Wu JT, Wilson LW. Development of a microplate ELISA for free PSA and PSA-ACT complex in serum. J Clin Lab Anal. 1995;9(4):252–260. doi: 10.1002/jcla.1860090407. [DOI] [PubMed] [Google Scholar]
- 21.Mitrunen K, Pettersson K, Piironen T, Bjork T, Lilja H, Lövgren T. Dual-label one-step immunoassay for simultaneous measurement of free and total prostate-specific antigen concentrations and ratios in serum. Clin Chem. 1995;41(8 Pt 1):1115–1120. [PubMed] [Google Scholar]
- 22.Stenman UH, Leinonen J, Alfthan H, Rannikko S, Tuhkanen K, Alfthan O. A complex between prostate-specific antigen and alpha1-antichymotrypsin is the major form of prostate-specific antigen in serum of patients with prostatic cancer:assay of the complex improves clinical sensitivity for cancer. Cancer Res. 1991;51(1):222–226. [PubMed] [Google Scholar]
- 23.Vessella RL, Lange PH. Issues in the assessment of PSA immunoassays. Urol Clin North Am. 1993;20(4):607–619. [PubMed] [Google Scholar]
- 24.Hall JM, Freedman L, Guenther C, Lee MK, Weber JL, Black DM, King MC. Closing in on a breast cancer gene on chromosome 17q. Amer J Hum Genet. 1992;50(6):1235–1242. [PMC free article] [PubMed] [Google Scholar]
- 25.Schutte M, Rozenblum E, Moskaluk CA, Guan X, Hoque AT, Hahn SA, da Costa LT, de Jong PJ, Kern SE. An integrated high-resolution physical map of the DPC/BRCA2 region at chromosome 13q12. Cancer Res. 1995;55(29):4570–4574. [PubMed] [Google Scholar]
- 26.Cornelisse CJ, Cornelis RS, Devilee P. Genes responsible for familial breast cancer. Pathol Res Pract. 1996;192(7):684–693. doi: 10.1016/S0344-0338(96)80090-2. [DOI] [PubMed] [Google Scholar]
- 27.Stieber P, Thomas L, Lamerz R, Raue F, Grauer A, Nollau P, et al. Tumormarker (Kapitel 28) In: Thomas L, editor. Labor und Diagnose - Indikation und Bewertung von Laborbefunden für die medizinische Diagnostik. 6. Aufl. Frankfurt/Main: TH-Books Verlagsgesellschaft mbH; 2005. pp. 1291–1366. [Google Scholar]
- 28.Thomas L, Lüthgens M, Wagener C, Lamerz R, Mann K, Tatra G, et al. Tumormarker. In: Thomas L, editor. Labor und Diagnose - Indikation und Bewertung von Laborbefunden in die medizinische Diagnostik. 3., überarb. u. erw. Aufl. Marburg: Med. Verlagsgesellschaft; 1988. pp. 945–1015. [Google Scholar]
- 29.Herrero-Zabaleta ME, Gautier R, Burtin P, Daher N, Bara J. Monoclonal antibody against sialylated Lewis(a) antigen. Bull Cancer. 1987;74(4):387–396. [PubMed] [Google Scholar]
- 30.Hirohashi S, Shimosato Y, Ino Y, Tome Y, Watanabe M, Hirota T, Itabashi M. Distribution of blood group antigens and CA 19-9 in gastric cancers and non-neoplastic gastric mucosa. Gann. 1984;75(6):540–547. [PubMed] [Google Scholar]
- 31.Pour PM, Tempero MM, Takasaki H, Uchida E, Takiyama Y, Burnett DA, Steplewski Z. Expression of blood group related antigens ABH, Lewis A, Lewis B, Lewis X, Lewis Y, and CA 19-9 in pancreatic cancer cells in comparison with the patient's blood group type. Cancer Res. 1988;48(19):5422–5426. [PubMed] [Google Scholar]
- 32.Wood WG, Steinhoff J, Kessler AC. Anomalous tumour marker concentrations in renal transplant patients. Eur J Clin Chem Clin Biochem. 1993;31(2):75–82. doi: 10.1515/cclm.1993.31.2.75. [DOI] [PubMed] [Google Scholar]
- 33.Wood WG, Steinhoff J, Gutekunst R. Sense and nonsense in determination of tumour markers in serum - results with potentially disastrous consequences. In: Klapdor R, editor. Tumor associated antigens, oncogenes, receptors, cytokines in tumor diagnosis and therapy at the beginning of the nineties. München: Zuckschwerdt; 1992. pp. 305–312. [Google Scholar]
- 34.Bodenmüller H, Ofenloch-Hähnle B, Lane EB, Dessauer A, Böttger V, Donie F. Lung cancer-associated keratin 19 fragments:development and biochemical characterisation of the new serum assay Enzymun-Test CYFRA 21-1. Int J Biol Markers. 1994;9(2):75–81. doi: 10.1177/172460089400900203. [DOI] [PubMed] [Google Scholar]
- 35.Lamerz R. PSA (Prostata-spezifisches Anitigen) (Kap. 34.14) In: Thomas L, editor. Labor und Diagnose. 5. ed. Frankfurt/Main: TH-Books Verlagsgesellschaft; 1998. pp. 1004–1008. [Google Scholar]
- 36.Duffy MJ. Evidence for the clinical use of tumour markers. Ann Clin Biochem. 2004;41(Pt 5):370–377. doi: 10.1258/0004563041731529. [DOI] [PubMed] [Google Scholar]
- 37.Stamey TA, Caldwell M, McNeal JE, Nolley R, Hemenez M, Downs J. The prostate specific antigen era in the United States is over for prostate cancer: what happened in the last 20 years? J Urol. 2004;172(4 Pt 1):1297–1301. doi: 10.1097/01.ju.0000139993.51181.5d. [DOI] [PubMed] [Google Scholar]
- 38.Brawer MK. Prostate-specific antigen: current status. CA Cancer J Clin. 1999;49(5):264–281. doi: 10.3322/canjclin.49.5.264. [DOI] [PubMed] [Google Scholar]
- 39.Mutter GL, Baak JP, Fitzgerald JT, Gray R, Neuberg D, Kust GA, Gentleman R, Gullans SR, Wei LJ, Wilcox M. Global expression changes of constitutive and hormonally regulated genes during endometrial neoplastic transformation. Gynecol Oncol. 2001;83(2):177–185. doi: 10.1006/gyno.2001.6352. [DOI] [PubMed] [Google Scholar]
- 40.Van Niekerk CC, Boerman OC, Ramaekers FC, Poels LG. Marker profile of different phases in the transition of normal human ovarian epithelium to ovarian carcinomas. Am J Pathol. 1991;138(2):455–463. [PMC free article] [PubMed] [Google Scholar]
- 41.Holleman A, Cheok MH, den Boer ML, Yang W, Veerman AJ, Kazemier KM, Pei D, Cheng C, Pui CH, Relling MV, Janka-Schaub GE, Pieters R, Evans WE. Gene-expression patterns in drug-resistant acute lymphoblastic leukemia cells and response to treatment. N Engl J Med. 2004;351(6):533–542. doi: 10.1056/NEJMoa033513. [DOI] [PubMed] [Google Scholar]
- 42.Morrison C, Farrar W, Kneile J, Williams N, Liu-Stratton Y, Bakaletz A, Aldred MA, Eng C. Molecular classification of parathyroid neoplasia by gene expression profiling. Am J Pathol. 2004;165(2):565–576. doi: 10.1016/S0002-9440(10)63321-4. [DOI] [PMC free article] [PubMed] [Google Scholar]
- 43.Inazawa J, Inoue J, Imoto I. Comparative genomic hybridisation (CGH)-arrays pave the way for identification of novel cancer-related genes. Cancer Sci. 2004;95(7):559–563. doi: 10.1111/j.1349-7006.2004.tb02486.x. [DOI] [PMC free article] [PubMed] [Google Scholar]
- 44.Whipple ME, Mendez E, Farwell DG, Agoff SN, Chen C. A genomic predictor of oral squamous cell carcinoma. Laryngoscope. 2004;114(8):1346–1354. doi: 10.1097/00005537-200408000-00006. [DOI] [PubMed] [Google Scholar]
- 45.Bundesärztekammer. Richtlinie der Bundesärztekammer zur Qualitätssicherung quantitativer laboratoriumsmedizinischer Untersuchungen. Gemäß Beschluss des Vorstandes der Bundesärztekammer vom 24. August 2001, veröffentlicht im Deutschen Ärzteblatt 98, Heft 42, 19. Oktober 2001, Seite A 2747 - 2759. Zuletzt geändert durch Beschluss des Vorstandes der Bundesärztekammer vom 14. November 2003, veröffentlicht im Deutschen Ärzteblatt 100, Heft 50, 12. Dezember 2003. Dtsch Ärztebl. 2003;100(50):A3335–A3338. Available from: http://www.bundesaerztekammer.de/30/Richtlinien/Richtidx/Labor2002/RiliLabor.pdf. [Google Scholar]


