

Abstract
Obesity is known to be associated with variety of complex diseases including hypertension, cardiovascular disease, diabetes, affective disorders, and some cancers. The heterogeneous genetic (G) and environmental (E) conditions of human populations impart considerable difficulty for uncovering a common etiology between complex disease and their associated risk factors. Development of animal models where G and E variation are more controlled can provide a useful path for both mechanistic exploration and validation of human data. In 1996, we began development of what we thought would be more meaningful models for the study of complex disease. Based upon ideas on evolution of biologic complexity, we propose that aerobic capacity is mechanistically linked to features that divide between health and disease. If true, we hypothesized that artificial selective breeding for low and high aerobic exercise capacity in rats would yield animal models that contrast in propensity for development of complex disease. Here we review basic properties of a model organism to suggest that these rat models represent a more ideal substrate for mechanistic exploration of the GXE interaction between aerobic capacity and risk for complex disease.
A Fundamental Approach to the Development of Animal Models
The heterogeneous genetic (G) and environmental (E) conditions of human populations impart considerable difficulty for uncovering the etiology of complex diseases. Animal models where G and E variation is more controlled can be of major value for both identifying mechanisms of complex disease as well as validation of human data. For an experimental model to emulate any complex disease, these rules apply: (i) “mechanistically” correct, (ii) polygenic, (iii) equate with clinically known features, and (iv) influenced by environmental factors (both in positive and negative forms).
From our view, most commonly utilized animal models are not sufficient for reasons summarized in these four statements
Chemical and physical maneuvers, such as administration of streptozotocin to mimic diabetes or ligation of coronary arteries to emulate arterial disease, more accurately reflect response to injury and not the progression of disease.
Single or multiple gene approaches are problematic because complex diseases generally result from expression of networks of allelic variants sensitive to a given environment (1). Thus, a gene knockout only reveals essentiality of a gene and the biologic reorganization subsequent to its loss. Transgenic models, to be meaningful, require a priori knowledge of the disease-producing sequence variance.
Mutagenic approaches, such as that produced by administration of the gametic mutagen ethylnitrosourea (ENU), are random and provide no direct information as to what allelic variants or gene combinations are involved (2).
Artificial selection seems useful, yet selection on risk features such as increased body weight, high blood pressure, or hyperglycemia would not contain the full complement of underlying disease mechanisms. These problems are even more limiting because chronic diseases emerge not as discrete events, but as clusters, often as a consequence to a negative health environment. These considerations led us to invent a more fundamental and perhaps mechanistic approach to the development of animal models of disease that focused on networks rather than single pathways.
Natural selection and replication are the basic mechanisms that make biology different from other sciences. Evolution builds on what went before such that a simple process eventually becomes complex. We reasoned that if evolution is an accurate statement of our biology, then mechanism of disease must be tightly associated with its patterns. We propose that the etiology of complex disease is linked with the evolutionary transition to cellular complexity that was afforded by the steep thermodynamic gradient of an atmospheric oxygen environment. From this, we put forward that natural selection weighs the benefit of molecular change by its worth for energy transfer. In other words, biological properties derive from and operate within the Laws of Thermodynamics, and this can be a useful foundation to describe how biological systems respond to changes in environment. As a result, individual phenotypes at all levels of biological organization represent a cumulative selection on the exchange of low entropy inputs for high entropy outputs to yield a continuous stream of transferred energy.
Aerobic Capacity Associates with Disease Risk
Inefficient oxygen metabolism is a critical feature in essentially all human disease conditions including type 2 diabetes (1), cardiac arrhythmias (3), inflammation (4), neurodegenerative dysfunction (5), and cancer (6). In a study with over 6,000 subjects, Myers et al. (7) concluded that peak exercise capacity is a more powerful predictor of mortality than other established risk factors. For subjects with various risk factors such as history of hypertension, pulmonary disease, diabetes, smoking, obesity (BMI ≥30), or total cholesterol (>220 mg/dl), the relative risk of death from any cause increased significantly as exercise capacity decreased. In all subgroups (with or without adjustment for age), the risk of death from any cause in subjects whose exercise capacity was less than 5 MET (metabolic equivalent, defined as ∼3.5 ml/kg/min) (<50% age-predicted exercise capacity) was roughly double that of subjects whose exercise capacity was more than 8 MET. They report each 1 MET increase in aerobic exercise capacity was associated with a 12% increase in survival. This study confirms the presence of a graded inverse relation between exercise capacity and all-mortality.
Rat Models Selectively Bred For Low and High Aerobic Capacity
The current phenotype of aerobic exercise capacity can be divided into two components: (i) intrinsic (untrained) and (ii) adaptational (a response to exercise training). Both components show considerable heterogeneity, presumably related to an interaction between genetic and environmental factors (8,9). Multiple systems such as cardiovascular, metabolic, sensorimotor, and neuromuscular as well as aspects of social, behavioral, and present local environmental factors are presumed to combine to determine a current aerobic phenotype. Because of the linkage between aerobic capacity and health, we deemed it important to develop rat models that contrast for low and high aerobic capacity. We hypothesized that if the statistical association between oxygen metabolism and disease risk has mechanistic meaning, then artificial selection based on low and high aerobic exercise capacity would yield animal models that contrast in propensity for development of complex disease. For the initial step, we developed rat genetic models that contrast for the experimentally simpler intrinsic component of aerobic capacity (10).
In 1996 we started large-scale artificial selection for aerobic capacity using the genetically heterogeneous N:NIH rats as the founder population (11). This stock of rats was developed from the intentional crossbreeding of eight inbred strains representing the widest genetic heterogeneity of laboratory rats available. In theory, one may ultimately be able to determine which allelic variants from the eight progenitor strains segregate due to selection (12).
For each rat, aerobic capacity was estimated from total distance run on a speed-ramped treadmill test to exhaustion that was patterned after clinical treadmill tests. The founder population ran to exhaustion by 355 m of distance run which corresponds to about a 23 min run. At each generation, a within-family rotational breeding scheme was applied to 13 families for the low and high lines. This paradigm of breeding retains genetic heterogeneity and keeps the rate of inbreeding at just less than 1% per generation (13).
Eleven generations of selection (Figure 1a) produced a 347% divide in running capacity between the low and high selected lines. On average, the treadmill running capacity decreased 16 m per generation in low capacity runners (LCR) and increased 41 m per generation in high capacity runners (HCR) in response to selection. At generation 11, the LCR rats averaged 191 ±70 m (14.3 min) and the HCR rats ran for 853 ±315 m (41.6 min) (14). Currently at 21 generations (completed in June 2007), the LCR and HCR differ by over 450% in aerobic treadmill running capacity.
Figure 1.

Development of rat models for the study of complex disease. (a) By 11 generations, rats selectively bred for low and high intrinsic aerobic running capacity divided by 347% for distance run to exhaustion. The low capacity runners (LCR) averaged 191 ±70 m (14.3 min) and the high capacity runners (HCR) ran for 853 ±315 m (41.6 min) on a treadmill aerobic exercise test. (b) Changes in body weight followed as a correlated trait. LCR male rats weighed 39% more than HCR males and similarly LCR females weighed 24% more than HCR females. Data are expressed as means ±SD. (Reproduced by permission from ref. 14.)
Development of rat models for the study of complex disease. (a) By 11 generations, rats selectively bred for low and high intrinsic aerobic running capacity divided by 347% for distance run to exhaustion. The low capacity runners (LCR) averaged 191 ±70 m (14.3 min) and the high capacity runners (HCR) ran for 853 ±315 m (41.6 min) on a treadmill aerobic exercise test. (b) Changes in body weight followed as a correlated trait. LCR male rats weighed 39% more than HCR males and similarly LCR females weighed 24% more than HCR females. Data are expressed as means ±SD. (Reproduced by permission from ref. 14.)
Selection produced differences in body weight as a correlated trait. The low line became increasingly heavier and the high line increasingly lighter at each generation (Figure 1b). By generation 11, male LCR rats weighed 92 g more (39%) than HCR males and similarly the LCR female rats weighed 44 g more (24%) than HCR females. Multiple regression analysis using weight and generation as predictors of running capacity revealed that changes in body weight explained between 7% and 20% of the variation in distance run. At later generations, the LCR male rats weighed 40% more than HCR males, and the LCR females weighed over 30% more than HCR females. As such, it seems as if the low and high lines might also serve as contrasting models to determine genes that influence body weight and composition.
Polygenic Features of Aerobic Rat Models
The timing and nature of emergent functional features resulting from artificial selection are not predictable. In general, it appears that selection produced changes in aerobic running capacity by influencing numerous peripheral and central components differentially across time. As early as generation 7, maximal O2 uptake (VO2max) was greater in HCR compared to LCR. This difference was not in central O2 delivery (e.g., cardiac output), rather due exclusively to a greater capillary-to-tissue oxygen transfer by skeletal muscle of HCR (15). The greater tissue O2 extraction and utilization in HCR was the result of increased tissue O2 diffusive capacity (15); this was paralleled by greater capillary density (result of smaller fiber size) and higher oxidative enzyme activity (citrate synthase and β-hydroxyacyl CoA) (16). By generation 15, VO2max was 50% higher in HCR than LCR. The greater VO2max in HCR was entirely the result of greater maximal cardiac output. This, in turn, was mediated primarily by a higher stroke volume (48%) (17). Left ventricular weight, and a trend (P = 0.07) toward shorter left ventricular cell length, is apparent in LCR compared with HCR rats. Furthermore, estimates of isolated left ventricular cell systolic function and diastolic function were lower in LCR rats compared to HCR rats (14) as was calcium handling by cardiomyocytes (18).
Aerobic Rat Models Divide for Several Clinical Risk Factors
A deterioration in cardiovascular function in LCR compared to HCR model was accompanied by evidence for increased risk of cardiovascular disease, such as higher mean arterial blood pressure, increased insulin resistance, greater visceral adiposity, and dyslipidemia. Data in Table 1 summarize risk factors identified in LCR and HCR rats: (i) blood pressure telemetered over 24 h from rats in their home cages was 13% higher in LCR than in the HCR rats. Extrapolating from human data (19), this higher blood pressure doubles the likelihood that the LCR will develop cardiovascular disease relative to the HCR; (ii) nitric oxide-mediated vasorelaxation from isolated ring segments of carotid arteries was 48% greater in HCR relative to LCR. The concentration of acetylcholine that provoked a half-maximal response (median effective concentration, or EC50) was 7.8-fold greater in LCR rats. Endothelial dysfunction is an independent predictor of cardiovascular disease (20) by contributing to increased peripheral vasoconstriction and impaired exercise capacity (21); (iii) blood glucose and insulin levels were higher in LCR relative to the HCR rats, demonstrating that the LCR are more insulin resistant (14); C-peptide/insulin molar ratio was reduced in LCR by comparison to HCR, suggesting that hyperinsulinemia resulted at least partly from reduced insulin clearance; and (iv) LCR had more visceral adiposity, elevated triglycerides, and higher plasma free fatty acids compared with HCR rats. In summary, LCR and HCR rats provide unique heterogeneous models with inherent differences in aerobic capacity and several clinical features related to the metabolic syndrome.
Table 1. LCR and HCR rats differ significantly for disease risk factors.
| LCR | HCR | % difference LCR vs. HCR | |
|---|---|---|---|
| VO2max (ml kg-0.75 min-1) | 43 ± 2 | 68 ± 3 | -58%a |
| Economy of running (mlO2 kg-0.75 m-1) | 4.9 ± 0.1 | 4.2 ± 0.2 | 17%a |
| Blood pressure, mm Hg (24 h average) | 102 ± 7 | 90 ± 7 | 13% |
| Endothelial-mediated vasodilation | 58 ± 7 | 86 ± 7 | 48% |
| Random glucose, mg/dl | 86 ± 6 | 75 ± 12 | 15% |
| Fasting glucose, mg/dl | 110 ± 9 | 92 ± 5 | 20% |
| Insulin, pM | 684 ± 195 | 296 ± 172 | 131% |
| C-peptide/insulin, ratio | 2.4 ± 0.4 | 3.8 ± 1.2 | -58% |
| Visceral adiposity/bwt, % | 1.55 ± 0.39 | 0.95 ± 0.32 | 63% |
| Triglycerides, mg/dl | 67 ± 24 | 25 ± 4 | 168% |
| Free fatty acids, mEq/l | 0.64 ± 0.22 | 0.33 ± 0.04 | 94% |
Data from ref. 14.
Values expressed in relation to body mass raised to the power of 0.75 when individuals with different body weights are compared.
Genes regulating mitochondrial biogenesis and respiration efficiency in skeletal muscle provide one mechanistic framework for likely determinants that modify aerobic capacity. Furthermore, several lines of evidence suggest that impaired mitochondrial function is linked with numerous obesity-related risk factors including intramuscular lipid accumulation and peripheral insulin resistance. We hypothesized that the LCR will have compromised mitochondrial function relative to the HCR rats. An important mediator of these processes is the transcriptional coactivator peroxisomal proliferator-activated receptor μcoactivator-1α (PGC-1α) (22). The cellular content of six proteins essential for mitochondrial biogenesis and function (1,22) was measured in soleus muscle, which is composed mainly of oxidative fibers (type 1). The content of PGC-1α, peroxisome proliferative activated receptor-gamma (PPAR-μ), ubiquinol-cytochrome c oxidoreductase core 2 subunit (UQCRC2), cytochrome c oxidase subunit I (COXI), uncoupling protein 2 (UCP2), and ATP synthase H+ transporting mitochondrial F1 complex (F1-ATP synthase) was markedly reduced in the LCR rats by comparison to the HCR (14). The decline in these proteins supports the hypothesis that reduced aerobic metabolism underlies the differences between the LCR and HCR rats. Importantly, when fed a high-fat diet (HFD) (see below), both COXI and UCP3 increase significantly more in HCR relative to LCR suggesting a possible mechanistic role in the HCR for “resistance” to poor dietary environments (23).
Aerobic Rat Models Respond Differentially to Health-Related Environments
Because of the evidence for interaction of various environments to those with genetic predisposition for complex disease, it was of great interest to know whether the LCR and HCR models respond differentially to clinically relevant changes in environment.
Positive effect of exercise training environment
For many, endurance exercise can decrease symptoms and risk factors for complex disease, especially obesity and type 2 diabetes. We have tested our models for reversal of risk factors. High intensity interval training performed at 75% relative VO2max for 6 weeks increased aerobic fitness nearly the same in HCR vs. LCR (38% and 44%, respectively) and decreased cardiovascular risk factors (14). After training the LCR values for VO2max, cardiomyocytes contractility, and calcium handling were normalized to the level of sedentary HCR (18). Studies in progress will determine if LCR rats also show significant reduction for risks of high blood pressure, visceral adiposity, insulin receptor signaling, atherosclerosis, endothelial function, and energy substrate utilization following exposure to endurance exercise training.
Negative effects of an HFD
The effects of an HFD on weight gain patterns, insulin sensitivity, and fatty acid oxidative capacity were evaluated in sedentary male LCR and HCR rats (23). Upon 3 months exposure to an HFD, LCR rats gained more weight, increased fat mass, and their insulin resistant condition was exacerbated, despite consuming similar amounts of energy as chow-fed controls. Remarkably, these metabolic variables remained unaltered in HCR rats when shifted from normal chow to HFD (Figure 2). The HFD caused a weight gain of 90 ±12 g in LCR and 24 ±6 in HCR rats. These weight gains occurred primarily within the first 4 weeks of dietary intervention. Compared to HCR, LCR rats had a greater percent body fat represented by adipose tissue after HFD. The differences in weight gain were not explained by differences in energy intake. In fact, energy consumption expressed relative to body weight was greater in HCR rats, regardless of diet.
Figure 2.
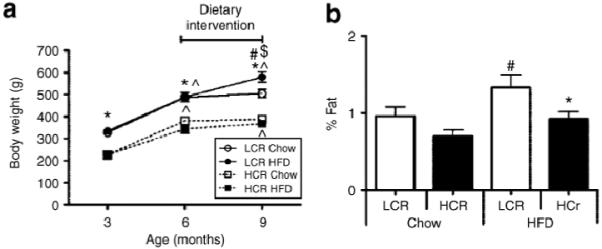
Effects of a high-fat diet (HFD) intervention in rats bred as low capacity runners (LCR) vs. high capacity runners (HCR). (a) Total body mass at baseline (3 months), before the dietary intervention (6 months), and upon death (9 months). (b) The percent fat from total body mass represented by epididymal fat pad weight obtained upon death. P < 0.05 for LCR vs. HCR within same diet category (*), for within-group weight gain from previous time point (^), for chow vs. HFD within a given strain (#), and greater weight gain in LCR rats on an HFD than any other group ($). Data are expressed as means SE. (Reproduced with permission by Noland et al. ref. 23.)
Effects of a high-fat diet (HFD) intervention in rats bred as low capacity runners (LCR) vs. high capacity runners (HCR). (a) Total body mass at baseline (3 months), before the dietary intervention (6 months), and upon death (9 months). (b) The percent fat from total body mass represented by epididymal fat pad weight obtained upon death. P < 0.05 for LCR vs. HCR within same diet category (*), for within-group weight gain from previous time point (^), for chow vs. HFD within a given strain (#), and greater weight gain in LCR rats on an HFD than any other group ($). Data are expressed as means ±SE. (Reproduced with permission by Noland et al. ref. 23.)
The effects of other environmental risk factors are in progress in the LCR/HCR rats and include: (i) response to low calorie diet, (ii) daily exposure to tobacco smoke, (iii) long-term access to voluntary wheel running, (iv) estimation of non-exercise activity thermogenesis (NEAT) (24), and (v) influence of stressful environments associated with depression and/or anxiety-like behaviors.
Summary
The LCR and HCR rats are hypothesis-based models selectively bred for intrinsic (untrained) aerobic running capacity. The LCR score high on numerous disease risks including those leading to the metabolic syndrome and the HCR score high for health factors such as maximal oxygen consumption. Importantly, the LCR also respond more to negative environmental health risks, e.g., HFD whereas the HCR show signs of resistance. Our next effort will be to interrogate mechanism at the level of gene expression and apply a multilevel bioinformatic approach to identify the molecular network of aerobic capacity and its association with disease genes. The strong linkage of high aerobic metabolism with both physical capacity and health is presumably a product of the integral role of oxygen in our evolutionary history. Even if this tight coupling of oxygen with function is correct, recognizing and interpreting this embedded pattern remains a challenge.
Acknowledgments
This work was supported by grant RR17718 from the National Center for Research Resources (NCRR), a component of the National Institutes of Health (NIH). This publication was sponsored by the National Cancer Institute (NCI) to present the talks from the “Gene-Nutrition and Gene-Physical Activity Interactions in the Etiology of Obesity” workshop held on 24-25 September 2007. The opinions or assertions contained herein are the views of the authors and are not to be considered as official or reflecting the views of the NIH.
Footnotes
Disclosure
The authors declared no conflict of interest.
References
- 1.Mootha VK, Lindgren CM, Eriksson KF, et al. PGC-1alpha-responsive genes involved in oxidative phosphorylation are coordinately downregulated in human diabetes. Nat Genet. 2003;34:267–273. doi: 10.1038/ng1180. [DOI] [PubMed] [Google Scholar]
- 2.Nadeau JH. Muta-genetics or muta-genomics: the feasibility of large-scale mutagenesis and phenotyping programs. Mamm Genom. 2000;11:603–607. doi: 10.1007/s003350010115. [DOI] [PubMed] [Google Scholar]
- 3.Akar FG, Aon MA, Tomaselli GF, O’Rourke B. The mitochondrial origin of post-ischemic arrhythmias. J Clin Invest. 2005;115:3527–3535. doi: 10.1172/JCI25371. [DOI] [PMC free article] [PubMed] [Google Scholar]
- 4.Calvano SE, Xiao W, Richards DR, et al. A network-based analysis of systemic inflammation in humans. Nature. 2005;437:1032–1037. doi: 10.1038/nature03985. [DOI] [PubMed] [Google Scholar]
- 5.Lin MT, Beal MF. Mitochondrial dysfunction and oxidative stress in neurodegenerative diseases. Nature. 2006;443:787–795. doi: 10.1038/nature05292. [DOI] [PubMed] [Google Scholar]
- 6.Matoba S, Kang JG, Patino WD, et al. p53 regulates mitochondrial respiration. Science. 2006;312:1650–1653. doi: 10.1126/science.1126863. [DOI] [PubMed] [Google Scholar]
- 7.Myers J, Prakash M, Froelicher V, Do D, Partington S, Atwood JE. Exercise capacity and mortality among men referred for exercise testing. N Engl J Med. 2002;346:793–801. doi: 10.1056/NEJMoa011858. [DOI] [PubMed] [Google Scholar]
- 8.Bouchard C, Rankinen T. Individual differences in response to regular physical activity. Med Sci Sports Exerc. 2001;33:S446–S451. doi: 10.1097/00005768-200106001-00013. [DOI] [PubMed] [Google Scholar]
- 9.Bouchard C, Rankinen T, Chagnon YC, et al. Genomic scan for maximal oxygen uptake and its response to training in the HERITAGE family study. J Appl Physiol. 2000;88:551–559. doi: 10.1152/jappl.2000.88.2.551. [DOI] [PubMed] [Google Scholar]
- 10.Koch LG, Britton SL. Artificial selection for intrinsic aerobic endurance running capacity in rats. Physiol Genomics. 2001;5:45–52. doi: 10.1152/physiolgenomics.2001.5.1.45. [DOI] [PubMed] [Google Scholar]
- 11.Hansen C, Spuhler K. Development of the National Institutes of Health genetically heterogeneous rat stock. Alcohol Clin Exp Res. 1984;8:477–479. doi: 10.1111/j.1530-0277.1984.tb05706.x. [DOI] [PubMed] [Google Scholar]
- 12.Flint J, Mott R. Finding the molecular basis of quantitative traits: successes and pitfalls. Nat Rev Genet. 2001;2:437–445. doi: 10.1038/35076585. [DOI] [PubMed] [Google Scholar]
- 13.Kimura M, Crow JF. On the maximum avoidance of inbreeding. Genet Res. 1963;4:399–415. [Google Scholar]
- 14.Wisloff U, Najjar SM, Ellingsen O, et al. Cardiovascular risk factors emerge after artificial selection for low aerobic capacity. Science. 2005;307:418. doi: 10.1126/science.1108177. [DOI] [PubMed] [Google Scholar]
- 15.Henderson KK, Wagner H, Favret F, et al. Determinants of maximal O2 uptake in rats selectively bred for endurance running capacity. J Appl Physiol. 2002;93:1265–1274. doi: 10.1152/japplphysiol.00809.2001. [DOI] [PubMed] [Google Scholar]
- 16.Howlett RA, Gonzalez NC, Wagner HE, et al. Selected contribution: skeletal muscle capillarity and enzyme activity in rats selectively bred for running endurance. J Appl Physiol. 2003;94:1682–1688. doi: 10.1152/japplphysiol.00556.2002. [DOI] [PubMed] [Google Scholar]
- 17.Gonzalez NC, Kirkton SD, Howlett RA, et al. Continued divergence in VO2max of rats artificially selected for running endurance is mediated by greater convective blood O2 delivery. J Appl Physiol. 2006;101:1288–1296. doi: 10.1152/japplphysiol.01527.2005. [DOI] [PubMed] [Google Scholar]
- 18.Hoydal MA, Wisloff U, Kemi OJ, et al. Nitric oxide synthase type-1 modulates cardiomyocyte contractility and calcium handling: association with low intrinsic aerobic capacity. Eur J Cardiovasc Prev Rehabil. 2007;14:319–325. doi: 10.1097/hjr.0b013e3280128bef. [DOI] [PubMed] [Google Scholar]
- 19.Lewington S, Clarke R, Qizilbash N, Peto R, Collins R. Age-specific relevance of usual blood pressure to vascular mortality: a meta-analysis of individual data for one million adults in 61 prospective studies. Lancet. 2002;360:1903–1913. doi: 10.1016/s0140-6736(02)11911-8. [DOI] [PubMed] [Google Scholar]
- 20.Schachinger V, Britten MB, Zeiher AM. Prognostic impact of coronary vasodilator dysfunction on adverse long-term outcome of coronary heart disease. Circulation. 2000;101:1899–1906. doi: 10.1161/01.cir.101.16.1899. [DOI] [PubMed] [Google Scholar]
- 21.Hambrecht R, Fiehn E, Weigl C, et al. Regular physical exercise corrects endothelial dysfunction and improves exercise capacity in patients with chronic heart failure. Circulation. 1998;98:2709–2715. doi: 10.1161/01.cir.98.24.2709. [DOI] [PubMed] [Google Scholar]
- 22.Puigserver P, Spiegelman BM. Peroxisome proliferator-activated receptor-gamma coactivator 1 alpha (PGC-1 alpha): transcriptional coactivator and metabolic regulator. Endocr Rev. 2003;24:78–90. doi: 10.1210/er.2002-0012. [DOI] [PubMed] [Google Scholar]
- 23.Noland RC, Thyfault JP, Henes ST, et al. Artificial selection for high capacity endurance running is protective against high fat diet-induced insulin resistance. Am J Physiol Endocrinol Metab. 2007;293:E31–E41. doi: 10.1152/ajpendo.00500.2006. [DOI] [PubMed] [Google Scholar]
- 24.Levine JA, Lanningham-Foster LM, McCrady SK, et al. Interindividual variation in posture allocation: possible role in human obesity. Science. 2005;307:584–586. doi: 10.1126/science.1106561. [DOI] [PubMed] [Google Scholar]