

Abstract
Background & Aims
Optical coherence tomography (OCT) is an optical technique that produces high-resolution images of the esophagus during endoscopy. OCT can distinguish specialized intestinal metaplasia (SIM) from squamous mucosa, but image criteria for differentiating intramucosal carcinoma (IMC) and high-grade dysplasia (HGD) from low-grade dysplasia (LGD), indeterminate-grade dysplasia (IGD), and SIM without dysplasia have not been validated. The purpose of this study was to establish OCT image characteristics of IMC and HGD in Barrett's esophagus.
Methods
Biopsy-correlated OCT images were acquired from patients with Barrett's esophagus undergoing endoscopic surveillance. Two pathologists rendered consensus diagnoses of the biopsy specimens. A blinded investigator reviewed the biopsy-correlated OCT images and scored each for surface maturation and gland architecture. For each image the scores were summed to determine an OCT “dysplasia index.”
Results
A total of 177 biopsy-correlated images were analyzed. The corresponding histopathology diagnosis was IMC/HGD in 49 cases, LGD in 15, IGD in 8, SIM in 100, and gastric mucosa in 5. A significant relationship was found between a histopathologic diagnosis of IMC/HGD and scores for each image feature (dysplasia index [Spearman correlation coefficient, r = 0.50, P < .0001], surface maturation [r = 0.48, P < .0001], and gland architecture [r = 0.41, P < .0001]). When a dysplasia index threshold of ≥2 was used, the sensitivity and specificity for diagnosing IMC/HGD were 83% and 75%, respectively.
Conclusions
An OCT image scoring system based on histopathologic characteristics has the potential to identify IMC and HGD in Barrett's esophagus.
During the past 30 years, the incidence of esophageal adenocarcinoma has increased faster than any other solid organ malignancy in Western countries.1–3 Barrett's esophagus (BE) is the major risk factor for the development of esophageal adenocarcinoma, and gastroesophageal reflux disease is a significant risk factor for the development of BE as well as esophageal adenocarcinoma.4 For patients with known BE, periodic endoscopic surveillance to detect intramucosal carcinoma (IMC) and high-grade dysplasia (HGD) (IMC/HGD) is usually recommended. This recommendation stems from observations noting the high incidence (25% during a period of 46 months) of adenocarcinoma in patients with IMC/HGD.5 Current guidelines for surveillance of IMC/HGD include 4-quadrant biopsies every 2 cm along the axial length of the Barrett's segment.6 However, the accuracy of surveillance endoscopy is limited by sampling error.7–9 Debate continues regarding the optimal surveillance strategy for BE, but many analyses have identified surveillance frequency and the cost of endoscopy as key determinants of cost-effectiveness.10–13 Because of the increasing prevalence of gastroesophageal reflux disease and esophageal adenocarcinoma and the medical community's increasing recognition of BE as a risk factor for esophageal cancer, the use of endoscopy as a surveillance strategy for BE will increase significantly in the near future. Such increases will incur significant costs to the health care system and to the individual patient. Surveillance strategies to lower cost are being examined and include new endoscopic technologies such as narrow band imaging, chromoendoscopy, and fluorescence endoscopy. Methods for directing biopsies to regions of the esophagus containing dysplastic tissue might improve the effectiveness and efficiency of surveillance in patients with BE by increasing surveillance intervals, enabling minimally invasive surgical techniques at an earlier stage of disease progression, or preventing unnecessary interventional procedures.
Optical coherence tomography (OCT) is an optical imaging modality that uses near-infrared light to produce high-resolution (10-μm axial resolution) cross-sectional images of gastrointestinal mucosa during routine endoscopy.14–16 Images are constructed on the basis of light reflectivity, and OCT can readily identify structures on a microscopic scale including mucosal layers, “pit and gland” morphology, and glandular structure.14–16 Specialized intestinal metaplasia (SIM) can be reliably distinguished from squamous mucosa by OCT,14 but image criteria to differentiate dysplastic from metaplastic tissue in the esophagus have not been studied.
Histopathologic standards for grading and characterizing HGD in BE have been established. The important features are (1) lack of epithelial surface maturation in comparison with underlying glands, (2) gland architecture disarray, and (3) cytologic atypia.17,18 OCT characterization of SIM epithelial surface maturation and glandular architecture is possible with the 10-μm resolution currently provided by this technology. The aim of this study was to determine the relationship between epithelial surface maturation and gland architecture as assessed by OCT and a histopathologic diagnosis of IMC/HGD in subjects with BE.
Methods and Materials
The study was a blinded trial. Recruited subjects were patients with BE undergoing routine endoscopic surveillance or confirmatory biopsies for IMC or HGD. OCT images of Barrett's epithelium were obtained during endoscopy. Biopsy-correlated OCT images of the esophagus were viewed and scored by a reader blinded to the tissue diagnosis. For each image the scores for surface maturation and gland architecture were summed to establish a “dysplasia index.” Two pathologists independently reviewed each biopsy specimen and rendered a consensus diagnosis.
Optical Coherence Tomography System
The OCT device used in this study has been described previously.14,19 The light source center wavelength was 1300 nm, and the optical power incident on the tissue was 5.0 mW. The spectral bandwidth of the source was 70 nm, providing an axial resolution of 10 μm. The outside diameter of the OCT catheter was 2.5 mm. Images were acquired in a linear plane along the longitudinal axis with dimensions of 5.5 mm (1000 pixels) in length and 2.5 mm (500 pixels) in depth. During image acquisition, frames were recorded at a rate of 2 per second and numbered sequentially for reference. A visible laser beam coincident with the imaging beam allowed the endoscopist to localize the site of mucosa undergoing image acquisition, facilitating biopsy correlation of the imaged site.
Endoscopy and Subject Recruitment
The protocol was reviewed and approved by the Institutional Review Board at Massachusetts General Hospital. Informed consent was obtained before the subject's procedure. Patients with BE undergoing surveillance endoscopy and subjects with known diagnoses of HGD or IMC being evaluated for photodynamic therapy between December 1998–March 2004 were recruited. Subjects were excluded if they had previously undergone photodynamic therapy, argon plasma coagulation, endoscopic mucosal resection, or other forms of local tissue destruction to the esophagus within 3 months of the endoscopy, or if they had erosive esophagitis noted during endoscopy. Subjects received routine conscious sedation and oropharyngeal anesthesia. Standard endoscopes (either Pentax Model EG 3470K or Model EG3830TK; Pentax Medical, Tokyo, Japan) with a 3.8-mm instrument channel were used.
Optical Coherence Tomography Imaging
After adequate sedation and oropharyngeal anesthesia, upper endoscopy was performed in the standard manner. After the endoscopist identified the gastroesophageal junction and Barrett's segment, an OCT catheter probe was introduced through the instrument channel of the endoscope and positioned in gentle contact with the Barrett's mucosa. OCT images were acquired and recorded at the mucosal site as indicated by the aiming beam. OCT frames corresponding to the imaged site were documented. One jumbo biopsy (Boston Scientific, Natick, MA; 3.3-mm diameter biopsy forceps) was performed at each imaged site. The esophagus was imaged by OCT and biopsied in a retrograde fashion, typically starting at the gastroesophageal junction. To ensure adequate tissue contact between the imaging probe and the mucosa, any blood, mucus, or other foreign material was endoscopically lavaged with water before imaging. Biopsies were obtained by following the “Seattle protocol.” Images were captured from 3 of the 4 quadrant biopsies at each 2-cm interval along the length of the Barrett's segment.
Histopathology
The biopsy specimens were placed in 10% formalin, embedded in paraffin, processed routinely, and stained with hematoxylin-eosin. Two pathologists (G.Y.L. and M.M.K.), blinded to the OCT data, independently reviewed the slides and rendered a diagnosis of IMC/HGD, indeterminate-grade dysplasia (IGD), LGD, SIM, or gastric mucosa. Because of the well-recognized difficulty in differentiating HGD from IMC,20 the 2 categories were combined into a single histopathologic diagnosis. For cases in which the 2 pathologists disagreed, a consensus diagnosis was obtained. The consensus diagnosis was used as the gold standard to which the OCT results were compared.
Description of Image Scoring System
Surface maturation definition
OCT measures the intensity of light reflected from within a sample. Samples having a higher heterogeneity of optical index of refraction exhibit stronger optical scattering and therefore a stronger OCT signal. Previous studies examining the optical properties of human tissue have shown that the refractive index of chromatin is significantly different from that of the cytoplasm.21 These data suggest that the OCT signal will increase with increasing nuclear size and density. Histologically, surface maturation is characterized in part by a decrease in the nuclear to cytoplasmic ratio of the surface epithelium. Thus, it was hypothesized that incomplete surface maturation, indicative of dysplasia or regenerative changes, would be seen as a high surface OCT signal compared with the subsurface signal.
Gland architecture definition
Glands within OCT images are identified as linear structures with alternating low OCT signal (cytoplasm) and high signal (nuclei and lamina propria). Dilated glands are seen as poorly scattering voids within the mucosa. Gland irregularity by OCT might be characterized by irregular size, shape, and distribution of these architectural structures.
Optical coherence tomography scoring system
OCT images were stripped of identifying information and randomized into a data pool of images. One investigator (G.J.T.), blinded to the histopathologic diagnoses, reviewed and scored each OCT image in the following categories: (1) surface maturation: 0, surface OCT signal weaker than subsurface OCT signal; 1, surface OCT signal equivalent to subsurface OCT signal; 2, surface OCT signal stronger than subsurface OCT signal; and (2) gland architecture: 0, no irregularity, normal-appearing glandular architecture; minimal number of smooth dilated glands; 1, mild irregularity, glands were smaller and more densely packed or large and irregularly shaped; dilated glands were more frequent and closely spaced; 2, moderate/severe irregularity, glands were branching and budding; dilated glands were highly asymmetric or contained debris within the gland lumen.
For each image, the surface maturation and gland architecture scores were summed to establish a dysplasia index.
Statistical Analyses
A Spearman correlation coefficient (r) was calculated to compare scores of each OCT-determined histopathologic feature (surface maturation, gland architecture, and dysplasia index) with a diagnosis of IMC/HGD. The sensitivity and specificity of the dysplasia index for the diagnosis of IMC/HGD were calculated. All analyses used SAS software (Statistical Analysis System; SAS Institute Inc, Cary, NC) version 8.0. A P value ≤.05 was considered statistically significant for a two-sided test.
Results
The data set contained 242 biopsy-correlated images from 55 patients. Table 1 describes demographic information of the subjects whose biopsy-correlated images were included in the study. Before statistical analysis, 65 images were removed from analysis because of technical problems or inadequate image quality. Of the 177 remaining images, 49 corresponded to a diagnosis of IMC/HGD, 15 to LGD, 8 to IGD, 100 to SIM, and 5 to gastric mucosa. Of the 65 discarded images, 20 corresponded to a diagnosis of IMC/HGD, 13 LGD, 2 IGD, 29 SIM, and 1 gastric mucosa. The agreement between pathologists' diagnoses of IMC/HGD was excellent (κ = 0.89). Table 2 summarizes the distribution of histologic diagnoses comprising the data set and displays the average OCT scores of surface maturation, gland architecture, and dysplasia index.
Table 1.
Subject Demographics
| Age (y) | |
| Mean | 68.8 |
| Range | 35–86 |
| Sex | |
| Male | 44 |
| Female | 11 |
| Length of BE (cm) (mean ± standard deviation) | 5.7 ± 3.5 |
| Number of biopsy-correlated images per subject | |
| Mean | 6.5 |
| Range | 1–19 |
Table 2.
Mean OCT Scores by Histopathology
| Histopathology diagnosis | No. in data set | Mean scores of image feature as determined by OCT | ||
|---|---|---|---|---|
| Surface maturation | Gland architecture | Dysplasia index | ||
| IMC/HGD | 49 | 1.31 | 1.14 | 2.45 |
| LGD | 15 | 0.73 | 0.87 | 1.60 |
| IGD | 8 | 0.63 | 0.75 | 1.38 |
| SIM | 100 | 0.34 | 0.43 | 0.77 |
| Gastric | 5 | 0.00 | 0.20 | 0.20 |
| Total | 177 | |||
Distinguishing Intramucosal Carcinoma/High-Grade Dysplasia From All Other Tissue Types (Low-Grade Dysplasia, Indeterminant-Grade Dysplasia, Specialized Intestinal Mucosa, and Gastric Mucosa)
Figure 1 displays examples of OCT images of SIM and IMC/HGD. SIM is characterized by a lower surface epithelial intensity than subsurface intensity, representing good surface maturation (Figure 1A and B). Glands in SIM are regularly distributed and linear. For IMC/HGD, glands are irregularly shaped (Figure 1C and D), and the surface intensity is greater than the subsurface intensity (Figure 1D and E), representing poor surface maturation.
Figure 1.
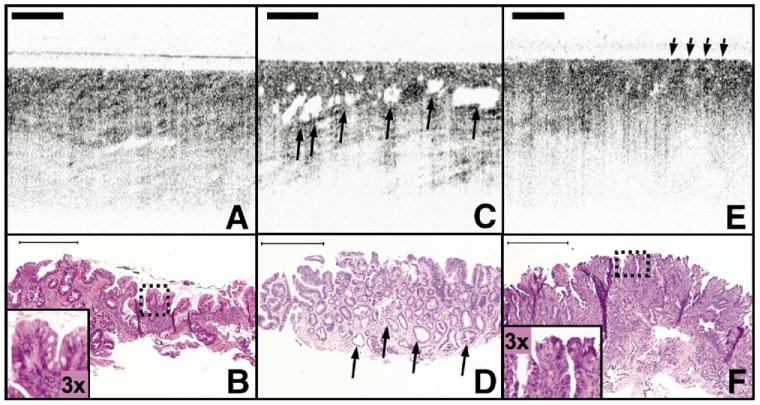
OCT images of SIM with and without IMC/HGD. (A) OCT image of SIM without dysplasia demonstrates glandular architecture with a relatively low reflectivity. (B) Corresponding histology to (A) with inset demonstrates a low nuclear to cytoplasm ratio in the superficial epithelium. (C) OCT image of IMC/HGD enables visualization of large and irregular glands (arrows). (D) Irregular, dilated glands are also seen in the corresponding histology to (C) (arrows). (E) OCT image of IMC/HGD shows a disorganized architecture and increased surface reflectivity (arrows). (F) Corresponding histology for (E) demonstrates abnormal glandular architecture and an increased superficial nuclear to cytoplasm ratio (inset). Histology: hematoxylin-eosin; original magnification, 40 ×. Scale bars, 500 μm.
Table 3 demonstrates the Spearman correlation coefficients between each OCT image feature and a diagnosis of IMC/HGD. There was a positive correlation between each feature and a diagnosis of IMC/HGD (surface maturation [r = 0.49, P < .0001], gland architecture [r = .41, P < .0001], and dysplasia index [r = 0.50, P < .0001]). Of the 3 features, the dysplasia index correlated most highly with IMC/HGD.
Table 3.
Correlation Between OCT Scores and Histology (Spearman Correlation Coefficient, r)
| Diagnosis | OCT determined histologic feature | |||
|---|---|---|---|---|
| Surface maturation | Gland architecture | Dysplasia index | ||
| IMC/HGD vs LGD, IGD, SIM | r | 0.48 | 0.41 | 0.50 |
| P | <.0001 | <.0001 | <.0001 | |
A dysplasia index score ≥2 was 83.3% (95% confidence interval, 70%–93%) sensitive and 75.0% (95% confidence interval, 68%–84%) specific for a diagnosis of IMC/HGD (Table 4).
Table 4.
Truth Table for a Diagnosis of IMC/HGD by Using OCT Dysplasia Index
| Dysplasia index | Sensitivity (%) | Specificity (%) |
|---|---|---|
| ≥1 | 88 | 49 |
| ≥2 | 83 | 75 |
| ≥3 | 63 | 87 |
| =4 | 13 | 97 |
NOTE. Truth refers to consensus histopathologic diagnosis of IMC/HGD by the pathologists.
Discussion
This study demonstrates that OCT can be used to assess esophageal epithelial surface maturation and gland architecture to accurately diagnose IMC and HGD in patients with BE. This study defines OCT image criteria for dysplasia and systematically assesses the accuracy of endoscopic OCT to identify dysplastic tissue in subjects with BE. Although each of the OCT image features correlated positively with a diagnosis of IMC/HGD, the dysplasia index most accurately diagnosed IMC/HGD.
Histopathology is considered the gold standard for tissue diagnosis but is known to be imperfect. For a histopathologic diagnosis of IMC/HGD in BE, intraobserver and interobserver agreement is only moderately good (κ = 0.65 and 0.43, respectively).18 Thus, this difficulty in rendering a diagnosis of HGD must be taken into account when comparing the results of a noninvasive optical test with the gold standard of histopathology. In our study, all biopsy specimens were independently reviewed by 2 pathologists, and a consensus opinion was rendered in those cases in which there was initial diagnostic disagreement. The interobserver agreement in this study was excellent (κ = 0.89) and provides confidence in the results because the histopathologic diagnoses were rendered with consistency. Great care was taken to coordinate our OCT imaging sites with the biopsy locations. However, the precision of our registration method is on the order of several millimeters, and because IMC/HGD can be a focal process,22,23 it is possible that some of the misdiagnoses by OCT were due to poor registration of imaging and biopsy sites.
Many of the subjects in this study were undergoing endoscopy before consideration of photodynamic therapy or other therapy and therefore had known diagnoses of IMC/HGD. This accounts for the high prevalence of IMC/HGD in our study sample compared with the general population of patients with BE undergoing surveillance. Because IMC and HGD require similar management strategies and because the histopathologic distinction between the 2 diagnoses can be problematic,20 IMC diagnoses in this study were combined with HGD cases into one group representing advanced dysplasia.5 A subgroup analysis of OCT features of IMC and HGD was not conducted because of the small numbers involved. Further study examining OCT features of HGD versus those of IMC within a larger sample set might be warranted.
The investigator who analyzed the OCT images (G.J.T.) is trained in histopathology and has extensive experience with OCT imaging. This familiarity and expertise were necessary to apply the histopathology criteria to OCT images in this research setting but might have resulted in greater agreement between OCT and histopathology than would be obtained by a reader with less experience. No studies have addressed the interobserver agreement of OCT diagnoses in esophageal imaging, and it has not been established whether these results can be replicated in a general population of potential OCT image readers. Thus, although this proof of principle study suggests that histopathologic criteria can be used to grade dysplasia in OCT images of BE with good accuracy, our results require further investigation and replication on a broader scale. Furthermore, it might be possible in the future for computer software algorithms to be developed to render these diagnoses in a consistent and objective manner.
Approximately 27% of the 242 images were discarded as a result of inadequate image quality. Of these discarded images, 30% corresponded to a diagnosis of IMC/HGD. This proportion is similar to the proportion of IMC/HGD images reviewed (27%). Therefore, images of IMC/HGD were not disproportionately removed from the data set.
Pfau et al24 demonstrated the diagnostic potential of real-time visual assessment of OCT light reflectivity in colon tubular adenomas as a model of dysplasia. Our study provides further evidence that OCT imaging can accurately identify epithelial dysplasia in the lumen of the gastrointestinal tract. In addition, our results compare favorably to other imaging modalities in the detection of IMC/HGD in BE,25–27 but the method differs in that our approach uses accepted histopathologic diagnostic criteria. Although the current resolution of OCT does not allow direct discrimination of cellular and nuclear features associated with dysplasia, architectural abnormalities are also associated with progression of this disease. Our results indicate that identification of these architectural changes, which are well within the resolution of current OCT technology, can provide accurate discrimination of IMC/HGD in esophageal specialized intestinal metaplasia.
OCT technology is advancing rapidly. Some currently available OCT systems include Doppler and birefringence-sensitive imaging,28 which might provide additional contrast for improved diagnoses of IMC/HGD. Higher resolution OCT systems have also been demonstrated.29 However, before OCT can be used as a routine surveillance modality in BE, the system to deliver the OCT catheter to the esophageal lining will need to be simple, comfortable to the patient, and applicable in a large population. If the results of this study can be confirmed in a controlled, prospective analysis and combined with technologic improvements to make the device more user and patient friendly, OCT has the potential to improve the surveillance of BE.
Acknowledgments
Supported in part by the National Institutes of Health (NIH R01 CA 103769-03) and the Center for the Integration of Medicine and Innovative Technology (development of the imaging platform).
The authors thank William Puricelli, RN, for assistance in conducting the study.
Abbreviations used in this paper
- BE
Barrett's esophagus
- HGD
high-grade dysplasia
- IGD
indeterminate-grade dysplasia
- IMC
intramucosal carcinoma
- LGD
low-grade dysplasia
- OCT
optical coherence tomography
- SIM
specialized intestinal metaplasia
References
- 1.Blot WJ, Devesa SS, Kneller RW, et al. Rising incidence of adenocarcinoma of the esophagus and gastric cardia. JAMA. 1991;265:1287–1289. [PubMed] [Google Scholar]
- 2.Bytzer P, Christensen PB, Damkier P, et al. Adenocarcinoma of the esophagus and Barrett's esophagus: a population-based study. Am J Gastroenterol. 1999;94:86–91. doi: 10.1111/j.1572-0241.1999.00776.x. [DOI] [PubMed] [Google Scholar]
- 3.Devesa SS, Blot WJ, Fraumeni JF., Jr Changing patterns in the incidence of esophageal and gastric carcinoma in the United States. Cancer. 1998;83:2049–2053. [PubMed] [Google Scholar]
- 4.Lagergren J, Bergstrom R, Lindgren A, et al. Symptomatic gastroesophageal reflux as a risk factor for esophageal adenocarcinoma. N Engl J Med. 1999;340:825–831. doi: 10.1056/NEJM199903183401101. [DOI] [PubMed] [Google Scholar]
- 5.Sharma P, McQuaid K, Dent J, et al. A critical review of the diagnosis and management of Barrett's esophagus: the AGA Chicago Workshop. Gastroenterology. 2004;127:310–330. doi: 10.1053/j.gastro.2004.04.010. [DOI] [PubMed] [Google Scholar]
- 6.Levine DS, Haggitt RC, Blount PL, et al. An endoscopic biopsy protocol can differentiate high-grade dysplasia from early adenocarcinoma in Barrett's esophagus. Gastroenterology. 1993;105:40–50. doi: 10.1016/0016-5085(93)90008-z. [DOI] [PubMed] [Google Scholar]
- 7.Dulai GS. Surveying the case for surveillance. Gastroenterology. 2002;122:820–823. doi: 10.1053/gast.2002.32093. [DOI] [PubMed] [Google Scholar]
- 8.Falk GW, Chittajallu R, Goldblum JR, et al. Surveillance of patients with Barrett's esophagus for dysplasia and cancer with balloon cytology. Gastroenterology. 1997;112:1787–1797. doi: 10.1053/gast.1997.v112.pm9178668. [DOI] [PubMed] [Google Scholar]
- 9.Streitz JM, Andrews CW, Ellis FH. Endoscopic surveillance of Barrett's esophagus: does it help? J Thorac Cardiovasc Surg. 1993;105:383–388. [PubMed] [Google Scholar]
- 10.van Sandick JW, van Lanschot JJ, Kuiken BW, et al. Impact of endoscopic biopsy surveillance of Barrett's oesophagus on pathological stage and clinical outcome of Barrett's carcinoma. Gut. 1998;43:216–222. doi: 10.1136/gut.43.2.216. [DOI] [PMC free article] [PubMed] [Google Scholar]
- 11.Inadomi JM, Sampliner R, Lagergren J, et al. Screening and surveillance for Barrett esophagus in high-risk groups: a cost-utility analysis. Ann Intern Med. 2003;138:176–186. doi: 10.7326/0003-4819-138-3-200302040-00009. [DOI] [PubMed] [Google Scholar]
- 12.Provenzale D, Schmitt C, Wong JB. Barrett's esophagus: a new look at surveillance based on emerging estimates of cancer risk. Am J Gastroenterol. 1999;94:2043–2053. doi: 10.1111/j.1572-0241.1999.01276.x. [DOI] [PubMed] [Google Scholar]
- 13.Sonnenberg A, Soni A, Sampliner RE. Medical decision analysis of endoscopic surveillance of Barrett's oesophagus to prevent oesophageal adenocarcinoma. Aliment Pharmacol Ther. 2002;16:41–50. doi: 10.1046/j.1365-2036.2002.01146.x. [DOI] [PubMed] [Google Scholar]
- 14.Poneros JM, Brand S, Bouma BE, et al. Diagnosis of specialized intestinal metaplasia by optical coherence tomography. Gastroenterology. 2001;120:7–12. doi: 10.1053/gast.2001.20911. [DOI] [PubMed] [Google Scholar]
- 15.Sivak MV, Jr, Kobayashi K, Izatt JA, et al. High-resolution endoscopic imaging of the GI tract using optical coherence tomography. Gastrointest Endosc. 2000;51(Pt 1):474–479. doi: 10.1016/s0016-5107(00)70450-0. [DOI] [PubMed] [Google Scholar]
- 16.Brand S, Poneros JM, Bouma BE, et al. Optical coherence tomography in the gastrointestinal tract. Endoscopy. 2000;32:796–803. doi: 10.1055/s-2000-7714. [DOI] [PubMed] [Google Scholar]
- 17.Reid BJ, Haggitt RC, Rubin CE, et al. Observer variation in the diagnosis of dysplasia in Barrett's esophagus. Hum Pathol. 1988;19:166–178. doi: 10.1016/s0046-8177(88)80344-7. [DOI] [PubMed] [Google Scholar]
- 18.Montgomery E, Bronner MP, Goldblum JR, et al. Reproducibility of the diagnosis of dysplasia in Barrett esophagus: a reaffirmation. Hum Pathol. 2001;32:368–378. doi: 10.1053/hupa.2001.23510. [DOI] [PubMed] [Google Scholar]
- 19.Poneros JM, Tearney GJ, Shiskov M, et al. Optical coherence tomography of the biliary tree during ERCP. Gastrointest Endosc. 2002;55:84–88. doi: 10.1067/mge.2002.120098. [DOI] [PubMed] [Google Scholar]
- 20.Ormsby AH, Petras RE, Henricks WH, et al. Observer variation in the diagnosis of superficial oesophageal adenocarcinoma. Gut. 2002;51:671–676. doi: 10.1136/gut.51.5.671. [DOI] [PMC free article] [PubMed] [Google Scholar]
- 21.Drezek R, Guillaud M, Collier T, et al. Light scattering from cervical cells throughout neoplastic progression: influence of nuclear morphology, DNA content, and chromatin texture. J Biomed Opt. 2003;8:7–16. doi: 10.1117/1.1528950. [DOI] [PubMed] [Google Scholar]
- 22.Cameron AJ, Souto EO, Smyrk TC. Small adenocarcinomas of the esophagogastric junction: association with intestinal metaplasia and dysplasia. Am J Gastroenterol. 2002;97:1375–1380. doi: 10.1111/j.1572-0241.2002.05669.x. [DOI] [PubMed] [Google Scholar]
- 23.Cameron AJ, Carpenter HA. Barrett's esophagus, high-grade dysplasia, and early adenocarcinoma: a pathological study. Am J Gastroenterol. 1997;92:586–591. [PubMed] [Google Scholar]
- 24.Pfau PR, Sivak MV, Jr, Chak A, et al. Criteria for the diagnosis of dysplasia by endoscopic optical coherence tomography. Gastrointest Endosc. 2003;58:196–202. doi: 10.1067/mge.2003.344. [DOI] [PubMed] [Google Scholar]
- 25.Ragunath K, Krasner N, Raman VS, et al. A randomized, prospective cross-over trial comparing methylene blue-directed biopsy and conventional random biopsy for detecting intestinal metaplasia and dysplasia in Barrett's esophagus. Endoscopy. 2003;35:998–1003. doi: 10.1055/s-2003-44599. [DOI] [PubMed] [Google Scholar]
- 26.Egger K, Werner M, Meining A, et al. Biopsy surveillance is still necessary in patients with Barrett's oesophagus despite new endoscopic imaging techniques. Gut. 2003;52:18–23. doi: 10.1136/gut.52.1.18. [DOI] [PMC free article] [PubMed] [Google Scholar]
- 27.Wallace MB, Perelman LT, Beckman V, et al. Endoscopic detection of dysplasia in patients with Barrett's esophagus using light-scattering spectroscopy. Gastroenterology. 2000;119:677–682. doi: 10.1053/gast.2000.16511. [DOI] [PubMed] [Google Scholar]
- 28.Pierce MC, Strasswimmer J, Park BH, et al. Advances in optical coherence tomography imaging for dermatology. J Invest Dermatol. 2004;123:458–463. doi: 10.1111/j.0022-202X.2004.23404.x. [DOI] [PubMed] [Google Scholar]
- 29.Herz PR, Chen Y, Aguirre AD, et al. Micromotor endoscope catheter for in vivo, ultrahigh-resolution optical coherence tomography. Opt Lett. 2004;29:2261–2263. doi: 10.1364/ol.29.002261. [DOI] [PubMed] [Google Scholar]