

Abstract
Calcium depletion of the endoplasmic reticulum (ER) induces oligomerisation, puncta formation and translocation of the ER Ca2+ sensor proteins, STIM1 and −2 into plasma membrane (PM)-adjacent regions of the ER, where they activate the Orai1, −2 or −3 proteins present in the opposing PM. These proteins form ion channels through which store-operated Ca2+ influx (SOC) occurs. Calcium ions exert negative feed-back on SOC. Here we examined whether subplasmalemmal mitochondria, which reduce this feed-back by Ca2+ uptake, are located within or out of the high-Ca2+ microdomains (HCMDs) formed between the ER and plasmalemmal Orai1 channels. For this purpose, COS-7 cells were co-transfected with Orai1, STIM1 labelled with YFP or mRFP and the mitochondrially targeted Ca2+ sensitive fluorescent protein inverse Pericam. Depletion of ER Ca2+ with ATP + thapsigargin (in Ca2+-free medium) induced the appearance of STIM1 puncta in the ≤100 nm wide subplasmalemmal space, as examined with TIRF. Mitochondria were located either in the gaps between STIM1-tagged puncta or in remote, STIM1-free regions. After addition of Ca2+ mitochondrial Ca2+ concentration increased irrespective of the mitochondrion-STIM1 distance. These observations indicate that mitochondria are exposed to Ca2+ diffused laterally from the HCMDs formed between the PM and the subplasmalemmal ER.
Keywords: mitochondria, calcium, store-operated calcium entry, STIM1
Introduction
Inositol 1,4,5-trisphosphate-induced Ca2+ depletion of the ER induces Ca2+ influx from the extracellular space, a process originally termed as ‘capacitative Ca2+ influx’ [1]. This form of Ca2+ entry, presently more often referred to as store-operated Ca2+ influx (SOC) can also be induced by thapsigargin (Tg) [2] and other inhibitors of SERCA, the Ca. ATPase of the ER. The molecular basis of SOC has recently been unveiled by the discovery of two sets of proteins: STIM1 and −2, the Ca2+-sensor membrane proteins of the ER [3–5] and Orai1, −2 and −3, plasma membrane (PM) proteins forming Ca2+-selective channels [6–8]. Although additional channels may also be regulated by STIM proteins and contribute to SOC [9–11], STIM1 and Orai1 are necessary and sufficient components of the SOC mechanism in most cell types, including COS-7 cells examined in the present study. Upon depletion of ER luminal Ca2+, STIM1 undergoes sequential oligomerisation with ensuing formation of clusters and translocation into PM-adjacent regions within the ER [3,5,12–14]. The STIM1 clusters in the ER induce multimerization of the plasmalemmal Orai1 molecules where the two molecules colocalise [14–17] allowing a dramatic increase in SOC [18,19].
The role of mitochondria in the control of SOC has been suggested by several observations. Since elevation of cytosolic [Ca2+] ([Ca2+]c) exerts negative feed-back on SOC [20], Ca2+ sequestration by mitochondria will reduce this inhibition [21–23]. This action of mitochondria requires an energized state but does not involve changes in intracellular ATP, indicating that it may be accounted for by Ca2+ uptake [24]. Indeed, SOC is more active in the vicinity of than far from subplasmalemmal mitochondria [25]. Also, sustained activity of SOC channels may require the translocation of mitochondria into subplasmalemmal regions [26].
Mitochondrial Ca2+ uptake occurs via the Ruthenium Red-sensitive Ca2+ uniporter, a highly selective inwardly rectifying channel that displays low affinity for Ca2+ [27]. However, mitochondrial Ca2+ sequestration does occur despite the low Ca2+ affinity of the uniporter during stimulation with a Ca2+ mobilising agonist. This is because of the rapidly forming but short-lived high-Ca2+ microdomains (HCMDs) between the mouth of IP3 receptor-channels and closely apposed mitochondria [28,29]. Mitochondrial Ca2+ uptake during voltage-operated Ca2+ influx has also been accounted for by the formation of HCMDs between the cytosolic mouth of the plasmalemmal channel and the apposing mitochondria [30–33]. However, the formation of such HCMDs may not be an absolute requirement for mitochondrial Ca2+ uptake during SOC. Observations in glomerulosa, luteal, HeLa and H295R cells suggest that SOC may be followed by mitochondrial Ca2+ uptake without the need for HCMD [34–38]. Therefore we examined whether subplasmalemmal mitochondria are in a location where SOC-induced HCMDs may be formed.
Methods
Cells
COS-7 cells were cultured on glass coverslips and transfected for 24 h with 0.5–0.5 μg plasmid DNA of Orai1 and mRFP-STIM1 and 1 μg mitochondrially-targeted inverse Pericam (i-Pericam) [39] per dish (~ 105 cells), using Lipofectamine 2000. Orai1 and STIM1 plasmids transcription was driven by the thymidine kinase (TK) promoter of the herpes simplex virus as described [14].
Confocal laser scanning microscopy
Confocal analysis was performed at 35°C in a modified Krebs-Ringer buffer containing (in mM): 120 NaCl, 4.7 KCl, 1.2 CaCl2, 0.7 MgSO4, 10 glucose, 10 sodium Hepes, pH 7.4, using a Zeiss LSM 510-META scanning confocal microscope and a 63x/1.4 objective. The optical slice was set at 1.5 μm. Data were acquired in multitrack mode with scanning in the frame mode using the 488 and 543 nm lasers and BP 505–545 and LP560 emission filters for YFP or mt-i-Pericam and Rhod-2 or mRFP, respectively.
Total internal reflection fluorescent microscopy (TIRF)
TIRF analysis was performed at room temperature in an Olympus through the lens dual launch TIRF microscope system equipped with a Hammamatsu EM-CCD camera and a PlanApo 60x/1.45 objective. 488 or 568 nm lasers and 535/40 and 645/75 emission filters were used for the mt-i-Pericam and mRFP, respectively. The Openlab Software (Improvision) was used for data acquisition, and the pictures were exported as TIFF files for processing with the Metamorph software (Molecular Devices). In some cases, the microscopic images were deconvoluted using a plugin (Iterative Deconvolve 3D) of ImageJ 1.37a.
Statistics
Statistical data are expressed as means ± S.E.M. For the evaluation of co-localisation of STIM1 puncta and subplasmalemmal mitochondria Pearson’s coefficient [40] was calculated after thresholding, applying a plugin of ImageJ 1.37a which excludes zero-zero pixels (Intensity Correlation Analysis). For curve fitting in Fig. 3 the spline/Lowess function of the Prism software was applied. Initial rate of Ca2+ -induced decrease in i-Pericam fluorescence in mitochondria close to or far from STIM1-labelled ER was compared with ANOVA.
Fig. 3.

TIRF analysis (performed at room temperature) of COS-7 cells expressing mRFP-STIM1, untagged Orai1 and inverse-Pericam-targeted to the mitochondrial matrix. (A) This recording (representative for 5 cells) was started after treatment of cells with ATP + Tg in Ca2+ -free medium (~ 9 min). The punctate appearance of STIM1 (upper row) shows that STIM1 is already translocated to the peripheral parts of the ER. Mitochondrial fluorescence (middle row) is high at this point as Ca2+ influx cannot take place in the absence of external Ca2+ (left pictures). Ca2+ uptake was induced with the addition of 2 mM Ca2+, and mitochondrial Ca2+ uptake is indicated by the decreased fluorescence intensity of the mitochondrially targeted inverse Pericam (middle and right pictures of the middle row). The bar shows 10 μm (B) Quantitative analysis of fluorescence changes during the time-course of this recording. Red and green traces show changes in the i-Pericam fluorescence intensity in selected mitochondria close to (contacting) or far (more than 10 pixels distance) from mRFP-STIM1 fluorescence. The data points for each ROI were expressed as per cent of max-min values and these values were averaged (means ± S.E.M., n= 4). The enlarged image shows an example for a close (yellow arrow) or far (white arrow) mitochondrion relative to active STIM1 areas.
Results and Discussion
In order to enhance the active sites of SOC in COS-7 cells, Orai-1 and fluorescent protein-tagged STIM1 proteins were co-expressed. To achieve only moderate levels of expression, these constructs were driven by the thymidine kinase (TK) promoter [14]. The ER Ca2+ store was rapidly depleted by the addition of 50 μM ATP and 200 nM Tg to stimulate the endogenous metabotropic P2Y receptors and inhibit the SERCA Ca2+ pump, respectively. Ca2+ responses of the transfected cells in the cytosol and mitochondria were followed by confocal microscopy in regions of interest (ROIs) over the nucleus and over mitochondria, respectively, using the Ca2+ sensitive fluorescent dye Rhod-2. The rate and extent of the translocation of STIM1 towards the cell periphery was estimated off-line by measuring YFP fluorescence in ROIs over the perinuclear ER and puncta-rich periphery, respectively. As shown in Fig. 1, addition of ATP + Tg in the presence of external Ca2+, induced a rapid increase in [Ca2+]c that was associated with a moderate rise in mitochondrial [Ca2+] ([Ca2+]m). This reflected the rapid Ca2+ release from the ER. However, a second phase of the Ca2+ response was observed with a slight delay, which was much more pronounced in the mitochondria than in the cytosol (note the different scales of cytosolic and mitochondrial Rhod-2 signals on the y axes in Fig. 1B !). The onset of this secondary Ca2+ rise coincided with the translocation of STIM1 from the ER to the cell periphery and was, therefore, attributed to massive Ca2+ influx via the expressed Orai1 channels. Based on these data it may be assumed that mitochondria are capable of a significant sequestration of the inflowing Ca2+ and to some extent may protect the cytosol from very large [Ca2+]i increases.
Fig. 1.

Confocal image of a Rhod-2 loaded COS-7 cell transfected with TK-YFP-STIM1 and untagged Orai1. (A) Upper row: control, lower row: 5 min after the addition 50 μM ATP and 200 nM Tg in normal Ca2+ containing medium. Note the large increase in Rhod-2 fluorescence (left panels) and the formation of STIM1 puncta in the cell periphery (middle panels). The bar shows 10 μm (B): Quantitation of fluorescence changes during the whole time-course of this experiment. Cytoplasmic [Ca2+] (cyto, blue trace) was measured with Rhod-2 fluorescence monitored over the nuclear area (blue circle). Mitochondrial [Ca2+] (red traces) was measured with Rhod-2 at two selected areas over mitochondria (red circles). STIM1 translocation was indicated either by the decreased YFP-STIM1 fluorescence in two central ER areas (green circles) of the cell (green traces) or by the increased average fluorescence of several puncta at the peripheral region of the cell (selected areas too small to show in the picture) (black trace). All fluorescence intensities were normalized to 0 sec. The dotted line shows the assumed onset of SOC (cf. [14]). Note the two-phased increase in mitochondrial [Ca2+], a small increase associated with the rapid Ca2+ release from the ER and a slightly delayed massive Ca2+ uptake corresponding to the large SOC due to STIM1/Orai1 expression. The latter coincides with STIM1 translocation to the cell periphery.
In subsequent experiments the effects of Ca2+ depletion of the ER and increased Ca2+ influx on [Ca2+]m were studied with confocal- and TIRF microscopy, in order to determine whether the mitochondrial responses were dependent on the localization of the mitochondrion relative to that of STIM1. For this, cells were cotransfected with mRFP-STIM1 and a mitochondrially targeted inverse Pericam (i-Pericam) (Fig. 2). i-Pericam is a Ca2+ sensitive protein displaying high fluorescence intensity at low [Ca2+]m [39]. The application of i-Pericam was preferred over that of Rhod-2 because of its better suitability to detect mitochondria at low [Ca2+]m which was critical in subsequent TIRF experiments. In the resting state, mRFP-STIM1 showed its usual ER localization with some association with microtubules as described in several previous studies [41,42]. The mitochondria could easily be detected due to their high fluorescence at to low [Ca2+]m. Ca2+ depletion of the ER was induced with ATP + Tg in a Ca2+-free medium (containing 100 μM EGTA). Within 2 minutes of drug application, mRFP fluorescence became highly punctated indicating the formation of STIM1 clusters and enrichment in close proximity to the PM (Fig. 2A). Ca2+ influx was then initiated by the addition of 2 mM Ca2+ to the medium so that the effect of Ca2+ influx could be studied without Ca2+ release from the ER Ca2+ stores. Within 10 s after the addition of Ca2+, i-Pericam fluorescence rapidly decreased reflecting the SOC-evoked increase in [Ca2+]m (Fig. 2B). These experiments showed that i-Pericam is capable of reporting the rapid Ca2+ rise in the mitochondria associated with Ca2+ influx.
Fig. 2.

Confocal image of a COS-7 cell expressing mRFP-STIM1, untagged Orai1 and inverse-Pericam-targeted to the mitochondrial matrix. (A) Upper row: control, middle row: 2 min after stimulation with 50 μM ATP and 200 nM Tg in Ca2+-free medium (note the formation of STIM1 puncta on the left panels), lower row: 2 min after the addition of 2 mM Ca2+ (note the disappearance of i-Pericam fluorescence). The bar shows 10 μm (B) The lower panel shows the rapid fall of mitochondrially targeted i-Pericam (i.e. the increase in [Ca2+]m) in 3 separate mitochondrial ROIs in response to readdition of Ca2+. (Performed at 35 C.)
Next, the position of the mitochondria relative to the STIM1 puncta within the ≤100 nm wide subplasmalemmal space was examined with TIRF microscopy. After ER Ca2+ depletion by the addition of ATP + Tg (in a Ca2+-free medium containing 100 μM EGTA), mRFP-STIM1 puncta were detectable at the vicinity of the PM, and a few mitochondria showing i-Pericam fluorescence could also be located in this space. Importantly, the PM-close mitochondria showed no preferential localization close to the STIM1 puncta, but were found either in between the STIM1 patches or further away, in STIM1-free regions (Fig. 3A). Very few mitochondria could be detected contacting or at least partially overlapping with red fluorescing (mRFP) pixels. This was clearly demonstrable in pixel intensity profiles where pixels with high intensities in both green and red channels were very rarely detected. Colocalisation was also statistically estimated. Pearson’s coefficient which may change between +1 (colocalisation) and −1 (exclusion), was −0.750 ± 0.105 (means ± S.E.M.) in the original images and −0.912 ± 0.026 after deconvolution (n=5), confirming the lack of colocalisation of mRFP and i-Pericam.
Since Ca2+ influx probably saturates i-Pericam [39] the amplitude of mitochondrial Ca2+ response could not be accurately measured. Therefore we compared the initial rate of the fall of dye fluorescence (expressed as ΔF/Fo per second where Fo is F before adding Ca2+) in mitochondria far from ER (i.e. more than 10 pixels distance between the two organelles) and those close to ER. There was no statistical difference in the rates estimated for 12 far and 12 close mitochondria (selected in 3 cells) (p = 0.125). Similarly, no difference was observed when fluorescence intensities were expressed as per cent of max-min values (Fig. 3B). (These experiments were performed at room temperature to allow detection of small differences, therefore the Ca2+ response of mitochondria was somewhat slower than observed at 35 C.)
The relationship between mRFP-STIM1 and i-Pericam in ER-Ca2+-depleted cells was further evaluated with scatter plots. In Ca2+ depleted cells high i-Pericam fluorescence values (requiring good i-Pericam expression and low [Ca2+]m) were found in the low range of STIM1 fluorescence. Following readdition of Ca2+ the green fluorescence intensities of these pixels was drastically reduced, indicating that these pixels corresponded to functioning mitochondria capable of Ca2+ uptake (Fig. 4). The prominent fall of i-Pericam fluorescence across the spectrum of pixels with red fluorescence upon the induction of Ca2+ also confirmed the conclusion that mitochondria show equally good Ca2+ responses whether located in between STIM1 puncta or in remote, STIM1-free regions.
Fig. 4.
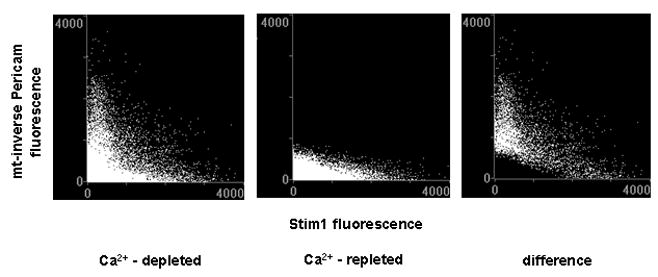
Scatter plot showing the fluorescence intensity of mitochondrially targeted i-Pericam (Y axis) as a function of the fluorescence intensity of STIM1-mRFP (X axis) in the cell shown in Fig. 3. Left panel: 9 min after Ca2+ depletion induced with ATP + Tg, middle panel: 1 min after the addition 2 mM Ca2+, right panel: pixels disappeared after the addition of Ca2+ (the middle scatter plot subtracted from the left one).
Collectively, these results did not indicate the existence of preferential spatial positioning of mitochondria close to the STIM1/Orai1 formed Ca2+ entry sites. HCMDs is spatially and temporally defined local elevations of [Ca2+]c around the mouth of a Ca2+ release channel or a plasmalemmal Ca2+ channel. Its formation is allowed by a low diffusion rate of Ca2+ (due to immobile cytosolic Ca2+ buffers) and facilitated by a physical barrier for diffusion, the subplasmalemmal ER sites containing STIM1 puncta in our case. This way SOC-related HCMDs theoretically could be formed between Orai1 clusters and the apposing ER membrane rich in STIM1 puncta. Given the limited distance between the STIM1-labelled ER membrane and the Orai1 in the apposing PM, which was estimated to be in the range of 10–25 nm [14,43], this space is too narrow to accommodate a mitochondrion. Therefore, mitochondria may be exposed to Ca2+ diffusing only laterally from the HCMDs during SOC. This means that subplasmalemmal mitochondria are exposed to Ca2+ at concentrations probably exceeding that of the global cytosolic [Ca2+] increase. The nearer they are to the HCMDs formed around the orifice of Orai channels the higher [Ca2+] they are exposed to, but at least in non-excitable cells, even this local [Ca2+] may not attain the high values found in HCMDs close to the ER Ca2+ release sites. Whereas the estimated subplasmalemmal [Ca2+] values ranged between 20 and 300 μM in various excitable cells [44–47] subplasmalemmal [Ca2+] amounted to only ~1.6 μM in the non-excitable endothelial cells [25]. Therefore in non-excitable cells the cell-type specific threshold of mitochondrial Ca2+ uptake (cf. [48]) rather than the position relative to the SOC site may determine to what an extent mitochondria can modify subplasmalemmal [Ca2+]c during SOC.
Acknowledgments
Mt-inverse Pericam was kindly gifted by Prof. A. Miyawaki (Saitama, Japan). The confocal imaging was performed at the Microscopy & Imaging Core of the National Institute of Child Health and Human Development, NIH with the kind assistance of Drs. Vincent Schram and James T. Russell. This research was supported in part by the Intramural Research Program of the National Institute of Child Health and Human Development of the National Institutes of Health.
Footnotes
Publisher's Disclaimer: This is a PDF file of an unedited manuscript that has been accepted for publication. As a service to our customers we are providing this early version of the manuscript. The manuscript will undergo copyediting, typesetting, and review of the resulting proof before it is published in its final citable form. Please note that during the production process errors may be discovered which could affect the content, and all legal disclaimers that apply to the journal pertain.
References
- 1.Putney JW., Jr A model for receptor-regulated calcium entry. Cell Calcium. 1986;7:1–12. doi: 10.1016/0143-4160(86)90026-6. [DOI] [PubMed] [Google Scholar]
- 2.Takemura H, Hughes AR, Thastrup O, Putney JW., Jr Activation of calcium entry by the tumor promoter thapsigargin in parotid acinar cells. J Biol Chem. 1989;264:12266–12271. [PubMed] [Google Scholar]
- 3.Liou J, Kim ML, Heo WD, et al. STIM is a Ca2+ sensor essential for Ca2+-store-depletion-triggered Ca2+ influx. Curr Biol. 2005;15:1235–1241. doi: 10.1016/j.cub.2005.05.055. [DOI] [PMC free article] [PubMed] [Google Scholar]
- 4.Roos J, DiGregorio PJ, Yeromin AV, et al. STIM1, an essential and conserved component of store-operated Ca2+ channel function. J Cell Biol. 2005;169:435–445. doi: 10.1083/jcb.200502019. [DOI] [PMC free article] [PubMed] [Google Scholar]
- 5.Zhang SL, Yu Y, Roos J, et al. STIM1 is a Ca2+ sensor that activates CRAC channels and migrates from the Ca2+ store to the plasma membrane. Nature. 2005;437:902–905. doi: 10.1038/nature04147. [DOI] [PMC free article] [PubMed] [Google Scholar]
- 6.Feske S, Gwack Y, Prakriya M, et al. A mutation in Orai1 causes immune deficiency by abrogating CRAC channel function. Nature. 2006;441:179–185. doi: 10.1038/nature04702. [DOI] [PubMed] [Google Scholar]
- 7.Yeromin AV, Zhang SL, Jiang W, Yu Y, Safrina O, Cahalan MD. Molecular identification of the CRAC channel by altered ion selectivity in a mutant of Orai. Nature. 2006;443:226–229. doi: 10.1038/nature05108. [DOI] [PMC free article] [PubMed] [Google Scholar]
- 8.Zhang SL, Yeromin AV, Zhang XH, et al. Genome-wide RNAi screen of Ca2+ influx identifies genes that regulate Ca2+ release-activated Ca2+ channel activity. Proc Natl Acad Sci U S A. 2006;103:9357–9362. doi: 10.1073/pnas.0603161103. [DOI] [PMC free article] [PubMed] [Google Scholar]
- 9.Philipp S, Trost C, Warnat J, et al. TRP4 (CCE1) protein is part of native calcium release-activated Ca2+- like channels in adrenal cells. J Biol Chem. 2000;275:23965–23972. doi: 10.1074/jbc.M003408200. [DOI] [PubMed] [Google Scholar]
- 10.Yuan JP, Zeng W, Huang GN, Worley PF, Muallem S. STIM1 heteromultimerizes TRPC channels to determine their function as store-operated channels. Nat Cell Biol. 2007;9:636–645. doi: 10.1038/ncb1590. [DOI] [PMC free article] [PubMed] [Google Scholar]
- 11.Alicia S, Angelica Z, Carlos S, Alfonso S, Vaca L. STIM1 converts TRPC1 from a receptor-operated to a store-operated channel: moving TRPC1 in and out of lipid rafts. Cell Calcium. 2008;44:479–491. doi: 10.1016/j.ceca.2008.03.001. [DOI] [PubMed] [Google Scholar]
- 12.Liou J, Fivaz M, Inoue T, Meyer T. Live-cell imaging reveals sequential oligomerization and local plasma membrane targeting of stromal interaction molecule 1 after Ca2+ store depletion. Proc Natl Acad Sci U S A. 2007;104:9301–9306. doi: 10.1073/pnas.0702866104. [DOI] [PMC free article] [PubMed] [Google Scholar]
- 13.Luik RM, Wang B, Prakriya M, Wu MM, Lewis RS. Oligomerization of STIM1 couples ER calcium depletion to CRAC channel activation. Nature. 2008;454:538–542. doi: 10.1038/nature07065. [DOI] [PMC free article] [PubMed] [Google Scholar]
- 14.Várnai P, Tóth B, Tóth DJ, Hunyady L, Balla T. Visualization and manipulation of plasma membrane-endoplasmic reticulum contact sites indicates the presence of additional molecular components within the STIM1-Orai1 Complex. J Biol Chem. 2007;282:29678–29690. doi: 10.1074/jbc.M704339200. [DOI] [PubMed] [Google Scholar]
- 15.Luik RM, Wu MM, Buchanan J, Lewis RS. The elementary unit of store-operated Ca2+ entry: local activation of CRAC channels by STIM1 at ER-plasma membrane junctions. J Cell Biol. 2006;174:815–825. doi: 10.1083/jcb.200604015. [DOI] [PMC free article] [PubMed] [Google Scholar]
- 16.Xu P, Lu J, Li Z, Yu X, Chen L, Xu T. Aggregation of STIM1 underneath the plasma membrane induces clustering of Orai1. Biochem Biophys Res Commun. 2006;350:969–976. doi: 10.1016/j.bbrc.2006.09.134. [DOI] [PubMed] [Google Scholar]
- 17.Penna A, Demuro A, Yeromin AV, et al. The CRAC channel consists of a tetramer formed by Stim-induced dimerization of Orai dimers. Nature. 2008;456:116–120. doi: 10.1038/nature07338. [DOI] [PMC free article] [PubMed] [Google Scholar]
- 18.Mercer JC, Dehaven WI, Smyth JT, et al. Large store-operated calcium-selective currents due to co-expression of Orai1 or Orai2 with the intracellular calcium sensor, Stim1. J Biol Chem. 2006;281:24979. doi: 10.1074/jbc.M604589200. [DOI] [PMC free article] [PubMed] [Google Scholar]
- 19.Peinelt C, Vig M, Koomoa DL, et al. Amplification of CRAC current by STIM1 and CRACM1 (Orai1) Nat Cell Biol. 2006;8:771–773. doi: 10.1038/ncb1435. [DOI] [PMC free article] [PubMed] [Google Scholar]
- 20.Parekh AB. Slow feedback inhibition of calcium release-activated calcium current by calcium entry. J Biol Chem. 1998;273:14925–14932. doi: 10.1074/jbc.273.24.14925. [DOI] [PubMed] [Google Scholar]
- 21.Hoth M, Fanger CM, Lewis RS. Mitochondrial regulation of store-operated calcium signaling in T lymphocytes. J Cell Biol. 1997;137:633–648. doi: 10.1083/jcb.137.3.633. [DOI] [PMC free article] [PubMed] [Google Scholar]
- 22.Gilabert JA, Bakowski D, Parekh AB. Energized mitochondria increase the dynamic range over which inositol 1,4,5-trisphosphate activates store-operated calcium influx. EMBO J. 2001;20:2672–2679. doi: 10.1093/emboj/20.11.2672. [DOI] [PMC free article] [PubMed] [Google Scholar]
- 23.Malli R, Frieden M, Osibow K, et al. Sustained Ca2+ transfer across mitochondria is essential for mitochondrial Ca2+ buffering, sore-operated Ca2+ entry, and Ca2+ store refilling. J Biol Chem. 2003;278:44769–44779. doi: 10.1074/jbc.M302511200. [DOI] [PubMed] [Google Scholar]
- 24.Glitsch MD, Bakowski D, Parekh AB. Store-operated Ca2+ entry depends on mitochondrial Ca2+ uptake. Embo J. 2002;21:6744–6754. doi: 10.1093/emboj/cdf675. [DOI] [PMC free article] [PubMed] [Google Scholar]
- 25.Malli R, Frieden M, Osibow K, Graier WF. Mitochondria efficiently buffer subplasmalemmal Ca2+ elevation during agonist stimulation. J Biol Chem. 2003;278:10807–10815. doi: 10.1074/jbc.M212971200. [DOI] [PubMed] [Google Scholar]
- 26.Quintana A, Schwarz EC, Schwindling C, Lipp P, Kaestner L, Hoth M. Sustained activity of calcium release-activated calcium channels requires translocation of mitochondria to the plasma membrane. J Biol Chem. 2006;281:40302–40309. doi: 10.1074/jbc.M607896200. [DOI] [PubMed] [Google Scholar]
- 27.Kirichok Y, Krapivinsky G, Clapham DE. The mitochondrial calcium uniporter is a highly selective ion channel. Nature. 2004;427:360–364. doi: 10.1038/nature02246. [DOI] [PubMed] [Google Scholar]
- 28.Rizzuto R, Brini M, Murgia M, Pozzan T. Microdomains with high Ca2+ close to IP3-sensitive channels that are sensed by neighboring mitochondria. Science. 1993;262:744–747. doi: 10.1126/science.8235595. [DOI] [PubMed] [Google Scholar]
- 29.Moreau B, Nelson C, Parekh AB. Biphasic regulation of mitochondrial Ca2+ uptake by cytosolic Ca2+ concentration. Curr Biol. 2006;16:1672–1677. doi: 10.1016/j.cub.2006.06.059. [DOI] [PubMed] [Google Scholar]
- 30.Rutter GA, Theler JM, Murgia M, Wollheim CB, Pozzan T, Rizzuto R. Stimulated Ca2+ influx raises mitochondrial free Ca2+ to supramicromolar levels in a pancreatic b-cell line. Possible role in glucose and agonist-induced insulin secretion. J Biol Chem. 1993;268:22385–22390. [PubMed] [Google Scholar]
- 31.Kennedy ED, Rizzuto R, Theler JM, et al. Glucose-stimulated insulin secretion correlates with changes in mitochondrial and cytosolic Ca2+ in aequorin-expressing INS-1 cells. J Clin Invest. 1996;98:2524–2538. doi: 10.1172/JCI119071. [DOI] [PMC free article] [PubMed] [Google Scholar]
- 32.Pivovarova NB, Hongpaisan J, Andrews SB, Friel DD. Depolarization-induced mitochondrial Ca accumulation in sympathetic neurons: Spatial and temporal characteristics. J Neurosci. 1999;19:6372–6384. doi: 10.1523/JNEUROSCI.19-15-06372.1999. [DOI] [PMC free article] [PubMed] [Google Scholar]
- 33.Alonso MT, Villalobos C, Chamero P, Alvarez J, Garcia-Sancho J. Calcium microdomains in mitochondria and nucleus. Cell Calcium. 2006;40:513–525. doi: 10.1016/j.ceca.2006.08.013. [DOI] [PubMed] [Google Scholar]
- 34.Rohács T, Tory K, Dobos A, Spät A. Intracellular calcium release is more efficient than calcium influx in stimulating mitochondrial NAD(P)H formation in adrenal glomerulosa cells. Biochemical Journal. 1997;328:525–528. doi: 10.1042/bj3280525. [DOI] [PMC free article] [PubMed] [Google Scholar]
- 35.Collins TJ, Lipp P, Berridge MJ, Bootman MD. Mitochondrial Ca2+ uptake depends on the spatial and temporal profile of cytosolic Ca2+ signals. J Biol Chem. 2001;276:26411–26420. doi: 10.1074/jbc.M101101200. [DOI] [PubMed] [Google Scholar]
- 36.Szabadkai G, Pitter JG, Spät A. Cytoplasmic Ca2+ at low submicromolar concentration stimulates mitochondrial metabolism in rat luteal cells. Pflügers Arch. 2001;441:678–685. doi: 10.1007/s004240000466. [DOI] [PubMed] [Google Scholar]
- 37.Pitter JG, Maechler P, Wollheim CB, Spät A. Mitochondria respond to Ca2+ already in the submicromolar range: correlation with redox state. Cell Calcium. 2002;31:97–104. doi: 10.1054/ceca.2001.0264. [DOI] [PubMed] [Google Scholar]
- 38.Szanda G, Koncz P, Várnai P, Spät A. Mitochondrial Ca2+ uptake with and without the formation of high-Ca2+ microdomains. Cell Calcium. 2006;40:527–538. doi: 10.1016/j.ceca.2006.08.019. [DOI] [PubMed] [Google Scholar]
- 39.Nagai T, Sawano A, Park ES, Miyawaki A. Circularly permuted green fluorescent proteins engineered to sense Ca2+ Proc Natl Acad Sci. 2001;98:3197–3202. doi: 10.1073/pnas.051636098. [DOI] [PMC free article] [PubMed] [Google Scholar]
- 40.Bolte S, Cordelieres FP. A guided tour into subcellular colocalization analysis in light microscopy. J Microsc. 2006;224:213–232. doi: 10.1111/j.1365-2818.2006.01706.x. [DOI] [PubMed] [Google Scholar]
- 41.Smyth JT, Dehaven WI, Bird GS, Putney JW., Jr Role of the microtubule cytoskeleton in the function of the store-operated Ca2+ channel activator STIM1. J Cell Sci. 2007;120:3762–3771. doi: 10.1242/jcs.015735. [DOI] [PMC free article] [PubMed] [Google Scholar]
- 42.Grigoriev I, Gouveia SM, van der Vaart B, et al. STIM1 Is a MT-Plus-End-Tracking Protein Involved in Remodeling of the ER. Curr Biol. 2008;18:177–182. doi: 10.1016/j.cub.2007.12.050. [DOI] [PMC free article] [PubMed] [Google Scholar]
- 43.Wu MM, Buchanan J, Luik RM, Lewis RS. Ca2+ store depletion causes STIM1 to accumulate in ER regions closely associated with the plasma membrane. J Cell Biol. 2006;174:803–813. doi: 10.1083/jcb.200604014. [DOI] [PMC free article] [PubMed] [Google Scholar]
- 44.Llinas R, Sugimori M, Silver RB. Microdomains of high calcium concentration in a presynaptic terminal. Science. 1992;256:677–679. doi: 10.1126/science.1350109. [DOI] [PubMed] [Google Scholar]
- 45.Heidelberger R, Heinemann C, Neher E, Matthews G. Calcium dependence of the rate of exocytosis in a synaptic terminal. Nature. 1994;371:513–515. doi: 10.1038/371513a0. [DOI] [PubMed] [Google Scholar]
- 46.Marsault R, Murgia M, Pozzan T, Rizzuto R. Domains of high Ca2+ beneath the plasma membrane of living A7r5 cells. EMBO J. 1997;16:1575–1581. doi: 10.1093/emboj/16.7.1575. [DOI] [PMC free article] [PubMed] [Google Scholar]
- 47.Montero M, Alonso MT, Carnicero E, et al. Chromaffin-cell stimulation triggers fast millimolar mitochondrial Ca2+ transients that modulate secretion. Nat Cell Biol. 2000;2:57–61. doi: 10.1038/35000001. [DOI] [PubMed] [Google Scholar]
- 48.Spät A, Szanda G, Csordás G, Hajnóczky G. High- and low-calcium-dependent mechanisms of mitochondrial calcium signalling. Cell Calcium. 2008;44:51–63. doi: 10.1016/j.ceca.2007.11.015. [DOI] [PMC free article] [PubMed] [Google Scholar]