Abstract
Cultured hippocampal neurons expressing mitochondrially targeted enhanced yellow fluorescent protein (mito-eYFP) were used to quantitatively examine mitochondrial remodeling in response to excitotoxic glutamate. Mitochondrial morphology was evaluated using laser spinning-disk confocal microscopy followed by calibrated image processing and 3D image rendering. Glutamate triggered an increase in cytosolic Ca2+ and mitochondrial depolarization accompanied by Ca2+-dependent morphological transformation of neuronal mitochondria from “thread-like” to rounded structures. The quantitative analysis of the mitochondrial remodeling revealed that exposure to glutamate resulted in a decrease in mitochondrial volume and surface area concurrent with an increase in sphericity of the organelles. NIM811, an inhibitor of the mitochondrial permeability transition, attenuated the glutamate-induced sustained increase in cytosolic Ca2+ and suppressed mitochondrial remodeling in the majority of affected neurons, but it did not rescue mitochondrial membrane potential. Shortening, fragmentation, and formation of circular mitochondria with decreased volume and surface area accompanied mitochondrial depolarization with FCCP. However, FCCP-induced morphological alterations appeared to be distinctly different from mitochondrial remodeling caused by glutamate. Moreover, FCCP prevented glutamate-induced mitochondrial remodeling suggesting an important role of Ca2+ influx into mitochondria in the morphological alterations. Consistent with this, in saponin-permeabilized neurons, Ca2+ caused mitochondrial remodeling which could be prevented by Ru360.
Keywords: neuron, glutamate, calcium, mitochondria, permeability transition, confocal microscopy
1. Introduction
Mitochondria are dynamic structures with vast capabilities for morphological transformations [1–3]. Different stimuli cause significant mitochondrial remodeling [4–7] which can modulate the activity of key mitochondrial enzymes and thus may affect overall mitochondrial bioenergetics [8;9]. Hence, the morphological changes play an important role in mitochondrial functioning. The mitochondrial morphological alterations can also influence the functioning of the whole cell by impeding mitochondrial trafficking in response to emerging energetic demand [10], by modulating mitochondrial Ca2+ uptake [11], or by promoting the release of mitochondrial apoptogenic proteins such as cytochrome c [12].
Preparations of isolated mitochondria are widely used to study mitochondrial morphological changes in response to different stimuli in vitro. These morphological alterations are usually monitored by measuring light scattering of mitochondrial suspensions or by examining fixed mitochondrial preparations using transmission electron microscopy [13]. Mitochondrial morphological changes in the cell have been studied with the use of electron microscopy applied to fixed cells [7;14] and with the use of confocal fluorescence microscopy [1;6;15–17]. Recent advances in confocal microscopy and image processing as well as in the development of mitochondrially-targeted fluorescent proteins have created an excellent opportunity to investigate the dynamics of mitochondrial morphology in live cells with unprecedented resolution in a quantitative manner [5;18–20].
The concentration of glutamate, a major neurotransmitter, rises dramatically in brain following episodes of ischemia during stroke [21]. In addition to the increase in cytosolic Ca2+ ([Ca2+]c) [22], exposure of neurons to glutamate causes overt morphological changes in neuronal mitochondria [6;16;23]. The changes in mitochondrial morphology in neurons exposed to excitotoxic glutamate are usually interpreted as swelling of organelles. The swelling of organelles could lead to the rupture of the outer mitochondrial membrane (OMM) and release of mitochondrial apoptogenic proteins like cytochrome c [12], thus promoting neuronal death. Recently, Rintoul et al. reported that exposure of cultured neurons to glutamate caused a decrease in length of neuronal mitochondria [24] that could be considered an indication of a decrease in mitochondrial volume. However, in this study the authors did not quantitatively assess the changes in mitochondrial volume. Mitochondrial depolarization with FCCP neither altered mitochondrial morphology nor protected against mitochondrial remodeling triggered by glutamate [24]. In this study, the authors used cultured rat cortical neurons expressing mitochondrially-targeted enhanced yellow fluorescent protein (mito-eYFP) and a relatively low-resolution, conventional wide-field fluorescence microscopy. On the other hand, Safiulina et al. found a decrease in mitochondrial volume in response to mitochondrial depolarization in digitonin-permeabilized cultured cerebellar granule neurons [5]. The effect of glutamate was not investigated in this study, probably, because the authors used digitonin-permeabilized cells. In this study, the authors used a mitochondrial fluorescent dye, MitoTracker Green, to visualize mitochondria and a high-resolution, laser point-scanning confocal microscopy in conjunction with sophisticated image processing to allow quantitative assessments of mitochondrial dimensions.
In the present study, we used live cultured hippocampal neurons expressing mitochondrially targeted enhanced yellow fluorescent protein (mito-eYFP) to examine mitochondrial morphological changes in response to excitotoxic glutamate. We used high-resolution, laser spinning-disk confocal microscopy followed by calibrated image processing and 3D image reconstruction. We quantitatively examined morphological changes in neuronal mitochondria caused by glutamate, which also produced significant elevation in cytosolic Ca2+ ([Ca2+]c) and profound mitochondrial depolarization. We found that glutamate triggered mitochondrial remodeling which was distinctly different from morphological changes induced by mitochondrial depolarization with FCCP. The glutamate-triggered mitochondrial remodeling appeared to be dependent on mitochondrial Ca2+ uptake and linked to the mitochondrial permeability transition (mPT). Thus, for the first time we performed, with unprecedented spatial resolution, quantitative assessment of mitochondrial morphological changes in intact neurons exposed to excitotoxic glutamate, a major deleterious factor in stroke and various neurodegenerations [25;26].
2. Materials and methods
2.1. Cell culture
A primary culture of hippocampal neurons was prepared from postnatal day 1 rat pups according to IACUC approved protocols and previously published procedures [27]. For fluorescence measurements, neurons were plated on glass-bottomed Petri dishes without preplated glia as previously described [27]. For all platings, a solution of 35μg/ml uridine plus 15μg/ml 5-fluoro-2′-deoxyuridine was added 24 hours after plating to inhibit proliferation of non-neuronal cells. Cultures were maintained in a 5% CO2 atmosphere at 37°C in MEM supplemented with 10% NuSerum (BD Bioscience, Bedford, MA) and 27 mM glucose.
2.2. Calcium and mitochondrial membrane potential (Δψ) imaging
Neurons incubated in the growth medium were loaded at 37°C simultaneously with 2.6μM Fura-2FF-AM (Molecular Probes Eugene, OR) to follow changes in cytosolic Ca2+ and with 1.7μM Rhodamine 123 (Molecular Probes, Eugene, OR) to monitor changes in mitochondrial membrane potential [12]. During fluorescence measurements, neurons were incubated in the standard bath solution containing 139 mM NaCl, 3 mM KCl, 0.8 mM MgCl2, 1.8 mM CaCl2, 10 mM NaHEPES, pH 7.4, 5 mM glucose, and 65 mM sucrose. Sucrose was used to maintain osmolarity similar to that in the growth medium (340 mosm). Osmolarity of the solutions was measured with the osmometer Osmette II™ (Precision Systems Inc., Natick, MA). Fura-2FF and Rhodamine 123 fluorescence signals were followed with an inverted microscope Nikon Eclipse TE2000-S using Nikon objective Plan Fluor 20× 0.45 NA and a back-thinned EM-CCD camera Hamamatsu C9100-12 (Hamamatsu Photonic Systems, Bridgewater, NJ) controlled by Simple PCI software 6.1 (Compix Inc., Sewickley, PA). The excitation light was delivered by a Lambda-LS system (Sutter Instruments, Novato, CA). The excitation filters (340±5, 380±7, and 480±20) were controlled by a Lambda 10-2 optical filter changer (Sutter Instruments, Novato, CA). The excitation light at 480 nm was attenuated to 10% with a neutral density filter. Fluorescence was recorded through a 505 nm dichroic mirror at 535±25 nm. To minimize photobleaching and phototoxicity, the images were taken every 15 seconds during the time-course of the experiment using the minimal exposure time that provided acceptable image quality. The changes in [Ca2+]c were monitored by following F340/F380 calculated after subtracting the background from both channels. The changes in Δψ were monitored by following changes in fluorescence of Rhodamine 123 expressed as F/F0. The Rhodamine 123 fluorescence traces were constructed after subtracting background fluorescence.
2.3. Neuronal transfection
To visualize mitochondria within live cells, cultured hippocampal neurons were transfected in suspension during plating using an electroporator BTX 630 ECM (Harvard Apparatus, Holliston, MA) with a plasmid-encoding mitochondrially-targeted eYFP (mito-eYFP, generously provided by Dr. Roger Tsien, UCSD). This procedure usually provided a 10–15% transfection rate in primary cultures of rat hippocampal neurons compared to <1% efficacy with commercial cationic lipid liposomes. The transfected neurons were imaged 12–14 days after transfection.
2.4. Live-cell laser spinning-disk confocal microscopy
To collect serial images of neuronal mitochondria targeted with mito-eYFP, spinning-disk confocal microscopy was employed. For this purpose, a Nikon Eclipse TE2000-U microscope equipped with a Yokogawa spinning-disk confocal unit CSU-10, a back-thinned EM-CCD camera Andor iXonEM+ DU-897 (Andor Technology, South Windsor, CT), and a motorized flat-top stage Prior H-117 (Prior Scientific, Rockland, MA) was used. This setup was controlled by Andor iQ 1.4 software (Andor Technology, South Windsor, CT). To visualize mitochondria, neurons were illuminated at 488 nm using an air-cooled Kr/Ar laser T643-RYB-A02 (Melles Griot, Carlsbad, CA). The laser power was set to the minimal level (<5%) which was sufficient to provide excellent image quality and to prevent excessive photobleaching. Fluorescence was collected through a 505 nm dichroic mirror and a 535±25 nm emission filter using an objective Nikon CFI Plan Apo 100×1.4 NA. Serial images (z-stacks) were collected using the piezoelectric positioning device PIFOC® P-721 (Physik Instrumente, Auburn, MA) with a z-step 0.1μm. When the whole mitochondrial network within the neuronal somata was imaged, the spatial resolution of the Andor iXonEM+ DU-897 camera was increased by installing a 2× or a 4× extender lens in front of the camera. When individual mitochondria were imaged for quantitative analysis, a 4× extender lens was used in conjunction with 1.5× Optovar magnifier. 3D blind deconvolution of z-stacks and 3D rendering were performed using AutoDeblur Gold CF 1.4.1 software (MediaCybernetics, Silver Spring, MD). 3D maximal projection and 3D isosurface reconstructions of the mitochondrial network and individual mitochondria were performed with an empirically determined 33% threshold level using Imaris 5.7.0 (Bitplane Inc., Saint Paul, MN). Processing of images, 3D reconstruction, and quantification were calibrated using green fluorescent microspheres with ∅ 175±5 nm from PS-Speck™ Microscope Point Source Kit (Molecular Probes, Cat # P7220) as described previously [5] (Supplemental Fig. 1). Spherical aberration was corrected by applying an empirically determined coefficient 0.25 to z-dimension. This resulted in the best sphericity value at the end of the processing of microsphere images. 3D isosurface images generated with Imaris software allowed calculation of many different parameters of the images including volume, surface area, and sphericity of the microspheres, which were very close to predetermined values. The volume, surface area, and sphericity of the examined microspheres were found to be 0.00282±0.00064μm3, 0.0978±0.0024μm2, and 0.985±0.011 arbitrary units, respectively (N=24). The algorithm for image processing established with fluorescent microspheres was applied to z-stacks of serial images of individual mitochondria. Cultured hippocampal neurons with mitochondria visualized by mito-eYFP fluorescence are shown in Supplemental Figures 2A,B. Supplemental Figures 2C–G show separate steps in image processing following acquisition of a z-stack of serial mitochondrial images. After correction for spherical aberration, raw images were deconvolved and 3D maximal intensity projection images were generated. 3D isosurface reconstructions of individual mitochondria were performed using a 33% threshold level established in the experiments with green fluorescent microspheres. Mitochondrial surface area, volume, and sphericity were calculated based on 3D isosurface reconstructions.
2.5. Cell permeabilization
In the experiments with valinomycin, neurons were permeabilized with 1μg/ml digitonin in the “intracellular” bath solution containing 125 mM KCl, 0.5 mM MgCl2, 3 mM KH2PO4, 3 mM pyruvate, 1 mM malate, 10μM EGTA, 10 mM HEPES, and pH 7.4. Alternatively, cells were permeabilized with 25μg/ml saponin applied for 5 minutes at room temperature in the same “intracellular” bath solution except pyruvate and malate were substituted for 3 mM succinate and 3 mM glutamate.
2.6. Statistics
Each experiment was performed at least in triplicate. Statistical analysis of the experimental results consisted of a t-test or one-way ANOVA followed by Bonferroni’s post-test (GraphPad Prism® 4.0, GraphPad Software Inc., San Diego, CA).
3. Results
3.1. Exposure of neurons to excitation light does not affect mitochondrial morphology
It was previously reported that excitation light could alter the structure of mitochondria within live cultured astrocytes [28]. To test whether an exposure of neurons to excitation light could result in alterations in mitochondrial morphology in our experiments, we performed multiple acquisitions of z-stacks of serial mitochondrial images. Normal “thread-like” mitochondrial morphology easily withstands 5 z-stack acquisitions and remained essentially the same during the time-course of the experiment (Supplemental Figure 3) Mitochondrial volume, surface area, and sphericity fluctuated insignificantly over time but remained in the close range. Thus, in our experiments, multiple exposures of neurons to excitation light did not cause significant morphological alterations in neuronal mitochondria.
3.2. Valinomycin causes mitochondrial swelling in cultured neurons
As a positive control for mitochondrial swelling in situ, we used digitonin-permeabilized neurons incubated in the Ca2+-free bath solution with high K+ mimicking intracellular cation composition. These cells were treated with a low concentration of valinomycin (1 nM) to induce K+ influx into mitochondria and mitochondrial swelling. Without plasma membrane permeabilization and a replacement of the bath solution, valinomycin would cause K+ efflux from cells and mitochondria leading to mitochondrial contraction. As we expected, valinomycin produced a distinct increase in mitochondrial volume most likely due to electrophoretic K+ influx followed by osmotically obliged water (Supplemental Fig. 4). In addition, valinomycin decreased the surface area and increased the sphericity of mitochondria.
3.3. Glutamate induces mitochondrial depolarization and elevation in cytosolic Ca2+ dependent on mitochondrial permeability transition
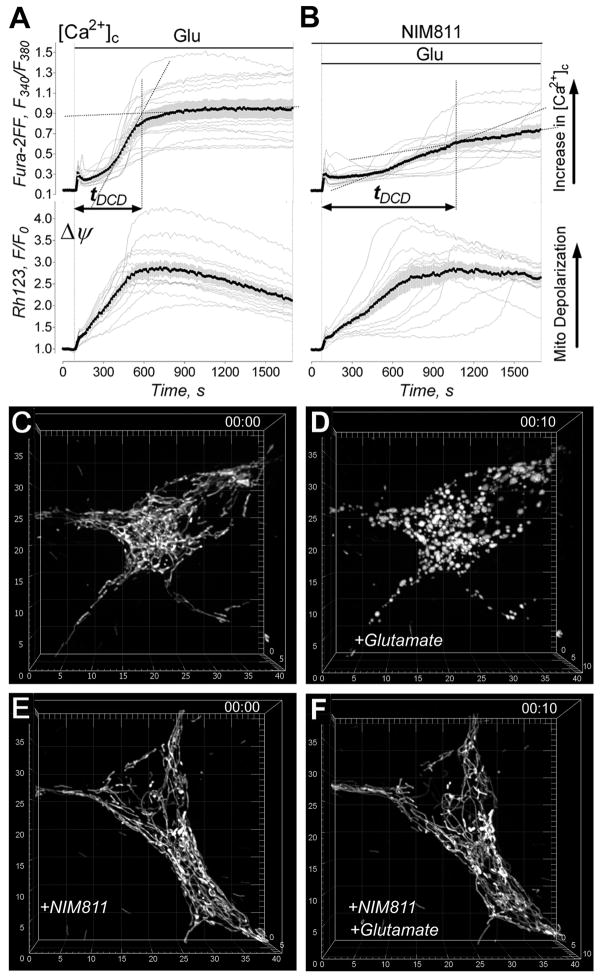
Overstimulation of glutamate receptors with excitotoxic glutamate and massive Ca2+ influx is considered to be a major cause of neuronal injury in stroke and various neurodegenerations [25;26]. Prior to evaluation of mitochondrial morphological alterations, we assessed glutamate-induced changes in cytosolic Ca2+ ([Ca2+]c) and mitochondrial membrane potential (Δψ). In our experiments, exposure of neurons to glutamate (25μM plus 10μM glycine) resulted in an elevation in [Ca2+]c and mitochondrial depolarization (Fig. 1). NIM811, a non-immunosuppressive inhibitor of the mitochondrial permeability transition (mPT) [29], attenuated the increase in [Ca2+]c but did not significantly diminish mitochondrial depolarization (Fig. 1B). To provide a statistical analysis of the Fura-2FF traces reflecting changes in [Ca2+]c, we introduced a parameter: the time from the beginning of glutamate exposure to completion of the DCD (tDCD) (Fig. 1). Recently, a similar approach was used to analyze secondary mitochondrial depolarization in cultured neurons exposed to glutamate [30]. The statistical analysis revealed that NIM811 significantly deferred the sustained increase in [Ca2+]c in cultured neurons exposed to glutamate: tDCD without NIM811 was 558±74 s while tDCD with 3μM NIM811 was 1003±112 s (mean±SEM, p<0.01, N=13). The effect of NIM811 on [Ca2+]c could be due to an inhibition of the mPT, which preserved mitochondria, promoted robust mitochondrial Ca2+ uptake, and thereby helped to maintain lower [Ca2+]c. However, continuous mitochondrial Ca2+ uptake obviously occurred at the expense of Δψ, and therefore the organelles remained depolarized.
Figure 1. Glutamate-induced changes in cytosolic Ca2+ ([Ca2+]c), mitochondrial membrane potential (Δψ) and morphology of mitochondrial network in cultured hippocampal neurons. The protective effect of NIM811.
In A and B, the individual (thin grey traces obtained from individual neurons) and average Fura-2FF (F340/F380, thick black traces) and Rhodamine 123 (Rh123, F/F0, thick black traces) fluorescence signals (total 13 separate experiments with neurons from three different platings). Neurons were treated with 25μM glutamate (plus 10μM glycine) as indicated. In B, neurons were pre-incubated for 45 minutes with 3μM NIM811. NIM811 (3μM) was also in the bath solution during the experiment. In C–F, the representative 3D maximal fluorescence intensity projection images of the mitochondrial network in live cultured hippocampal neurons (total used in the experiments - 43 different neurons, all from different dishes from 8 separate platings). In C and E, mitochondrial network within hippocampal neurons prior to addition of glutamate. In D and F, mitochondrial network in neurons exposed to 25μM glutamate plus 10μM glycine for 10 minutes. In E and F, neurons were pre-treated for 45 minutes and then incubated with 3μM NIM811 during the experiment. The scales are in μm.
3.4. Glutamate induces Ca2+-dependent contraction of neuronal mitochondria linked to the mitochondrial permeability transition
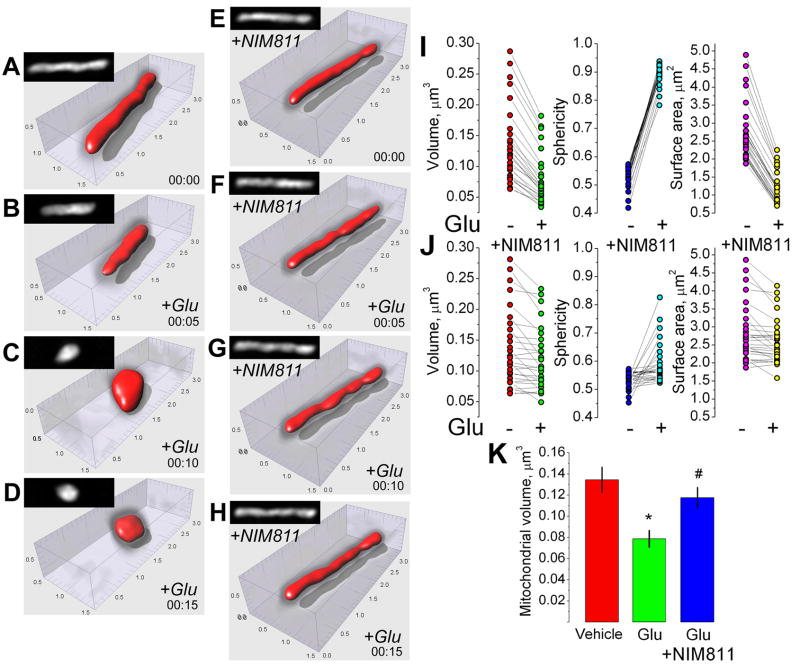
In addition to depolarization, mitochondria in neurons exposed to glutamate experienced a distinct morphological transition from “thread-like” to shortened, rounded structures in 38 out of 43 examined neurons from different dishes (Fig. 1C,D). This morphological transformation was strictly Ca2+ dependent and was not observed in the Ca2+-free bath solution (not shown). NIM811 suppressed mitochondrial remodeling in 29 out of 43 examined neurons that had been exposed to glutamate (43 different dishes from 8 separate platings) (Fig. 1E,F). In the experiments with isolated mitochondria in vitro, Ca2+ induces mitochondrial remodeling which is usually manifested by swelling of organelles [31]. Surprisingly, the quantitative morphological analysis of individual neuronal mitochondria in situ revealed a decrease in mitochondrial volume and surface area concurrent with an increase in mitochondrial sphericity (Fig. 2). The quantitative morphological analysis demonstrated that NIM811 antagonized remodeling in 15 out 26 examined individual mitochondria in 26 different neurons (all from different dishes, 5 different platings).
Figure 2. Effect of glutamate and NIM811 on morphology of individual neuronal mitochondria: volume, sphericity, and surface area.
In A–H, the representative mitochondrial images prior to (A,E) and after glutamate treatment (B–D and F–H). In E–H, neurons were pre-treated for 45 minutes and then incubated with 3μM NIM811 during the experiment. Mitochondrial remodeling was triggered by 25μM glutamate plus 10μM glycine (+Glu). In A–H, black and white insets show the maximal fluorescence intensity projection images of the corresponding mitochondria. The scales are in μm. In I and J, individual measurements made with different mitochondria in neurons exposed to 25μM glutamate (plus 10μM glycine) with and without 3μM NIM811. In K, statistical analysis of mitochondrial volume changes after glutamate treatment with and without NIM811. Data are mean±SEM, *p<0.01 comparing volume of individual mitochondria in vehicle- versus glutamate-treated neurons, #p<0.01 comparing volume of individual mitochondria treated with 25μM glutamate (plus 10μM glycine) in the presence or absence of 3μM NIM811. The overall number of individual mitochondria imaged and analyzed in these experiments was: without NIM811 -total 28 individual mitochondria, all from different neurons in 28 dishes, 6 separate platings; with NIM811 – total 26 individual mitochondria, all from different neurons in 26 dishes, 5 separate platings.
3.5. Mitochondrial depolarization without an increase in cytosolic Ca2+ results in mitochondrial morphological alterations distinctly different form glutamate triggered remodeling of organelles
In our experiments, mitochondrial remodeling occurred in parallel to an increase in [Ca2+]c and mitochondrial depolarization. Omission of Ca2+ from the bath solution prevented all three events. It seemed conceivable that either an increase in [Ca2+]c or mitochondrial depolarization or both could trigger mitochondrial remodeling in neurons exposed to glutamate. To elucidate the role of depolarization in the glutamate-triggered mitochondrial remodeling, we examined mitochondrial morphological changes induced by FCCP.
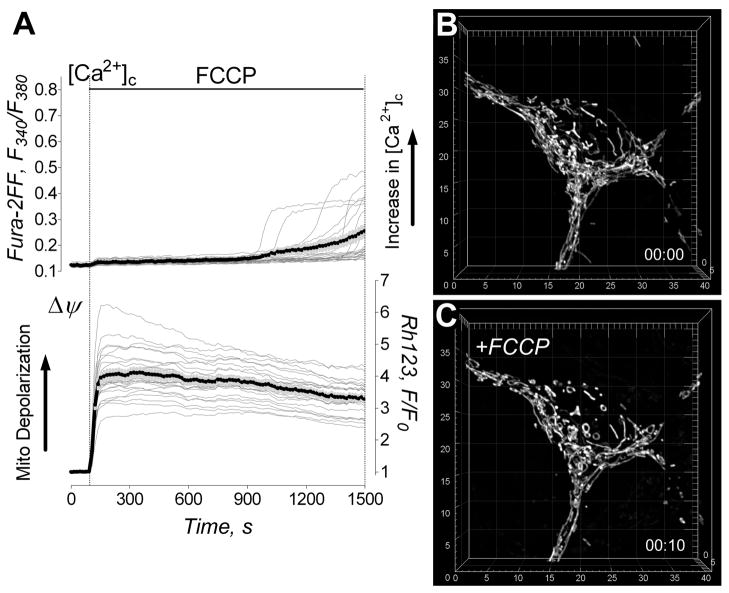
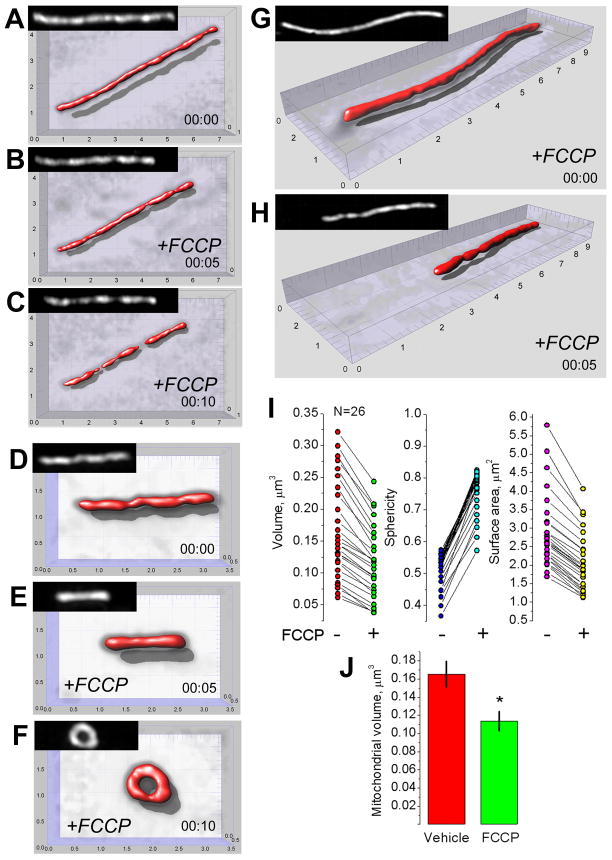
The protonophore-uncoupler FCCP (1μM) produced rapid mitochondrial depolarization without an increase in cytosolic Ca2+ (Fig. 3A). Figures 3B,C show 3D maximal fluorescence intensity projection images of the mitochondrial network in neuronal soma obtained with live, non-permeabilized cultured hippocampal neurons prior to and after treatment with 1μM FCCP. The depolarization caused various forms of morphological transformations in neuronal mitochondria. Some mitochondria experienced fission and/or dramatic shortening. Other organelles were transformed into circular structures. Finally, a fraction of mitochondria underwent only subtle morphological changes or experienced no changes at all. The morphological changes could be detected as early as one minute after FCCP addition, and they continued during the next 5–10 minutes. NIM811 did not influence these changes (not shown). The quantitative analysis of FCCP-induced remodeling was performed with individual neuronal mitochondria in different cells (Fig. 4). In our hands, mitochondrial depolarization in situ led to morphological changes that could be put into three separate categories: (i) shortening of the organelles, (ii) mitochondrial fission, and (iii) formation of circular mitochondria. In all cases, mitochondrial morphological alterations were associated with a decrease in mitochondrial volume and surface area with a concurrent increase in organelle sphericity (Fig. 4I–L). However, the alterations were distinctly different from the mitochondrial remodeling induced by glutamate (Figs. 1, 2). Thus, depolarization alone could not account for the specific type of Ca2+-dependent mitochondrial remodeling observed in the experiments with neurons exposed to glutamate.
Figure 3. Effect of FCCP on cytosolic Ca2+, Δψ and mitochondrial morphology.
In A, the effect of 1μM FCCP on cytosolic Ca2+ ([Ca2+]c) and Δψ. The representative raw (thin grey traces obtained from individual neurons) and average Fura-2FF (F340/F380, thick black traces) and Rhodamine 123 (Rh123, F/F0, thick black traces) fluorescence signals (total 7 separate experiments with neurons from three different platings). In B and C, the representative 3D maximal fluorescence intensity projection images of the mitochondrial network prior to and after FCCP treatment (13 separate experiments with neurons from four different platings). In B, mitochondrial network within a live hippocampal neuron prior to addition of FCCP. In C, mitochondrial network in the same neuron exposed to 1μM FCCP for 10 minutes. The scales are in μm.
Figure 4. Effect of FCCP-induced depolarization on morphology of individual mitochondria.
The representative mitochondrial images (A–H) and measurements from individual neuronal mitochondria (I–L) within live hippocampal neurons (26 individual mitochondria, all from different neurons form different 26 dishes, 5 separate platings) prior to and after FCCP treatment. In A–C, fragmentation of individual mitochondrion; in D–F, formation of circular mitochondrion; in G and H, mitochondrial shortening induced by 1μM FCCP. The scales are in μm. In I–K, individual measurements made with different mitochondria in neurons treated with 1μM FCCP for 10 minutes. In L, statistical analysis of mitochondrial volume changes after treatment with 1μM FCCP for 10 minutes; data are mean±SEM, *p<0.01, N=26.
3.6. Depolarization with FCCP suppresses mitochondrial remodeling triggered by glutamate
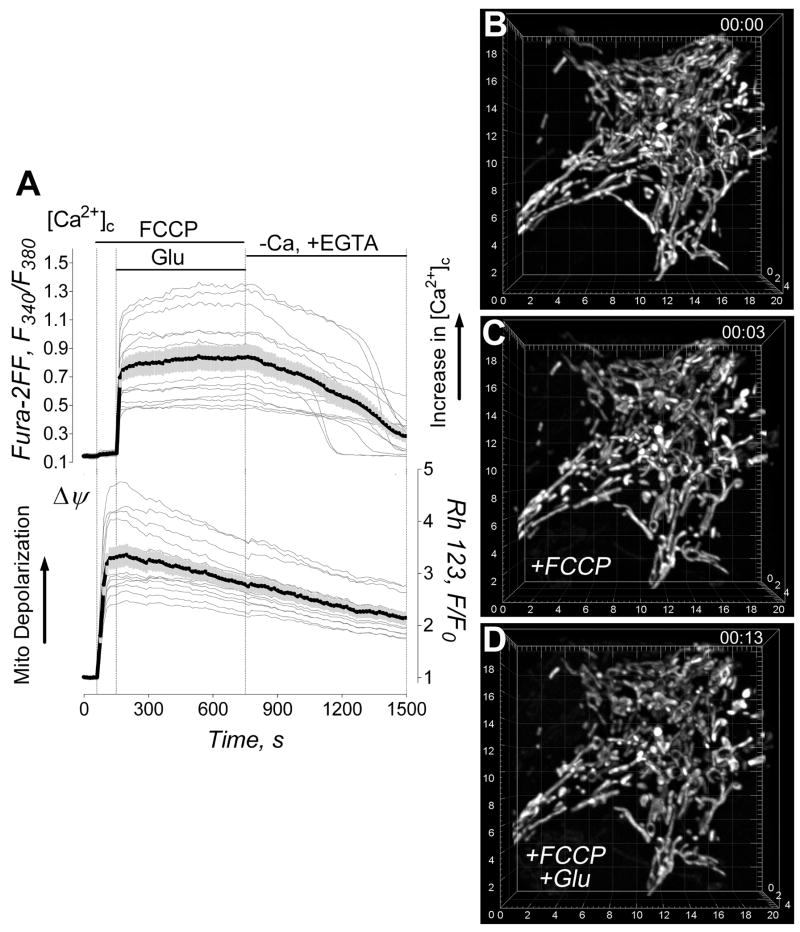
Mitochondrial depolarization with FCCP inhibits Ca2+ uptake by mitochondria [32]. Therefore, FCCP could be used to determine the role of mitochondrial Ca2+ uptake in mitochondrial remodeling triggered by exposure of neurons to glutamate. Previously, Rintoul et al. reported the lack of morphological changes in mitochondria of cultured neurons treated with FCCP and a failure to protect mitochondria against glutamate-induced remodeling by depolarizing them with FCCP [24]. On the other hand, the same group reported earlier a remarkable neuroprotection produced by FCCP, concluding that mitochondrial Ca2+ uptake is essential for excitotoxic neuronal death and its suppression with FCCP underlies neuroprotection [33]. In our experiments, a short-term mitochondrial depolarization with FCCP did not change [Ca2+]c (Fig. 5A). However, exposure of neurons to glutamate in the presence of FCCP caused immediate calcium deregulation similar to those reported previously [16;34]. Strikingly, FCCP not only affected mitochondrial morphology on its own (Figs. 3, 4), but also protected mitochondria from a distinct type of remodeling triggered by glutamate (Fig. 5B–D).
Figure 5. FCCP depolarizes neuronal mitochondria, causes immediate Ca2+ deregulation in neurons exposed to glutamate, but prevents glutamate-triggered, Ca2+-dependent mitochondrial remodeling.
In A, the individual (thin grey traces obtained from individual neurons) and average Fura-2FF (F340/F380, thick black traces) and Rhodamine 123 (Rh123, F/F0, thick black traces) fluorescence signals (total 9 separate experiments with neurons from three different platings). Neurons were treated with 1μM FCCP and then with 25μM glutamate (plus 10μM glycine) as indicated. In B–D, the representative 3D maximal fluorescence intensity projection images of the mitochondrial network within individual live cultured hippocampal neuron (we used total 19 different neurons in these experiments, all from different dishes from 4 separate platings). In B, mitochondrial network within live hippocampal neuron prior to addition of FCCP and glutamate. In C, mitochondrial network after incubation of the neuron with 1μM FCCP for 3 minutes. In D, mitochondrial network in neurons pre-treated with 1μM FCCP and then exposed to 25μM glutamate (plus 10μM glycine) in the presence of 1μM FCCP for 10 minutes. In these experiments we used a 4× extender lens in front of camera to increase spatial resolution. The scales are in μm.
3.7. Inhibition of Ca2+ influx into mitochondria with Ru360 suppresses mitochondrial remodeling
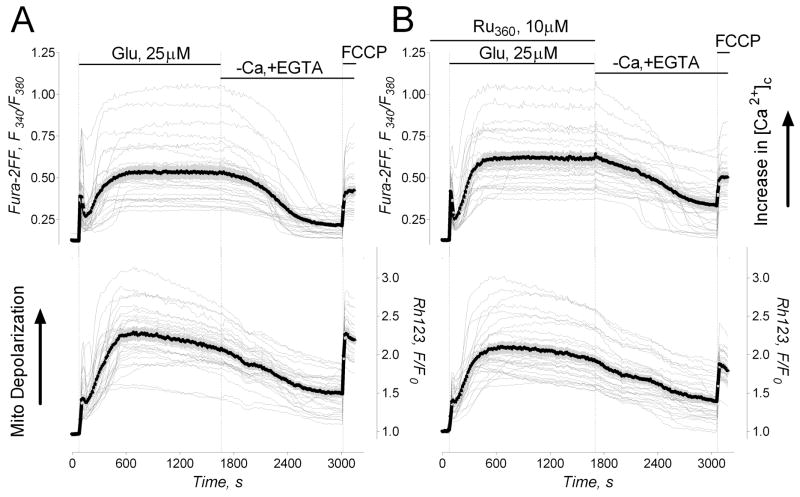
To further test the hypothesis that mitochondrial remodeling requires Ca2+ influx into mitochondria, we decided to use Ru360, a potent inhibitor of the mitochondrial Ca2+ uniporter [35] which could enter the cell and inhibit mitochondrial Ca2+ uptake in situ [36]. In the experiments with cultured neurons, Ru360 did not protect neuronal mitochondria against remodeling triggered by glutamate exposure (not shown). This seemed inconsistent with the protective effect of FCCP (Fig. 5B–D). Next, we tested whether Ru360 enters neurons by trying to determine any effect of Ru360 on [Ca2+]c and mitochondrial membrane potential in neurons exposed to glutamate. In these experiments, Ru360 influenced neither cytosolic calcium response to glutamate nor changes in mitochondrial membrane potential (Fig. 6). Thus, these results argue against Ru360 entry into cultured neurons.
Figure 6. The lack of Ru360 effect on glutamate induced changes in [Ca2+]c and mitochondrial membrane potential.
In A and B, the individual (thin grey traces obtained from individual neurons) and average Fura-2FF (F340/F380, thick black traces) and Rhodamine 123 (Rh123, F/F0, thick black traces) fluorescence signals (total 8 separate experiments with neurons from two different platings). Neurons were treated with 25μM glutamate (plus 10μM glycine) as indicated. In A, a representative control experiment without Ru360. In B, neurons were pre-incubated with 10μM Ru360 for an hour at 37°C. Ru360 was dissolved in deoxygenated water following manufacturer instructions. Ru360 (10μM) was also present in the bath solution during the experiment. Only fresh Ru360 solutions prepared just before adding it to neurons were used.
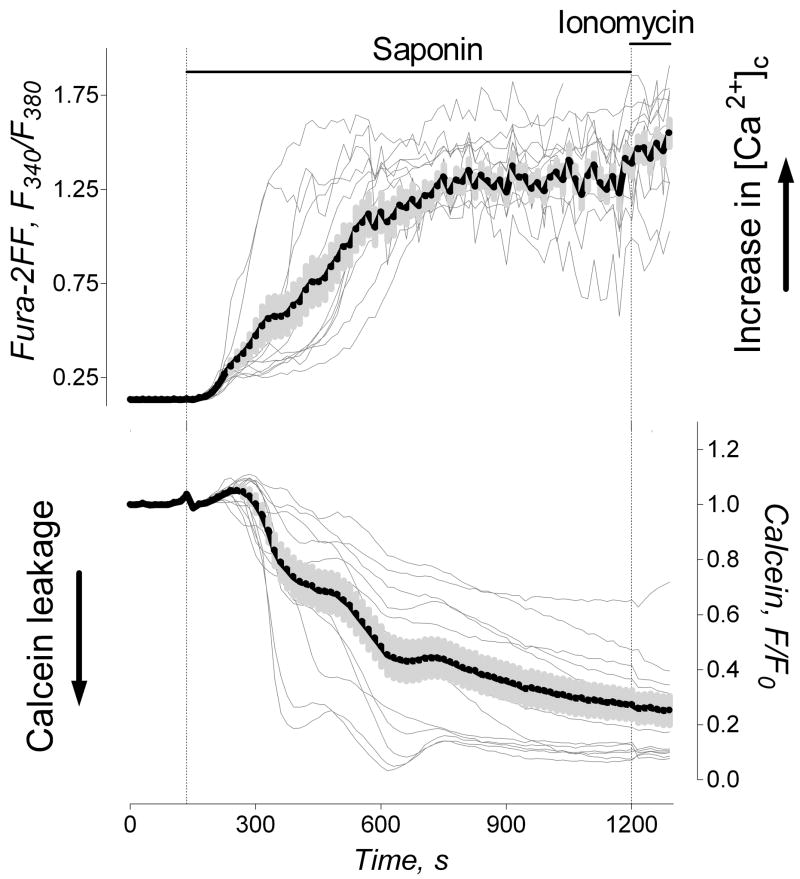
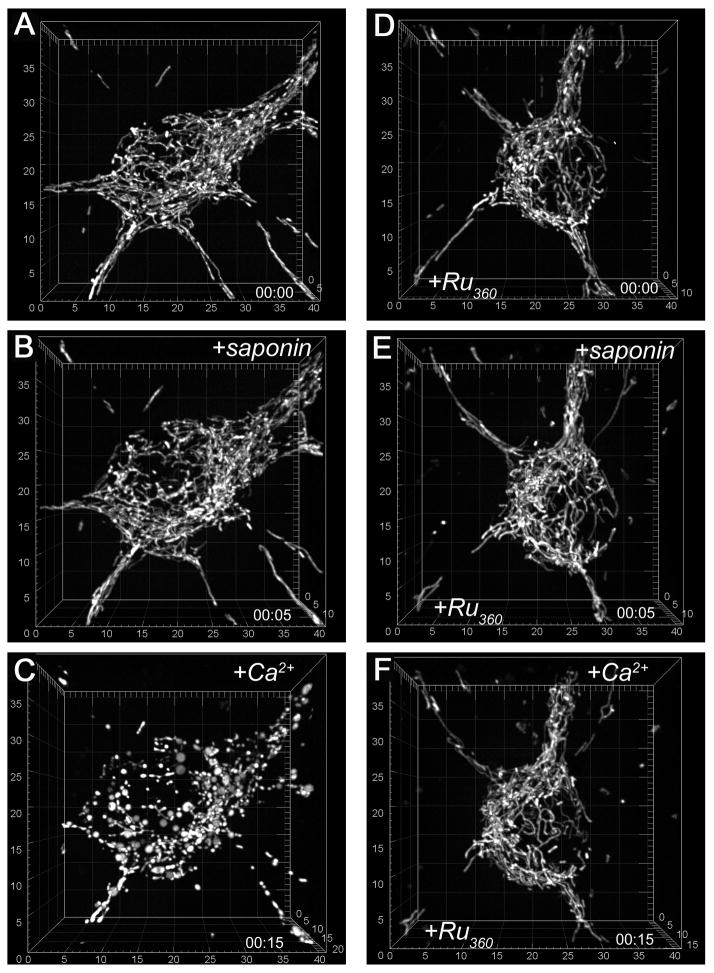
To permeabilize the plasma membrane for Ru360, we treated cells with 25μg/ml saponin for 5 minutes at room temperature. To assure permeabilization of the plasma membrane, we co-loaded neurons with 1μM calcein-AM and 2.6μM Fura-2FF-AM, and monitored detergent-induced leakage of calcein from neurons and Ca2+ influx into neurons (Fig. 7). Calcein (MW 622, Molecular Probes) was used as a surrogate for Ru360 (MW 550, Calbiochem). These experiments revealed that the plasma membrane became permeabilized within 5 minutes after application of saponin. Calcein fluorescence gradually decreased following saponin treatment, reflecting calcein leakage from neurons. Simultaneously, cytosolic [Ca2+]c gradually raised, reflecting Ca2+ influx into neurons. Fura-2FF (MW 854) appeared to be remaining in neurons during the course of the experiment. In 10 minutes after saponin application, [Ca2+]c reached the maximum so that the following addition of ionomycin did not change the Fura-2FF signal (Fig. 7). In the following experiments, we applied saponin to neurons expressing mito-eYFP in the medium mimicking the ion composition of the cytosol (Fig. 8). Saponin (25μg/ml, 5 minutes incubation) did not cause morphological changes in mitochondria of neurons incubated with or without Ru360 (Fig. 8B,E). Then, saponin was removed and 0.5 mM Ca2+ was added. In neurons incubated without Ru360, Ca2+ caused overt mitochondrial remodeling (Fig 8C) similar to the remodeling observed in non-permeabilized neurons after glutamate exposure (Fig 1). However, in neurons incubated with Ru360, Ca2+ failed to induce morphological remodeling (Fig. 8F). Thus, Ca2+ influx into mitochondria appeared to be necessary for mitochondrial morphological remodeling.
Figure 7. The time-course of the neuronal plasma membrane permeabilization by saponin.
The individual (thin traces obtained from individual neurons) and average Fura-2FF (F340/F380, thick black traces) and calcein (F/F0, thick black traces) fluorescence signals (total 5 separate experiments with neurons from two different platings). Neurons were co-loaded with 1μM calcein-AM and 2.6μM Fura-2FF-AM for 45 minutes at 37°C. Saponin (25μg/ml) was added as indicated. At the end of the experiments, 5μM ionomycin was added to ensure complete equilibration of Ca2+ across the membrane.
Figure 8. Ru360 protects against Ca2+-induced mitochondrial remodeling in saponin-permeabilized cultured hippocampal neurons.
In A–F, the representative 3D maximal fluorescence intensity projection images of the mitochondrial network within individual live cultured hippocampal neurons (we used total 12 different neurons in these experiments, all from different dishes from 3 separate platings). In A–C, neurons were incubated without Ru360. In D–F, the representative neuron was pre-treated with 10μM Ru360 for an hour at 37°C, and then, incubated in the standard bath solution supplemented with 10μM Ru360. In B and E, neurons were incubated with 25μg/ml saponin for 5 minutes. In C and D, saponin was removed and 0.5 mM Ca2+ was added to the bath solution. In these experiments, we used a 2× extender lens in front of the camera to increase spatial resolution The scales are in μm.
Since it is very likely that both FCCP and Ru360 preclude Ca2+ influx into neuronal mitochondria, these experiments suggest an interaction of Ca2+ with intramitochondrial targets that leads to mitochondrial remodeling in neurons exposed to glutamate or in saponin-permeabilized neurons exposed to elevated Ca2+. Since activation of the mPT also requires Ca2+ influx into mitochondria [37], and since NIM811, an inhibitor of the mPT, antagonizes mitochondrial remodeling (Figs. 1, 2), it is highly likely that the mPT is involved in mitochondrial remodeling triggered by exposing neurons to excitotoxic glutamate.
4. Discussion
The main goals of the present study were to quantitatively evaluate changes in mitochondrial morphology following exposure of neurons to excitotoxic glutamate and to establish the role of the mPT in these morphological alterations. We employed high-resolution laser spinning-disk confocal microscopy and calibrated 3D image reconstruction for quantitative investigation of mitochondrial remodeling in live cultured hippocampal neurons exposed to excitotoxic glutamate or the mitochondrial uncoupler FCCP. The major finding of our study is that, in neurons exposed to glutamate, elevation in cytosolic Ca2+ leads to mitochondrial “thread-grain” remodeling accompanied by increase in sphericity of organelles concurrent with a decrease in volume and surface area. This type of remodeling could be prevented by mitochondrial depolarization with FCCP and by NIM811, an inhibitor of the mPT [29]. Depolarization with FCCP also caused remodeling of organelles, but the changes in mitochondrial morphology were distinctly different from morphological alterations observed after exposure of neurons to glutamate and were not sensitive to NIM811.
4.1. Quantitative assessment of mitochondrial remodeling in live cultured neurons
Quantitative evaluation of mitochondrial morphology has been performed previously using electron microscopy-based 3D reconstructions of chemically-fixed segments of hippocampal areas CA1, CA3, and dentate gyrus [14]. However, in live cells quantitative assessment of mitochondrial morphological changes has emerged only recently. Mitochondria in live cells are traditionally visualized either by staining with mitochondrial dyes such as MitoTracker Green [5;28] or by expressing mitochondrially-targeted fluorescent proteins [19;38;39]. The use of MitoTracker dyes might have some serious drawbacks. It is well established that MitoTracker Green leaks out of mitochondria following mitochondrial depolarization [40]. Conceivably, re-location of the dye under conditions of viscous, unstirred cytosol might lead to overestimation of mitochondrial size, and therefore the quantitative assessment of mitochondrial morphology based on MitoTracker staining has to be taken cautiously. On the other hand, mito-eYFP used in the present and other studies [24] or mitochondrially-targeted redox-sensitive GFP used by others [20;41] remain in mitochondria regardless of membrane polarization, and therefore more precisely report mitochondrial morphological changes associated with elevation of cytosolic Ca2+ and/or mitochondrial depolarization..
4.2. Mechanisms of glutamate-induced mitochondrial remodeling
The decrease in mitochondrial volume found in our experiments with glutamate-treated neurons seems surprising and counterintuitive. Indeed, a massive Ca2+ influx into the cytosol following exposure to glutamate and a subsequent accumulation of Ca2+ in mitochondria might cause the mPT leading to mitochondrial depolarization and swelling [6;16;23;42;43]. Nevertheless, our quantitative analysis showed a decrease in mitochondrial volume and surface area after glutamate treatment. Our previous experiments with NIM811, a non-immunosuppressive analog of cyclosporin A [29], demonstrated protection against glutamate-triggered mitochondrial remodeling in the somata of hippocampal neurons [6]. Quantitative morphological analysis performed at the level of individual organelles confirmed our previous conclusions. However, this analysis also revealed some variations in the extent of NIM811 protection with some mitochondria being protected and others left without protection. The reasons for these variations are not clear. The effect of NIM811 suggests a link between glutamate-triggered mitochondrial remodeling and the mPT, but the exact mechanism of the remodeling and possible role of the mPT in this process is still not completely understood. Regardless of the mechanisms of the morphological changes, our data on glutamate-triggered remodeling of neuronal mitochondria are in agreement with results reported by Rintoul et al. [24] who demonstrated a Ca2+-dependent decrease in mitochondrial length in response to glutamate exposure. However, in contrast to Rintoul et al. [24], our data showed that FCCP-induced depolarization also produced changes in mitochondrial morphology although distinctly different from those caused by exposure to glutamate. Moreover, we found that depolarization with FCCP distinctly protected neuronal mitochondria from glutamate-triggered Ca2+-dependent remodeling. Since depolarization with FCCP inhibits mitochondrial Ca2+ uptake [32], which is required for the induction of the mPT [37], these results support our conclusion about involvement of the mPT in glutamate-triggered mitochondrial remodeling.
From the experiments with isolated mitochondria, it has been hypothesized that the driving forces for the Ca2+-induced swelling have a colloido-osmotic nature [44], but the precise mechanisms of this swelling remain obscure. From the data presented here, it seems unlikely that colloido-osmotic mechanisms play an exclusive role in regulating mitochondrial morphology in live neurons. It is hard to explain mitochondrial shortening, fission, and formation of circular mitochondria based on the K+ fluxes proposed earlier as a main regulating mechanism of mitochondrial volume and shape [18;45–47]. It seems more likely that mitochondrial morphology greatly depends on mitochondrial interaction with other intracellular elements, for example, with the cytoskeleton as it was proposed earlier [24]. Disruption of this interaction concomitant with an induction of the mPT might transform mitochondria, normally stretched along the cytoskeleton, from “thread-like” to rounded structures, significantly affecting mitochondrial metabolic functions and motility of organelles.
Acknowledgments
We are thankful to Dr. Roger Tsien (University of California, San Diego) who graciously provided mito-eYFP construct and to Dr. Peter Waldmeier (Novartis Pharma AG, Bazel, Switzerland) for help with obtaining NIM811. This work was supported by the NIH/NINDS R01 NS 050131 to NB.
Footnotes
Publisher's Disclaimer: This is a PDF file of an unedited manuscript that has been accepted for publication. As a service to our customers we are providing this early version of the manuscript. The manuscript will undergo copyediting, typesetting, and review of the resulting proof before it is published in its final citable form. Please note that during the production process errors may be discovered which could affect the content, and all legal disclaimers that apply to the journal pertain.
References
- 1.Karbowski M, Youle RJ. Dynamics of mitochondrial morphology in healthy cells and during apoptosis. Cell Death Differ. 2003;10:870–880. doi: 10.1038/sj.cdd.4401260. [DOI] [PubMed] [Google Scholar]
- 2.Detmer SA, Chan DC. Functions and dysfunctions of mitochondrial dynamics. Nat Rev Mol Cell Biol. 2007;8:870–879. doi: 10.1038/nrm2275. [DOI] [PubMed] [Google Scholar]
- 3.Benard G, Bellance N, James D, et al. Mitochondrial bioenergetics and structural network organization. J Cell Sci. 2007;120:838–848. doi: 10.1242/jcs.03381. [DOI] [PubMed] [Google Scholar]
- 4.Frank S, Gaume B, Bergmann-Leitner ES, et al. The role of dynamin-related protein 1, a mediator of mitochondrial fission, in apoptosis. Dev Cell. 2001;1:515–525. doi: 10.1016/s1534-5807(01)00055-7. [DOI] [PubMed] [Google Scholar]
- 5.Safiulina D, Veksler V, Zharkovsky A, Kaasik A. Loss of mitochondrial membrane potential is associated with increase in mitochondrial volume: physiological role in neurones. J Cell Physiol. 2006;206:347–353. doi: 10.1002/jcp.20476. [DOI] [PubMed] [Google Scholar]
- 6.Shalbuyeva N, Brustovetsky T, Bolshakov A, Brustovetsky N. Calcium-dependent spontaneously reversible remodeling of brain mitochondria. J Biol Chem. 2006;281:37547–37558. doi: 10.1074/jbc.M607263200. [DOI] [PubMed] [Google Scholar]
- 7.Sun MG, Williams J, Munoz-Pinedo C, et al. Correlated three-dimensional light and electron microscopy reveals transformation of mitochondria during apoptosis. Nat Cell Biol. 2007;9:1057–1065. doi: 10.1038/ncb1630. [DOI] [PubMed] [Google Scholar]
- 8.Halestrap AP. The regulation of the matrix volume of mammalian mitochondria in vivo and in vitro and its role in the control of mitochondrial metabolism. Biochim Biophys Acta. 1989;973:355–382. doi: 10.1016/s0005-2728(89)80378-0. [DOI] [PubMed] [Google Scholar]
- 9.Benard G, Rossignol R. Ultrastructure of the mitochondrion and its bearing on function and bioenergetics. Antioxid Redox Signal. 2008;10:1313–1342. doi: 10.1089/ars.2007.2000. [DOI] [PubMed] [Google Scholar]
- 10.Kaasik A, Safiulina D, Choubey V, Kuum M, Zharkovsky A, Veksler V. Mitochondrial swelling impairs the transport of organelles in cerebellar granule neurons. J Biol Chem. 2007;282:32821–32826. doi: 10.1074/jbc.M702295200. [DOI] [PubMed] [Google Scholar]
- 11.Bianchi K, Rimessi A, Prandini A, Szabadkai G, Rizzuto R. Calcium and mitochondria: mechanisms and functions of a troubled relationship. Biochim Biophys Acta. 2004;1742:119–131. doi: 10.1016/j.bbamcr.2004.09.015. [DOI] [PubMed] [Google Scholar]
- 12.Brustovetsky N, Brustovetsky T, Jemmerson R, Dubinsky JM. Calcium-induced cytochrome c release from CNS mitochondria is associated with the permeability transition and rupture of the outer membrane. J Neurochem. 2002;80:207–218. doi: 10.1046/j.0022-3042.2001.00671.x. [DOI] [PubMed] [Google Scholar]
- 13.Myron DR, Connelly JL. The morphology of the swelling process in rat liver mitochondria. J Cell Biol. 1971;48:291–302. doi: 10.1083/jcb.48.2.291. [DOI] [PMC free article] [PubMed] [Google Scholar]
- 14.Popov V, Medvedev NI, Davies HA, Stewart MG. Mitochondria form a filamentous reticular network in hippocampal dendrites but are present as discrete bodies in axons: a three-dimensional ultrastructural study. J Comp Neurol. 2005;492:50–65. doi: 10.1002/cne.20682. [DOI] [PubMed] [Google Scholar]
- 15.Collins TJ, Berridge MJ, Lipp P, Bootman MD. Mitochondria are morphologically and functionally heterogeneous within cells. EMBO J. 2002;21:1616–1627. doi: 10.1093/emboj/21.7.1616. [DOI] [PMC free article] [PubMed] [Google Scholar]
- 16.Pivovarova NB, Nguyen HV, Winters CA, Brantner CA, Smith CL, Andrews SB. Excitotoxic calcium overload in a subpopulation of mitochondria triggers delayed death in hippocampal neurons. J Neurosci. 2004;24:5611–5622. doi: 10.1523/JNEUROSCI.0531-04.2004. [DOI] [PMC free article] [PubMed] [Google Scholar]
- 17.Chang DT, Reynolds IJ. Mitochondrial trafficking and morphology in healthy and injured neurons. Prog Neurobiol. 2006;80:241–268. doi: 10.1016/j.pneurobio.2006.09.003. [DOI] [PubMed] [Google Scholar]
- 18.Kaasik A, Safiulina D, Zharkovsky A, Veksler V. Regulation of mitochondrial matrix volume. Am J Physiol Cell Physiol. 2007;292:C157–C163. doi: 10.1152/ajpcell.00272.2006. [DOI] [PubMed] [Google Scholar]
- 19.Gerencser AA, Doczi J, Torocsik B, Bossy-Wetzel E, dam-Vizi V. Mitochondrial swelling measurement in situ by optimized spatial filtering: astrocyte-neuron differences. Biophys J. 2008 doi: 10.1529/biophysj.107.118620. [DOI] [PMC free article] [PubMed] [Google Scholar]
- 20.Plecita-Hlavata L, Lessard M, Santorova J, Bewersdorf J, Jezek P. Mitochondrial oxidative phosphorylation and energetic status are reflected by morphology of mitochondrial network in INS-1E and HEP-G2 cells viewed by 4Pi microscopy. Biochim Biophys Acta. 2008 doi: 10.1016/j.bbabio.2008.04.002. [DOI] [PubMed] [Google Scholar]
- 21.Castillo J, Davalos A, Noya M. Progression of ischaemic stroke and excitotoxic aminoacids. Lancet. 1997;349:79–83. doi: 10.1016/S0140-6736(96)04453-4. [DOI] [PubMed] [Google Scholar]
- 22.Nicholls DG. Mitochondrial dysfunction and glutamate excitotoxicity studied in primary neuronal cultures. Curr Mol Med. 2004;4:149–177. doi: 10.2174/1566524043479239. [DOI] [PubMed] [Google Scholar]
- 23.Dubinsky JM, Levi Y. Calcium-induced activation of the mitochondrial permeability transition in hippocampal neurons. J Neurosci Res. 1998;53:728–741. doi: 10.1002/(SICI)1097-4547(19980915)53:6<728::AID-JNR10>3.0.CO;2-U. [DOI] [PubMed] [Google Scholar]
- 24.Rintoul GL, Filiano AJ, Brocard JB, Kress GJ, Reynolds IJ. Glutamate decreases mitochondrial size and movement in primary forebrain neurons. J Neurosci. 2003;23:7881–7888. doi: 10.1523/JNEUROSCI.23-21-07881.2003. [DOI] [PMC free article] [PubMed] [Google Scholar]
- 25.Greenamyre JT, MacKenzie G, Peng TI, Stephans SE. Mitochondrial dysfunction in Parkinson’s disease. Biochem Soc Symp. 1999;66:85–97. doi: 10.1042/bss0660085. [DOI] [PubMed] [Google Scholar]
- 26.Mattson MP. Excitotoxic and excitoprotective mechanisms: abundant targets for the prevention and treatment of neurodegenerative disorders. Neuromolecular Med. 2003;3:65–94. doi: 10.1385/NMM:3:2:65. [DOI] [PubMed] [Google Scholar]
- 27.Dubinsky JM. Intracellular calcium levels during the period of delayed excitotoxicity. Journal of Neuroscience. 1993;13:623–631. doi: 10.1523/JNEUROSCI.13-02-00623.1993. [DOI] [PMC free article] [PubMed] [Google Scholar]
- 28.Kahlert S, Reiser G. Swelling of mitochondria in cultured rat hippocampal astrocytes is induced by high cytosolic Ca(2+) load, but not by mitochondrial depolarization. FEBS Lett. 2002;529:351–355. doi: 10.1016/s0014-5793(02)03394-x. [DOI] [PubMed] [Google Scholar]
- 29.Waldmeier PC, Feldtrauer JJ, Qian T, Lemasters JJ. Inhibition of the mitochondrial permeability transition by the nonimmunosuppressive cyclosporin derivative NIM811. Mol Pharmacol. 2002;62:22–29. doi: 10.1124/mol.62.1.22. [DOI] [PubMed] [Google Scholar]
- 30.Vergun O, Han YY, Reynolds IJ. Glucose deprivation produces a prolonged increase in sensitivity to glutamate in cultured rat cortical neurons. Exp Neurol. 2003;183:682–694. doi: 10.1016/s0014-4886(03)00243-7. [DOI] [PubMed] [Google Scholar]
- 31.Rasola A, Bernardi P. The mitochondrial permeability transition pore and its involvement in cell death and in disease pathogenesis. Apoptosis. 2007;12:815–833. doi: 10.1007/s10495-007-0723-y. [DOI] [PubMed] [Google Scholar]
- 32.Bernardi P. Mitochondrial transport of cations: channels, exchangers, and permeability transition. Physiol Rev. 1999;79:1127–1155. doi: 10.1152/physrev.1999.79.4.1127. [DOI] [PubMed] [Google Scholar]
- 33.Stout AK, Raphael HM, Kanterewicz BI, Klann E, Reynolds IJ. Glutamate-induced neuron death requires mitochondrial calcium uptake. Nat Neurosci. 1998;1:366–373. doi: 10.1038/1577. [DOI] [PubMed] [Google Scholar]
- 34.Pivovarova NB, Stanika RI, Watts CA, Brantner CA, Smith CL, Andrews SB. Reduced calcium-dependent mitochondrial damage underlies the reduced vulnerability of excitotoxicity-tolerant hippocampal neurons. J Neurochem. 2008;104:1686–1699. doi: 10.1111/j.1471-4159.2007.05080.x. [DOI] [PubMed] [Google Scholar]
- 35.Ying WL, Emerson J, Clarke MJ, Sanadi DR. Inhibition of mitochondrial calcium ion transport by an oxo-bridged dinuclear ruthenium ammine complex. Biochemistry. 1991;30:4949–4952. doi: 10.1021/bi00234a016. [DOI] [PubMed] [Google Scholar]
- 36.Matlib MA, Zhou Z, Knight S, et al. Oxygen-bridged dinuclear ruthenium amine complex specifically inhibits Ca2+ uptake into mitochondria in vitro and in situ in single cardiac myocytes. J Biol Chem. 1998;273:10223–10231. doi: 10.1074/jbc.273.17.10223. [DOI] [PubMed] [Google Scholar]
- 37.Zoratti M, Szabo I. The mitochondrial permeability transition. Biochim Biophys Acta. 1995;1241:139–176. doi: 10.1016/0304-4157(95)00003-a. [DOI] [PubMed] [Google Scholar]
- 38.Rizzuto R, Brini M, Pizzo P, Murgia M, Pozzan T. Chimeric green fluorescent protein as a tool for visualizing subcellular organelles in living cells. Curr Biol. 1995;5:635–642. doi: 10.1016/s0960-9822(95)00128-x. [DOI] [PubMed] [Google Scholar]
- 39.Dooley CT, Dore TM, Hanson GT, Jackson WC, Remington SJ, Tsien RY. Imaging dynamic redox changes in mammalian cells with green fluorescent protein indicators. J Biol Chem. 2004;279:22284–22293. doi: 10.1074/jbc.M312847200. [DOI] [PubMed] [Google Scholar]
- 40.Buckman JF, Hernandez H, Kress GJ, Votyakova TV, Pal S, Reynolds IJ. MitoTracker labeling in primary neuronal and astrocytic cultures: influence of mitochondrial membrane potential and oxidants. J Neurosci Methods. 2001;104:165–176. doi: 10.1016/s0165-0270(00)00340-x. [DOI] [PubMed] [Google Scholar]
- 41.Rossignol R, Gilkerson R, Aggeler R, Yamagata K, Remington SJ, Capaldi RA. Energy substrate modulates mitochondrial structure and oxidative capacity in cancer cells. Cancer Res. 2004;64:985–993. doi: 10.1158/0008-5472.can-03-1101. [DOI] [PubMed] [Google Scholar]
- 42.Vergun O, Keelan J, Khodorov BI, Duchen MR. Glutamate-induced mitochondrial depolarisation and perturbation of calcium homeostasis in cultured rat hippocampal neurones. J Physiol. 1999;519(Pt 2):451–466. doi: 10.1111/j.1469-7793.1999.0451m.x. [DOI] [PMC free article] [PubMed] [Google Scholar]
- 43.Alano CC, Beutner G, Dirksen RT, Gross RA, Sheu SS. Mitochondrial permeability transition and calcium dynamics in striatal neurons upon intense NMDA receptor activation. J Neurochem. 2002;80:531–538. doi: 10.1046/j.0022-3042.2001.00738.x. [DOI] [PubMed] [Google Scholar]
- 44.Gunter TE, Pfeiffer DR. Mechanisms by which mitochondria transport calcium. Am J Physiol. 1990;258:C755–C786. doi: 10.1152/ajpcell.1990.258.5.C755. [DOI] [PubMed] [Google Scholar]
- 45.Halestrap AP, Quinlan PT, Whipps DE, Armston AE. Regulation of the mitochondrial matrix volume in vivo and in vitro. The role of calcium. Biochem J. 1986;236:779–787. doi: 10.1042/bj2360779. [DOI] [PMC free article] [PubMed] [Google Scholar]
- 46.Halestrap AP, Davidson AM. Inhibition of Ca2(+)-induced large-amplitude swelling of liver and heart mitochondria by cyclosporin is probably caused by the inhibitor binding to mitochondrial-matrix peptidyl-prolyl cis-trans isomerase and preventing it interacting with the adenine nucleotide translocase. Biochem J. 1990;268:153–160. doi: 10.1042/bj2680153. [DOI] [PMC free article] [PubMed] [Google Scholar]
- 47.Garlid KD, Paucek P. Mitochondrial potassium transport: the K(+) cycle. Biochim Biophys Acta. 2003;1606:23–41. doi: 10.1016/s0005-2728(03)00108-7. [DOI] [PubMed] [Google Scholar]


