

Abstract
Androgen-dependent prostate cancer typically progresses to castration resistant prostate cancer (CRPC) after the androgen deprivation therapy. MicroRNAs (miRs) are non-coding small RNAs (19-25nt) that play an important role in the regulation of gene expression. Recent studies have shown that miR expression patterns are significantly different in normal and neoplastic prostate epithelial cells. However, the importance of miRs in the development of CRPC has not yet been explored. By performing genome-wide expression profiling of miRs, we found that expression levels of several miRs, in particular miR-221 and miR-222, were significantly increased in CRPC cells (the LNCaP derived cell line LNCaP-Abl), compared with those in the Androgen-dependent prostate cancer cell line (LNCaP). Over-expression of miR-221 or -222 in LNCaP or another AD cell line, LAPC-4 significantly reduced the level of the dihydrotestosterone (DHT) induced up-regulation of PSA expression and increased androgen independent growth of LNCaP cells. Knocking down the expression level of miR-221 and -222 with antagonist miRs in the LNCaP-Abl cell line restored the response to the DHT induction of PSA transcription and also increased the growth response of the LNCaP-Abl cells to the androgen treatment. Changing the expression level of p27/kip1, a known target of miR-221 and -222, alone, in LNCaP cells affected the DHT independent cell growth, but did not significantly influence the response of PSA transcription to the DHT treatment. In conclusion, our data suggest the involvement of miR-221 and -222 in the development or maintenance of the CRPC phenotype.
Keywords: microRNA, miR-221, miR-222, LNCaP, prostate cancer
Introduction
Androgen and androgen receptor (AR) play crucial roles in prostate cancer (CaP) development and progression. Similar to other secondary sexual organs, the development and homeostasis of prostate epithelial cells requires androgen, even in the transformed state. Initially, almost all metastatic CaP require testosterone for growth and androgen deprivation therapy (ADT) is an effective therapeutic intervention for metastatic CaP (1). Most patients are initially responsive to ADT but eventually their cancers progress to castration resistant prostate cancer (CRPC), leading to death (2). Many attempts have been made to characterize the molecular signature of CRPC. It is known that during CRPC progression, CaP cells utilize a variety of AR dependent and independent pathways to survive and flourish in an androgen-depleted environment (2). However, a comprehensive understanding of the involved mechanisms is still lacking and thus the further study of CRPC is an important step towards developing therapies for this lethal phenotype.
MicroRNAs (miRs), which are groups of naturally occurring small non-coding RNAs, negatively control gene expression either by regulating mRNA translation or stability post-transcriptionally (3) or via the transcriptional silencing, in a sequence specific manner (4, 5). It was estimated that the human genome encodes close to one thousand different miRs, which are predicted to control the activity of ~30% of all protein-coding genes (6). Involvement of miRs has been demonstrated in many cellular functions such as cell proliferation, cell differentiation, stress response, apoptosis, immunity, and transcriptional regulation (7). Cancer, which results from a dysregulation of these pathways, might in part result from aberrant miR expression. Many studies have indicated that miRs could function as oncogenes or tumor suppressors, playing crucial roles in transformation and carcinogenesis (8, 9). MiR expression signatures have been used to classify cancers and to define miR markers that might predict a favorable prognosis (10, 11). Recent miR profiling data implicated the association of specific miR expression patterns with tumorigenesis and degree of tumor differentiation in human CaP (12, 13). However, the precise role of specific miRs in modulating malignant progression is largely unknown.
We are interested in molecular mechanisms or modulators involved in the progression of CRPC. To identify and to understand the role of miRs in the development and/or maintenance of CRPC, we developed comprehensive miR expression profiles in the androgen dependent (AD) LNCaP cell line and the androgen independent (AI) LNCaP-Abl cell line. The initial analysis generated a subset of miRs that was differentially expressed in LNCaP and LNCaP-Abl. Among these differentially expressed miRs, the expression level of miR-221 and -222 exhibited the most dramatic difference between AD and AI CaP cell lines, suggesting their importance in the development of CRPC. In this report, we determined miR signatures in CRPC and demonstrated direct evidence for the involvement of miR-221/-222 in CRPC development and/or maintenance.
Material and Methods
Reagents
Synthetic, chemically modified short single- or double-stranded RNA oligonucleotides: Pre-miR-221 molecule, Pre-miR-222 molecule, Pre-miR-negative control, anti-miR-221 molecule, anti-miR-222 molecule and anti-miR-negative control were purchased from Ambion. Dihydrotestosterone (DHT) and flutamide were purchased from Sigma-Aldrich. Pre-designed siRNA targeting p27/kip1 (AM 16704) and siRNA negative control (AM 4611) were purchased from Ambion. P27/kip1 expression vector, pCMV-SPORT6 inserted with full-length p27/kip1 cDNA was purchased from ATCC (MGC-5304).
Cell Lines
The prostate cancer cell line LNCaP was obtained from the American Type Culture Collection. LNCaP-Abl cell line was provided by Zoran Culig (Innsbruck Medical University, Austria) (14). LNCaP C4-2 cell line was obtained from ViroMed Laboratories (Minneapolis, MN). LNCaP-104R2 cell line was provided by Shutsung Liao (15) and LAPC-4 cell line was provided by Charles Sawyers (16). LNCaP is a widely-used CaP research model cell line, which was initially isolated from a biopsy of a lymph node metastasis from a 50-year-old man (17). The LNCaP-Abl and LNCaP-104R2 were AI cell lines directly derived from LNCaP by maintaining in an androgen-depleted medium (14,15). LNCaP-C4-2 cell line was established from castrated mouse xenografts. LAPC-4 cell line contains a wild type AR and is an androgen dependent cell line. LNCaP, LNCaP-Abl, LNCaP C4-2, LNCaP-104R2 and LAPC-4 cell lines were maintained in RPMI-1640 supplemented with 10% fetal bovine serum (FBS) (for LNCaP cells, LNCaP C4-2 and LAPC-4 cells) or 10% charcoal-stripped FBS (for LNCaP-Abl and LNCaP-104R2 cells).
MiRNA Microarray Experiments
LNCaP and LNCaP-Abl cell were seeded in 10-cm dishes at ~15% confluence and then grew to ~60% confluence for RNA isolation. Biological triplicate total RNAs (15 μg) from each cell line were isolated using mirVana™ miRNA Isolation Kit (Ambion). MiR profiling was performed by LC science (Huston, TX) using μParaflo®microfluidics chip (human-MRA-1001, version 10.1), which contains 711 verified human miR probes. Raw data was normalized and analyzed using Gene Cluster 2.0. Average linkage clustering was performed by using uncensored correlation metric. Statistical comparisons were done by using ANOVA tool in SigmaStat 3.1(SPSS Inc).
Transfection
LNCaP, LAPC-4 and LNCaP-Abl cells were cultured to 60% confluence and then transfected with 30 nM of Pre-miR221 and -222 oligonucleotides or anti-miR-221 and -222 inhibitors or miR-Precursor negative control or anti-miR inhibitors negative control for 24 h using Lipofectamine2000 according to manufacturer’s instructions. Subsequently, 10 nM DHT with or without 1 μM casodex or 1 μM flutamide was added into media and incubated for another 24 h. To alter the expression level of p27/kip1 in LNCaP, pre-designed p27/kip1 siRNA, negative control siRNA or pCMV-SPORT6-p27/kip1 plasmid were transiently transfected into LNCaP cells using Lipofectamine2000 (Invitrogen). Twenty-four hours after transfection, cells were treated either ethanol vehicle or 10 nM DHT for another 24 hr. Total RNAs or proteins were then harvested for the analysis of p27/kip1 expression.
RNA extraction and real-time RT-PCR
Total RNAs were isolated using mirVana™ miRNA Isolation Kit (Ambion). MiR expression levels in different cells were quantitated by qRT-PCR, using mirVana™ qRT-PCR miRNA Detection Kit and Primer Sets (Ambion), following the manufacture instruction. PSA, AR and GAPDH real-time PCR primers and probe sets were inventoried products of Applied Biosystem (Assay ID: Hs01105076_m1, Hs00907244_m1 and Hs02758991_g1, respectively). Analyses were performed using a standard TaqMan PCR Kit protocol. Experiments were carried out in triplicate for each data point.
Western blotting
Total proteins from various CaP cell lines were extracted with radioimmunoprecipitation assay (RIPA) buffer (50 mM Tris-HCl PH7.4, 150 mM NaCl, 1% NP-40, 0.5% sodium deoxycholate, 0.1% SDS, 5 mM EDTA). Fifty μg of each protein extract was resolved on 10% SDS-PAGE and transferred to Hybond-C nitrocellulose. The level of p27/kip1 expression was evaluated by mouse monoclonal anti-p27 antibody (610241; BD Biosciences) and with an Enhanced ChemiLuminescence (ECL) detection system (Amersham Life Science). As a loading control, β-actin expression levels were measured using a monoclonal anti-Actin (A 3853; Sigma).
Cell Proliferation Assay
For all cell growth studies, cells were plated in 96-well plates in androgen-depleted medium. After cultured for 24 h, cells were transfected with Pre-miR221 or Anti-miR221 for 24 h before adding 10 nM DHT. Tetrazolium salt (WST-1, Roche applied science) cell proliferation assay was then carried out at various days after transfection, following the manufacture instruction.
Results
MiR expression screening in the CRPC, LNCaP-Abl cell line versus the AD, LNCaP cell line
To investigate the involvement of miRs in the CRPC development, we chose to perform miR expression profiling in the AD, LNCaP CaP cell line and its derived castration resistant counterpart, LNCaP-Abl. The relationship of LNCaP and LNCaP-Abl resembles the progression of CaP from AD to CRPC. Additionally, in these two cell lines, the whole chromosome AR binding sites have been mapped and the dynamics of AR transcription complex loading on PSA regulatory regions are well characterized (18, 19). Thus we decided to use the LNCaP and LNCaP-Abl cell lines for miR expression profiling and use the expression of PSA, an androgen regulated gene, to evaluate the AR mediated transcription in response to the DHT treatment in this study.
Triplicate sets of miR expression profiling were performed. Pair-wise significance analysis of the microarray data indicated that the expression of four miRs (miR-221, -222, -15a and -16-1) was significantly up-regulated in LNCaP-Abl, ranging from 1.5- to 10- fold change, compared to those in LNCaP (Fig. 1; the right top panel, ones statistical-significantly up-regulated in LNCaP-Abl cells are highlighted in red; Table. 1). Remarkably, miR-221 and -222, showed a 6 to 10 fold over-expression in LNCaP-Abl compared to LNCaP. Additionally, the expression of miR-203, -23b and -27b was reproducibly down regulated in LNCaP-Abl by 4.3, 1.6 and 1.9 fold, respectively, compared to those in LNCaP (Fig. 1; the right bottom panel, highlighted in green; Table. 1).
Figure 1. Comparison of miR expression patterns in LNCaP and LNCaP-Abl.

Fold changes (LNCaP-Abl versus LNCaP) of the miRs are presented. LNCaP-1/LNCaP-Abl-1 and LNCaP-2 /LNCaP-Abl-2 represent two independently performed experiments. The tree graphs display the log2 transformation of the average fold changes. Arrays were mean centered and normalized by Gene Cluster 2.0. Average linkage clustering was performed by using uncensored correlation metric. The scale bar on the right upper corner displays the color range and the corresponding log2 transformation of average fold changes.
Table 1.
The relative expression level of differentially expressed miRs in LNCaP Abl versus in LNCaP.
| miRNAs | Chromosomal location | Fold change | P value (t-test) |
|---|---|---|---|
| hsa-miR-221 | Xp11.3 | + 10.756 | <0.001 |
| hsa-miR-222 | Xp11.3 | + 6.512 | <0.001 |
| hsa-miR-15a | 13q 14.3 | + 5.171 | <0.001 |
| hsa-miR-16-1 | 13q 14.3 | + 1.850 | 0.018 |
| hsa-miR-203 | 14q 32.3 | − 4.255 | 0.004 |
| hsa-miR-23b | 9q22.3 | − 1.626 | 0.014 |
| hsa-miR-27b | 9q22.3 | − 1.942 | 0.048 |
Two-sided T-tests and Q value (false-positive rate) were calculated on three sets of independent experimental data. All differentially expressed miRs have Q < 0.01 and P <0.05 for T-test. These miRs were identified by PAM as predictor with lowest misclassification error. Four miRs are up regulated (marked with ‘+’) and three are down regulated (marked with ‘−’) in the CRPC cell line LNCaP-Abl compared to the AD LNCaP cells.
To validate the differential expression patterns of these 7 miRs, revealed by microarray analysis, we performed quantitative real-time-polymerase chain reaction (qRT-PCR) for each individual miR in LNCaP, LNCaP-Abl and two additional LNCaP derived AI cell lines, LNCaP-104R2 and LNCaP-C4-2 (Fig. 2). The analysis confirmed that expression of miR-221, -222, -15a and -16-1 was up-regulated in CRPC cells and expression of miR-203, -23b and -27b is down-regulated in all three independently derived CRPC cell lines, compared to those in LNCaP. Interestingly, the dramatic up-regulation of miR-221 and -222 (5.9 to 7.1 fold increase for miR-221 and 3.9 to 4.7 fold increase for miR-222, respectively) was reproducibly observed in LNCaP-Abl, LNCaP-104R2 and LNCaP-C4-2, suggesting their functional importance in CRPC development. Because of the magnitude of the change in expression, we decided to focus on the significance of miR-221 and -222 in the development and maintenance of CRPC.
Figure 2. The relative expression of selected miRs in LNCaP and LNCaP derived CRPC cell lines.
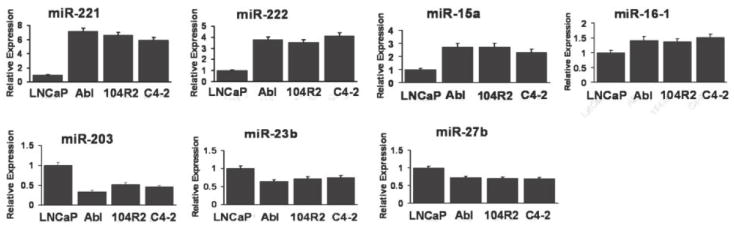
25 ng of total RNA from each cell line was used to measure miR expression levels by qRT-PCR. All of the data was normalized by the U6 expression level and presented as the relative expression level. The relative expression level of each miR in LNCaP was arbitrarily set as 1.0.
The impact of miR-221 and -222 expression levels on the AR mediated transcription in response to the DHT treatment
MiR-221 and -222 are encoded in tandem from a gene cluster on the short arm of chromosome X and their expression is presumably controlled by shared regulatory mechanisms (20). To evaluate the significance of miR-221 and -222 in controlling CRPC development, we determined the level of AR-mediated PSA transcription in response to the DHT treatment, when the expression level of miR-221 and/or -222 was altered in LNCaP or LNCaP-Abl. To over-express miR-221 or -222, we transiently transfected cell lines with commercially synthesized miR precursors, Pre-miR-221 or -222 (or with the synthetic mature miR-221 duplex). To knock down the expression of miR-221 or -222, cell lines were transiently transfected with commercially synthesized anti-miR miRNA inhibitors (Anti-miR-221 or -222). The over-expression or down-regulation of each miR after transfection was confirmed by RT-PCR as shown in the left panels of Fig. 3A and 3B.
Figure 3. The impact of miR-221 and -222 expression levels on the AR mediated transcription in response to the DHT treatment.

(A, B) Quantitative analysis of the expression level of PSA and AR in LNCaP (A) and LNCaP-Abl (B) with (+) or without androgen, DHT (-). Total RNAs were isolated from LNCaP that were mock-transfected (−), and transfected with pre-miR-221 (221), pre-miR-222 (222), pre-miR-221&-222 (221&222), or pre-miR-Neg RNA (NegRNA), and from LNCaP-Abl that were mock-transfected (−) and transfected with anti-miR-221 (221), anti-miR-222 (222), anti-miR221&-222 (221&222) or anti-miR-Neg RNA (Neg RNA). Left panels confirm the expression levels of miR-221 and -222 by RT-PCR in each transfected LNCaP (A) and LNCaP-Abl (B) cell lines. The expression of U6 was used as a control. Middle panels show the PSA expression levels analyzed by qRT-PCR. Right panels show the AR expression in each transfected cell line measured by qRT-PCR. (C) Comparison of the DHT induced PSA expression in LNCaP and LAPC-4. Cells were transfected with (+) or without (−) pre-miR-221 or pre-miR-Neg. (D) Effect of anti-androgen treatment on the PSA expression inducted by DHT. LNCaP and LNCaP-Abl were first transfected with Pre-miR-Negative (Neg RNA) or Pre-miR-221 and Anti-miR-Negative (Neg RNA) or Anti-miR-221 or without transfection (Mock) as indicated respectively, and then treated with (+) or without (−) DHT, Casodex and Flutamide. In all experiments, the relative expression levels of PSA and AR in each sample were normalized by the expression level of GAPDH. Values represent the fold differences relative to those in cells without any drug treatment or transfection (Mock), which were set as 1.0. *s indicate that the fold changes of those tranfected samples compared with their corresponding negative controls show a P-value < 0.05 in one-way ANOVA.
LNCaP expressed a relatively low level of miR-221 and -222. Over-expression of miR-221 and/or miR-222 in LNCaP significantly reduced the sensitivity to DHT treatment, as assessed by the reduction of DHT induced PSA mRNA expression by 43% (miR-221 alone), 30% (miR-222 alone) and 48% (miR-221 and miR-222) respectively, and the control transfection by over-expressing a commercially synthesized control miR (Neg RNA) did not affect the response of LNCaP to DHT (Fig. 3A, middle panel). The reduction of response to DHT was also observed in LNCaP cells that were transfected with the synthetic mature miR-221 duplex (data not shown). Since AR mediates PSA transcription, as a control, we determined the level of AR in each transfected cell line. Over-expression of miR-221 and -222 had no significant impact on the AR expression level in LNCaP (Fig. 3A, right panel).
LNCaP-Abl expressed miR-221 and -222 at a relatively high level. Transfection of LNCaP-Abl with anti-miR -221 and -222 to knock down their expression significantly restored the sensitivity of LNCaP-Abl to DHT as indicated by the increased level of DHT induced PSA mRNA expression (Fig. 3B, middle panel). Transfection with a nonspecific anti-miR (Neg RNA) did not affect PSA transcription in response to DHT (Fig. 3B, middle panel); and the AR expression level in LNCaP-Abl cells was not affected by knocking down miR-221 and -222 expressions (Fig. 3B, right panel).
To further confirm the impact of miR-221 expression level on the response of CaP cells to the DHT treatment, we over-expressed miR-221 in another AD, CaP cell line, LAPC-4, which possesses a wild-type AR. LAPC-4 expressed a relatively low level of mir-221/-222, comparable to that in LNCaP (data not shown). Again, over-expression of miR-221 significantly reduced the DHT induced PSA mRNA expression in LAPC-4 by ~39% (Fig. 3C). We also noticed that the basal level expression of PSA in LAPC-4 is much lower than that in LNCaP (Fig. 3C).
To assure that the influence of miR-221 and -222 expressions on the response to DHT in LNCaP and LNCaP-Abl was mediated by AR, we further examined the effect of anti-androgens [AR antagonists; flutamide (Eulexin) and bicalutamide (Casodex)] on the influence of miR-221. Treatment with anti-androgens completely blocked the restored DHT-induction of PSA expression (~2.5- fold) that was generated by knocking down miR-221, in LNCaP-Abl (Fig. 3 D, bottom panel). As a control, we confirmed the inhibitory effect of flutamide and bicalutamide on the DHT response in LNCaP with or without miR-221 over-expression. As anticipated, anti-androgens reduced the DHT-induced PSA expression to ~52% in LNCaP control cells; treatment with anti-androgens further reduced the level of DHT induced PSA mRNA in Pre-miR-221 transfected LNCaP (Fig. 3 D, upper panel). In summary, these data indicate that the expression level of miR-221 and -222 did not influence the expression of AR, however, they significantly affected the response of AR-mediated PSA expression in response to the DHT treatment in LNCaP and LNCaP-Abl, supporting the involvement of miR-221 and -222 in the development and/or maintenance of the AI phenotype.
The impact of miR-221 expression levels on the DHT dependent cell growth
To corroborate the hypothesis that miR-221/-222 are involved in the development of the AI phenotype, we further determined whether changing the expression level of miR-221 would influence the growth efficiency of LNCaP and LNCaP-Abl cells in the presence or absence of androgen. Cell proliferation was measured using the WST-1 assay. Fig. 4A shows the growth of Pre-miR-221 transfected LNCaP with or without the DHT treatment, compared to those of the mock-transfected LNCaP and LNCaP transfected with Pre-miR-negative control. A high level of over-expression of miR-221 in pre-miR-221 transfected LNCaP can be observed up to 3.5 days post-transfection (data not shown). As anticipated, the addition of DHT increased the growth of LNCaP by ~2.1- fold. Interestingly, over-expression of miR-221 increased the growth of LNCaP in the absence of androgen 2.6 fold and further addition of DHT into Pre-miR-221 transfected LNCaP only increased cell growth 1.4 fold.
Figure 4. Effect of the expression level of miR-221 on the growth of LNCaP and LNCaP-Abl.
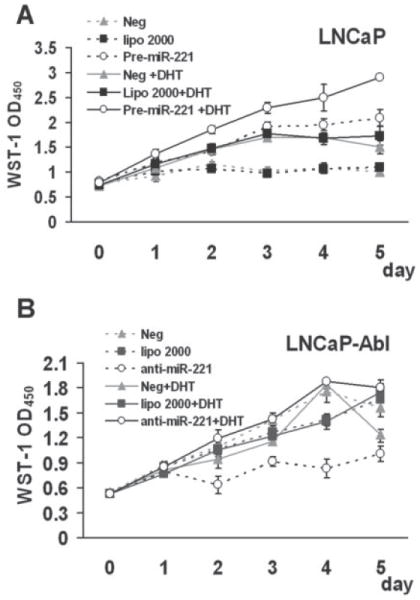
(A) WST-1 analysis of the growth of LNCaP cells that were transfected with Pre-miR-221, miRNA-precursor-negative control (Neg), mocked transfected (lipo 2000) and kept in medium with (+DHT, solid lines) or without androgen (broken lines). (B) WST-1 analysis of the growth of LNCaP-Abl cells that were transfected with Anti-miR-221, Anti-miRNA inhibitors negative control (Neg), mocked transfected (lipo 2000) and kept in medium with (+DHT, solid lines) or without androgen (broken lines). Triplicate experiments were performed for each set. The data represents mean ± S.D. (n = 3).
In contrast, addition of DHT did not significantly affect the growth rate of LNCaP-Abl cells (Fig. 4B). However, transfection with anti-miR-221 to knock-down the miR-221 expression in LNCaP-Abl reduced the cell growth by ~ 48%, and the growth of anti-miR-221 transfected LNCaP-Abl was increased by 1.8 fold in response to the DHT treatment (Fig. 4B). Transfection of cells with nonspecific anti-miR did not affect cell growth in the absence or presence of DHT, indicating that simply introducing small RNAs is not sufficient to affect cell growth or growth response to DHT. The cell growth analysis demonstrated that increasing the miR-221 expression increases DHT-independent growth and reduces the cell response to the DHT stimulation in both LNCaP and LNCaP-Abl. This result further suggested that a high expression level of miR-221 and -222 is a requisite for maintaining the CRPC phenotype.
Role of known targets of miR-221 and -222 in CRPC development
Up-regulation of miR-221/ -222 in CRPC cells presumably affects the expression of key components controlling the development of androgen independency. To further understand the involved mechanisms, we analyzed the expression of some known targets of miR-221/-222. The tumor suppressor p27/kip1, and oncogene kit-1 are two known targets (20-22). However, kit-1 is not expressed in prostate cells (data not shown). P27/kip1 belongs to Cip/Kip family and possesses the ability to inhibit several cyclin-cdk complexes (23). Expression level of p27/kip1 can be regulated by miR-221/-222 in CaP cells (20). Loss of p27/kip1 expression could explain the function of miR-221/-222 that stimulates cell proliferation and survival by up-regulating G1-S phase transition in the cell cycle (21, 24). We investigated the possibility of the involvement of p27/kip1 in CRPC development.
Western blot analysis of CaP cells with an anti-p27/kip1 revealed that all three LNCaP-derived CRPC cell lines exhibit a similar p27/kip1 expression level to that in LNCaP, despite the fact that miR-221 and -222 are expressed at significantly higher levels in CRPC cells (Fig. 5A). This result indicated that p27/kip1 in LNCaP-derived CRPC cells is not the mechanistic target of miR-221/-222. Nevertheless, as reported by other (20, 21, 24), we also found that miR-221 and -222 can control the p27/kip1 expression level in LNCaP (Fig. 5B). Over-expression of miR-221 and -222 in LNCaP significantly suppressed the expression of p27/kip1 (Fig. 5B). The down-regulation of p27/kip1 by the over-expression of mir-221/-222 can be observed up to 5 days after transfection (data not shown). We postulated that the LNCaP derived CRPCs that were developed via the activation of miR-221/-222 may require a certain amount of p27/kip1 to maintain their phenotype; as a result, mechanisms may be developed to allow p27/kip1 to escape from the control of miR-221/-222 in CRPCs.
Figure 5. Effect of p27/kip1 expression on the DHT induction of the PSA expression in LNCaP.
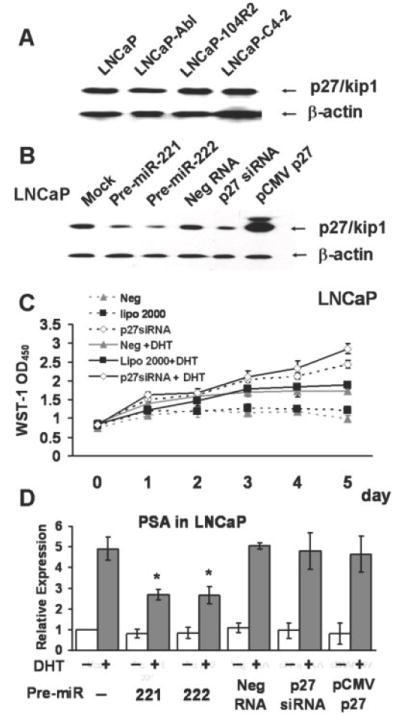
(A). Western blot analysis of p27/kip1 in LNCaP and LNCaP derived CRPC cell lines. The amount of β-actin in each lane is used as a loading control. (B). Western blot analysis of p27/kip1 in LNCaP cells that were mock-transfected (mock) or transfected with Pre-miR-221 (Pre-221), Pre-miR-222 (Pre-222), miRNA precursor-negative control (Neg RNA), p27/kip1 siRNA (p27 siRNA) or pCMV-SOPRT 6-p27/kip1 vector (pCMV-p27). Total proteins were extracted from cells 48 hours after transfection. (C). The impact of p27/kip1 siRNA on the growth of LNCaP. WST-1 assay was used to measure the cell growth. LNCaP cells that were transfected with p27/kip1 siRNA (p27siRNA, open squares), anti-miRNA inhibitors negative control (Neg, triangles), and mocked transfected (lipo 2000, black squares) were cultured in medium with (+DHT, solid lines) or without DHT (broken lines). Triplicate experiments were performed for each set. The data represents mean ± S.D. (n = 3). (D). QRT-PCR of the relative PSA expression level in transfected LNCaP cells as those described in (B). The relative expression level of PSA in each sample was normalized by the expression level of GAPDH. Values represent the fold differences relative to that in mock transfected cells without any drug treatment, which was arbitrarily set as 1.0. *s indicate that the fold changes of those transfected samples compared with their corresponding negative control exhibited a P-value < 0.05 in one-way ANOVA analysis.
To further address the significance of the expression level of p27/kip1 in the CRPC development in LNCaP, we determined the impact of the p27/kip1 expression level on cell growth and cell responses to the DHT treatment. As documented (20), we also found that 5 days after knocking down p27/kip1 by siRNA, the growth of LNCaP was increased by ~2.2 fold, compared to those were mock-transfected or transfected with negative control siRNAs (Fig. 5C). Addition of DHT further increased the growth of p27/kip1-siRNA transfected LNCaP by ~1.2 fold, suggesting that knocking down p27/kip1 was not sufficient to abolish the response of LNCaP to DHT (Fig. 5C). Furthermore, it appeared that either knocking down or over-expressing p27/kip1 had no significant effect on the DHT induced PSA expression in LNCaP (Fig. 5D). Thus, altering the expression level of p27/kip1 alone significantly affects cell growth, though it is not sufficient to completely eliminate the androgen response. In summary, it does not appear that p27/kip1 is the mechanistic target of miR-221/-222 during the development of LNCaP derived CRPC cells; although p27/kip1 may be important for the maintenance of the CRPC phenotype.
Discussion
In the last few years, extensive evidence has demonstrated that miRs play important roles in controlling many fundamental cellular processes and in cancer gene regulation (7, 8). A number of miRs have been identified that function as oncogenes or tumor suppressors; so called oncomirs (9). A profound understanding of the insight of biological mechanisms that a specific miR involved is a pre-requisite for the potential use of miRs and miR related machinery for therapeutic purposes. Despite the extensive studies carried out thus far, relatively little is known about the molecular details on how specific miRs regulate biological pathways.
In this study, we focused on miR expression signatures of CRPC, the lethal phenotype of CaP. Our miR expression profiling identified 7 miRs, miR-221, -222, -15a, -16-1, -203, -23b and -27b, that are differentially expressed in AD, LNCaP and the CRPC, LNCaP-Abl cell lines. We further validated the significance of miR-221 and -222 in the development of androgen resistance in CaP cells, because these two miRs have the highest over-expression in CRPC cells. We showed that transfection of synthetic miR-221 or -222 reduced the DHT-induced growth and the AR-mediated transcription response in LNCaP; transfection of anti-sense miR-221 or -222 restored to a significant extent of the DHT-induced growth and the AR-mediated transcriptional response in LNCaP-Abl. Taken together, our results show that miR-22 and -222 dictate the AR-mediated androgen sensitivity of CaP cells, suggesting their function in controlling the expression of key factors involved in the CRPC development and/or maintenance.
The role of miRs in CaP development and progression has been explored by several other laboratories (25-28). Shi et al. reported that miR-125b is differential expressed in AD (LNCaP) and AI (cds1 and cds2 cell lines) CaP cells and may be involved in the oncogenic process in CaP cells (25). However, no evidence indicating the role of miR-125b in CRPC development was presented. In contrast, our microarray profiling data reproducibly demonstrated that miR-125b expressed at a relatively high and equal level in both LNCaP and LNCaP-Abl cell lines. Lin et al. demonstrated that miR-146a was down-regulated in AI cell lines (PC3 and LNCaP-C4-2B), compared to those in AD cell lines (PC-3-AR9 and LNCaP), respectively (26). They showed that transfection of miR-146a markedly reduced cell proliferation, invasion, and metastasis; and they did not have direct evidence indicating the role of miR-146a in CRPC development. Based on our expression profiling data, we found that miR-146a is expressed at very low levels in LNCaP and its expression was not detectable in LNCaP-Abl. Thus the biological significance of miR-146a in LNCaP and related CaP cell lines remains to be further investigated.
Recent reports revealed that the receptor tyrosine kinase kit-1 and the cyclin-dependent kinase inhibitors, p27/kip1 and p57/kip2 are the functional targets of both miR-221 and -222 (20-22, 24, 30-32). It has been shown that miR-221/-222 inhibit normal erythropoiesis and erythroleukemic cell growth via kit receptor down-regulation (22, 30). However, kit-1 is not expressed in prostate epithelial cells, thus eliminating the possibility of being a target of miR-221/ -222 in CaP cell lines. Loss of p27/kip1 and p57/kip2 expression as a result of up-regulation of miR-221 and miR-222 may stimulate cell proliferation and provide a survival signal by up-regulating G1-S phase transition in the cell cycle (21, 24, 32). Apparently, certain cancer cell lines require high levels of miR-221 and -222 to maintain low level of p27/kip1 to promote cell proliferation. High levels of miR-221 and -222 occur in glioblastomas and in the CaP cell line PC3 and correlate with the expression of p27/kip1. Suppressing miR-221 level in PC3 cells resulted in a growth arrest, which coincided with an up-regulation of p27/kip1 protein, and inability to grow in soft agar. Based on this observation, Galardi et al. speculated that miR-221/222 contributed to prostate oncogenesis and progression via down-regulating p27/kip1 (20). More recently, Garofalo et al. reported that high expression levels of miR-221 and -222 are needed to maintain the resistance to tumor necrosis factor-related apoptosis-inducing ligand (TRAIL) in human non-small cell lung cancer, via the down-regulation of p27/kip1 (33).
In our study, it appeared that the expression levels of p27/kip1 in LNCaP derived CRPC cell lines was not significantly down-regulated by their high levels of miR-221 and -222, compared to those in LNCaP. Indeed, over-expression of miR-221 or -222 can efficiently down-regulate p27/kip1 expression in LNCaP. However down-regulation of p27/kip1 alone did not significantly affect the DHT induction of the AR-mediated expression of PSA in LNCaP. Together, we hypothesize that p27/kip1 may not be the primary factor leading to the development of LNCaP derived CRPC. Currently we do not know the exact miR-221/-222 targets that are involved in the CRPC development in LNCaP-Abl. Nevertheless, the fact that p27/kip1 escapes from the control by miR-221/-222 in LNCaP derived CRPC is intriguing and it may suggest the requirement of p27/kip1 for the maintenance of CRPC. We do not know why and how the expression level of p27/kip1 is not responding to the high level of miR-221/-222 in LNCaP-Abl. It is possible that the 3’ untranslated regions of the p27/kip1 mRNA in LNCaP and LNCaP-Abl may be structurally different, thus potentially presenting different sequences at miRNA target sites. Such mechanisms were described for post-transcriptional control of miR-targets by Sanberg (34). Alternatively, the activity of the RNA-binding protein, such as Dnd1, that counteracts the function of miRNAs may be up-regulated in LNCaP-Abl (35). We are currently investigating these possibilities.
Studies have shown that CaP cells utilize a variety of AR dependent and independent pathways progressing to CRPC. Most miRs have multiple targets ranging from dozens to hundreds and target mRNAs may also be the target of multiple miRs. Thus, it is not surprised that different targets may be involved in the development of different CRPC cells via the same or different miRs. In addition to miR-221 and -222, we also found that miR-15a, -16-1, -203, -23b and -27b are differentially expressed in LNCaP and LNCaP derived CRPC cell lines. We are currently analyzing the role of these miRs in the CRPC development. We believe that our study on these differentially expressed miRs will lead to a better understanding of mechanisms mediating the development and progression of CRPC.
Acknowledgments
This work was supported by a SPORE in Prostate Cancer 2 P50 CA090381-06 and a Prostate Cancer Foundation Challenge Grant.
Abbreviations
- AD
androgen dependent
- AI
androgen independent
- ADT
androgen deprivation therapy
- AR
androgen receptor
- CaP
Prostate cancer
- CRPC
castration resistance prostate cancer
- miR
microRNA
- DHT
dihydrotestosterone
Footnotes
The authors declare no conflict of interests.
Contributor Information
Tong Sun, Department of Medical Oncology, Dana-Farber Cancer Institute and Harvard Medical School, 44 Binney Street, Boston, MA 02115, USA.
Qianben Wang, Department of Medical Oncology, Dana-Farber Cancer Institute and Harvard Medical School, 44 Binney Street, Boston, MA 02115, USA.
Steven Balk, Cancer Biology Program, Department of Medicine, Beth Israel Deaconess Medical Center and Harvard Medical School, 330 Brookline Ave., Boston, MA 02115.
Myles Brown, Department of Medical Oncology, Dana-Farber Cancer Institute and Harvard Medical School, 44 Binney Street, Boston, MA 02115, USA.
Gwo-Shu Mary Lee, Department of Medical Oncology, Dana-Farber Cancer Institute and Harvard Medical School, 44 Binney Street, Boston, MA 02115, USA.
Philip Kantoff, Department of Medical Oncology, Dana-Farber Cancer Institute and Harvard Medical School, 44 Binney Street, Boston, MA 02115, USA.
References
- 1.Huggins CB, Hodges CV. Studies on prostatic cancer. 1. The effect of castration, of estrogen and of androgen injections on serum phosphatases in metastatic carcinoma of the prostate. Cancer Res. 1941;1:293–7. [Google Scholar]
- 2.Feldman BJ, Feldman D. The development of androgen-independent prostate cancer. Nat Rev Cancer. 2001;1:34–45. doi: 10.1038/35094009. [DOI] [PubMed] [Google Scholar]
- 3.Rana TM. Illuminating the silence: understanding the structure and function of small RNAs. Nat Rev Mol Cell Biol. 2007;8:23–36. doi: 10.1038/nrm2085. [DOI] [PubMed] [Google Scholar]
- 4.Glinsky GV. An SNP-guided microRNA map of fifteen common human disorders identifies a consensus disease phenocode aiming at principal components of the nuclear import pathway. Cell Cycle. 2008;7:2570–83. doi: 10.4161/cc.7.16.6524. [DOI] [PubMed] [Google Scholar]
- 5.Kim DH, Sætrom P, Snøve O, Jr, Rossi JJ. MicroRNA-directed transcriptional gene silencing in mammalian cells. Proc Natl Acad Sci U S A. 2008;105:16230–5. doi: 10.1073/pnas.0808830105. [DOI] [PMC free article] [PubMed] [Google Scholar]
- 6.Kloosterman WP, Plasterk RH. The diverse functions of microRNAs in animal development and disease. Dev Cell. 2006;11:441–50. doi: 10.1016/j.devcel.2006.09.009. [DOI] [PubMed] [Google Scholar]
- 7.Bushati N, Cohen SM. microRNA functions. Annu Rev Cell Dev Biol. 2007;23:175–205. doi: 10.1146/annurev.cellbio.23.090506.123406. [DOI] [PubMed] [Google Scholar]
- 8.Calin GA, Croce CM. MicroRNA signatures in human cancers. Nat Rev Cancer. 2006;6:857–66. doi: 10.1038/nrc1997. [DOI] [PubMed] [Google Scholar]
- 9.Esquela-Kerscher A, Slack FJ. Oncomirs - microRNAs with a role in cancer. Nat Rev Cancer. 2006;6:259–69. doi: 10.1038/nrc1840. [DOI] [PubMed] [Google Scholar]
- 10.Yanaihara N, Caplen N, Bowman E, et al. Unique microRNA molecular profiles in lung cancer diagnosis and prognosis. Cancer Cell. 2006;9:189–98. doi: 10.1016/j.ccr.2006.01.025. [DOI] [PubMed] [Google Scholar]
- 11.Roldo C, Missiaglia E, Hagan JP, et al. MicroRNA expression abnormalities in pancreatic endocrine and acinar tumors are associated with distinctive pathologic features and clinical behavior. J Clin Oncol. 2006;24:4677–84. doi: 10.1200/JCO.2005.05.5194. [DOI] [PubMed] [Google Scholar]
- 12.Lu J, Getz G, Miska EA, et al. MicroRNA expression profiles classify human cancers. Nature. 2005;435:834–8. doi: 10.1038/nature03702. [DOI] [PubMed] [Google Scholar]
- 13.Porkka KP, Pfeiffer MJ, Waltering KK, Vessella RL, Tammela TL, Visakorpi T. MicroRNA expression profiling in prostate cancer. Cancer Res. 2007;67:6130–5. doi: 10.1158/0008-5472.CAN-07-0533. [DOI] [PubMed] [Google Scholar]
- 14.Culig Z, Hoffmann J, Erdel M, et al. Switch from antagonist to agonist of the androgen receptor bicalutamide is associated with prostate tumor progression in a new model system. Br J Cancer. 1999;81:242–51. doi: 10.1038/sj.bjc.6690684. [DOI] [PMC free article] [PubMed] [Google Scholar]
- 15.Kokontis JM, Hay N, Liao S. Progression of LNCaP prostate tumor cells during androgen deprivation: hormone-independent growth, repression of proliferation by androgen, and role for p27Kip1 in androgen-induced cell cycle arrest. Mol Endocrinol. 1998;12:941–53. doi: 10.1210/mend.12.7.0136. [DOI] [PubMed] [Google Scholar]
- 16.Klein KA, Reiter RE, Redula J, et al. Progression of metastatic human prostate cancer to androgen independence in immunodeficient SCID mice. Nat Med. 1997;3:402–8. doi: 10.1038/nm0497-402. [DOI] [PubMed] [Google Scholar]
- 17.Horoszewicz JS, Leong SS, Chu TM, et al. The LNCaP cell line--a new model for studies on human prostatic carcinoma. Prog Clin Biol Res. 1980;37:115–32. [PubMed] [Google Scholar]
- 18.Wang Q, Li W, Liu XS, et al. A hierarchical network of transcription factors governs androgen receptor-dependent prostate cancer growth. Mol Cell. 2007;27:380–92. doi: 10.1016/j.molcel.2007.05.041. [DOI] [PMC free article] [PubMed] [Google Scholar]
- 19.Wang Q, Carroll JS, Brown M. Spatial and temporal recruitment of androgen receptor and its coactivators involves chromosomal looping and polymerase tracking. Mol Cell. 2005;19:631–42. doi: 10.1016/j.molcel.2005.07.018. [DOI] [PubMed] [Google Scholar]
- 20.Galardi S, Mercatelli N, Giorda E, et al. miR-221 and miR-222 expression affects the proliferation potential of human prostate carcinoma cell lines by targeting p27Kip1. J Biol Chem. 2007;282:23716–24. doi: 10.1074/jbc.M701805200. [DOI] [PubMed] [Google Scholar]
- 21.le Sage C, Nagel R, Egan DA, et al. Regulation of the p27(Kip1) tumor suppressor by miR-221 and miR-222 promotes cancer cell proliferation. EMBO J. 2007;26:3699–708. doi: 10.1038/sj.emboj.7601790. [DOI] [PMC free article] [PubMed] [Google Scholar]
- 22.Felli N, Fontana L, Pelosi E, et al. MicroRNAs 221 and 222 inhibit normal erythropoiesis and erythroleukemic cell growth via kit receptor down-modulation. Proc Natl Acad Sci U S A. 2005;102:18081–6. doi: 10.1073/pnas.0506216102. [DOI] [PMC free article] [PubMed] [Google Scholar]
- 23.Chu IM, Hengst L, Slingerland JM. The Cdk inhibitor p27 in human cancer: prognostic potential and relevance to anticancer therapy. Nat Rev Cancer. 2008;8:253–67. doi: 10.1038/nrc2347. [DOI] [PubMed] [Google Scholar]
- 24.Medina R, Zaidi SK, Liu CG, et al. MicroRNAs 221 and 222 bypass quiescence and compromise cell survival. Cancer Res. 2008;68:2773–80. doi: 10.1158/0008-5472.CAN-07-6754. [DOI] [PMC free article] [PubMed] [Google Scholar]
- 25.Shi XB, Xue L, Yang J, et al. An androgen-regulated miRNA suppresses Bak1 expression and induces androgen-independent growth of prostate cancer cells. Proc Natl Acad Sci U S A. 2007;104:19983–8. doi: 10.1073/pnas.0706641104. [DOI] [PMC free article] [PubMed] [Google Scholar]
- 26.Lin SL, Chiang A, Chang D, Ying SY. Loss of mir-146a function in hormone-refractory prostate cancer. RNA. 2008;14:417–24. doi: 10.1261/rna.874808. [DOI] [PMC free article] [PubMed] [Google Scholar]
- 27.Volinia S, Calin GA, Liu CG, et al. A microRNA expression signature of human solid tumors defines cancer gene targets. Proc Natl Acad Sci U S A. 2006;103:2257–61. doi: 10.1073/pnas.0510565103. [DOI] [PMC free article] [PubMed] [Google Scholar]
- 28.Reis EM, Nakaya HI, Louro R, et al. Antisense intronic non-coding RNA levels correlate to the degree of tumor differentiation in prostate cancer. Oncogene. 2004;23:6684–92. doi: 10.1038/sj.onc.1207880. [DOI] [PubMed] [Google Scholar]
- 29.He H, Jazdzewski K, Li W, et al. The role of microRNA genes in papillary thyroid carcinoma. Proc Natl Acad Sci U S A. 2005;102:19075–80. doi: 10.1073/pnas.0509603102. [DOI] [PMC free article] [PubMed] [Google Scholar]
- 30.Poliseno L, Tuccoli A, Mariani L, et al. MicroRNAs modulate the angiogenic properties of HUVECs. Blood. 2006;108:3068–71. doi: 10.1182/blood-2006-01-012369. [DOI] [PubMed] [Google Scholar]
- 31.le Sage C, Nagel R, Agami R. Diverse ways to control p27Kip1 function: miRNAs come into play. Cell Cycle. 2007;6:2742–9. doi: 10.4161/cc.6.22.4900. [DOI] [PubMed] [Google Scholar]
- 32.Fornari F, Gramantieri L, Ferracin M, et al. MiR-221 controls CDKN1C/p57 and CDKN1B/p27 expression in human hepatocellular carcinoma. Oncogene. 2008;27:5651–61. doi: 10.1038/onc.2008.178. [DOI] [PubMed] [Google Scholar]
- 33.Garofalo M, Quintavalle C, Di Leva G, et al. MicroRNA signatures of TRAIL resistance in human non-small cell lung cancer. Oncogene. 2008;27:3845–55. doi: 10.1038/onc.2008.6. [DOI] [PubMed] [Google Scholar]
- 34.Sandberg R, Neilson JR, Sarma A, Sharp PA, Burge CB. Proliferating cells express mRNAs with shortened 3’ untranslated regions and fewer microRNA target sites. Science. 2008;320:1643–7. doi: 10.1126/science.1155390. [DOI] [PMC free article] [PubMed] [Google Scholar]
- 35.Kedde M, Strasser MJ, Boldajipour B, et al. RNA-binding protein Dnd1 inhibits microRNA access to target mRNA. Cell. 2007;131:1273–86. doi: 10.1016/j.cell.2007.11.034. [DOI] [PubMed] [Google Scholar]