Abstract
The COPS (Classification Of Protein Structures) web server provides access to the complete repertoire of known protein structures and protein structural domains. The COPS classification encodes pairwise structural similarities as quantified metric relationships. The resulting metrical structure is mapped to a hierarchical tree, which is largely equivalent to the structure of a file browser. Exploiting this relationship we implemented the Fold Space Navigator, a tool that makes navigation in fold space as convenient as browsing through a file system. Moreover, pairwise structural similarities among the domains can be visualized and inspected instantaneously. COPS is updated weekly and stays concurrent with the PDB repository. The server also exposes the COPS classification pipeline. Newly determined structures uploaded to the server are chopped into domains, the locations of the new domains in the classification tree are determined, and their neighborhood can be immediately explored through the Fold Space Navigator. The COPS web server is accessible at http://cops.services.came.sbg.ac.at/.
INTRODUCTION
The PDB repository (1) is a collection of all protein structures determined by experimental techniques. The repository implicitly contains an enormous body of information ranging from evolutionary relationships to the physics of protein folding and as such it is an invaluable resource for protein science. Efficient access to this information requires that the structures are organized and classified according to a set of appropriate rules and principles (2–10).
The COPS (Classification Of Protein Structures) database discussed here uses the structural domains of protein chains as the unit of classification. Pairwise structural similarities among all domains are recorded in terms of quantified metric relationships. The individual domains are then identified with points in a metric space thereby providing a convenient representation of the domains and their relative location in protein fold space.
The execution of this recipe requires several key technologies of structural bioinformatics which in themselves are major research topics. In particular, for the realization of COPS appropriate implementations for automated domain decomposition, pairwise structure comparison, structure search and data structures for appropriate storage and retrieval had to be implemented (8–13).
Besides the technical challenges involved, perhaps the most important aspect of any structure classification is that the complete repertoire of available structures is represented in a way that is accessible and comprehensible to users who are not necessarily experts in the intricacies and problems involved in domain decomposition, structure comparison and the many other obstacles encountered in the implementation of protein classifications. It is therefore imperative that interfaces to structure classifications put the focus on biologically relevant information as opposed to numerical results or implementation details. In particular, proper judgement and interpretation of data retrieved from a classification system require that structural relationships may be visualized instantaneously and that structural neighborhoods can be explored conveniently.
Hence, besides the integrity and correctness of classification data, ease of accessibility and interpretation of the data retrieved are most important ingredients of any classification system. In the present communication we emphasize the COPS system from the user's point of view. With this goal in mind we provide an overview of the main components of COPS and provide instructive examples for data retrieval, analysis and interpretation.
Briefly, the user interface of COPS described here consists of (i) qCOPS (quantitative COPS), the main entry point for the retrieval of classification data for a particular PDB entry, (ii) the Fold Space Navigator, a tool for the efficient exploration of structural neighborhoods and navigation in fold space, (iii) the iCOPS (instant COPS) application, which provides an interface to the classification pipeline of COPS, enabling users to classify new protein structures against all domains in COPS (and hence the complete PDB repository) and (iv) the graphical display of the domain composition of individual proteins by Jmol (http://www.jmol.org/) and the instant visualization of pairwise structural similarities of domains retrieved from COPS using the structure comparison tool TopMatch (11).
METHODS
The COPS web server is implemented using a new collection of libraries from the Adobe® Flex® framework. Flex was initially released for the development of Rich Internet Applications (RIAs) with an emphasis on large datasets. Using this framework, the COPS web server provides a familiar user interface comparable with desktop applications including, for example, extensive search and sort capabilities, drag-and-drop functionality or right mouse button menus.
COPS
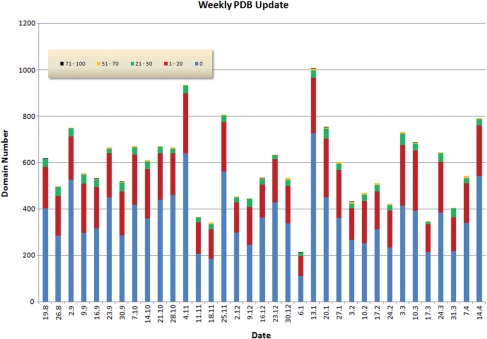
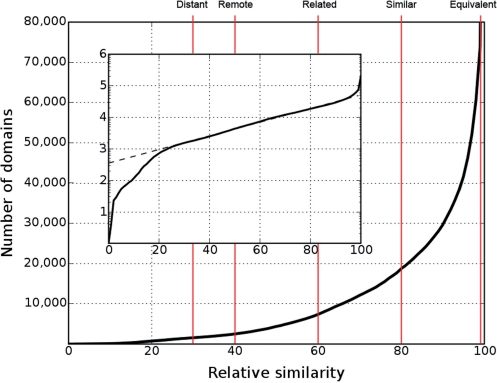
COPS is a fully automated domain-based protein classification that is updated weekly with every PDB release. Figure 1 provides an overview of the distribution of the novelty of structures found in the weekly releases of PDB. Protein domains in COPS are organized as a tree where the domains correspond to tree nodes and pairwise structural similarities among domains correspond to tree edges (10). The edges represent relative similarities among protein domains derived from structure superposition and metric relationships (12). The classification layers of COPS are obtained by cutting the tree at constant relative similarity (10,13). Each cut splits the complete set of domains into families whose members have pairwise mutual similarities larger than indicated by the relative similarity used for the cut. Each family is then represented by a parent node and its members (child nodes). Moreover, each layer is assigned a descriptive name describing the degree of similarities (the cut value) of the child nodes relative to the respective parent node. Currently, the Fold Space Navigator of COPS displays five layers called distant (30% relative similarity), remote (40%), related (60%), similar (80%) and equivalent (99%). The relationship of these layers relative to the growth of the number of distinct families as a function of the relative similarity cut-off is shown in Figure 2. At the time of writing (April 2009) COPS covered 54 981 PDB files consisting of 131 326 chains chopped into 210 913 domains.
Figure 1.
Novelty of structures found in the weekly releases of PDB. The data and graphics are obtained from the COPS web server. The figure covers the period from 19 August 2008 to 14 April 2009. The bars indicate the number of domains found in the weekly releases of PDB (adding to a total of 20 373 domains). Novelty, N, is defined as the number of residues of a new domain that are not covered by the most similar structure already in COPS, divided by the length of the new domain (i.e. expressed as a percentage). A novelty of 20%, for example, indicates that the new domain has a structural similarity to a previously known domain which covers 80% of the new domain, and hence only 20% is new. The coloring used for the bars represents the novelty, i.e. blue corresponds to N = 0 (zero novelty), red to the range 1 ≤ N ≤ 20% and so on, as indicated by the insert. Over the period considered here there are on average five domains per release that have a novelty >50% and 29 domains that have a novelty in the range 21 ≤ N ≤ 50%. Hence, each release adds a significant amount of new structures which is immediately accessible through the COPS web server. On the other hand, there are many structures that are identical (blue, roughly 370 domains per release) or very similar to previously known folds (red, roughly 180 domains per release).
Figure 2.
Number of distinguishable folds (domains) as a function of relative similarity s. As shown in the insert, in the range 20 ≤ s ≤ 95 the logarithm (log10) of the number of distinguishable folds rises linearly as a function of relative similarity s. Hence, within this range the number of distinguishable folds, n, follows an exponential law n ≈ 10λs, where λ is the slope of log10 n in the linear range (9). Red lines denote the relative similarity cut-offs of the layers defined in COPS. The descriptive name of each layer is shown at the top end of the respective line. The names are chosen to relate the numerical definitions to their intuitive meaning (8). The layers may also be referred to by their short names (the character L+the relative similarity: L30, L40, L60, L80, L99).
Technical overview
Adobe Flex (http://flex.org/) is a free open source framework for the development of RIAs. The technology is based on the Adobe Flash® Player (http://www.adobe.com/products/flashplayer/). Users of COPS need to install the Adobe Flash Player (freely available) to load Flex applications. We decided to build on this technology because of the possibilities it offers for the convenient representation of large datasets including data visualization, the high performance of the interface components, the ease of use and the degree of popularity of the Flash Player as a platform for web applications with the look and feel of desktop applications. In particular, fast data exchange is crucial for applications like the COPS web server that has to transfer and deploy a large volume of structural and classification data. Data exchange in the Flex framework can be implemented using the binary Action Message Format (AMF). AMF outperforms other available data exchange technologies like XML-RPC, SOAP or pure XML. For the COPS web server we use AMFPHP (http://www.amfphp.org/) and PyAMF (http://pyamf.org/), two implementations of AMF for PHP (http://www.php.net/) and Python (http://www.python.org/), respectively. The classification data are stored in the relational database PostgreSQL (http://www.postgresql.org/) and queried by AMFPHP and PyAMF.
qCOPS and the Fold Space Navigator
The major entry point to COPS is qCOPS, a query engine which enables a user to search the entire space of known folds and explore the structural neighborhood of individual domains. A query may be specified as a four-letter PDB code (e.g. 1z6t), or as a keyword like Lipase or Coliphage, for example. The result is either a list of all COPS domains for the given PDB code or a list of all domains that match the given keyword. The first domain of the retrieved list is selected and visualized immediately in the context of the respective protein chain. Any other domain found in the list may be visualized by clicking on the respective row.
A central interactive tool used in COPS is the Fold Space Navigator. The Fold Space Navigator represents the hierarchy of COPS. It is implemented in the fashion of a file browser, where folder icons represent family parent nodes on a given layer and the contents of a folder (i.e. the files) correspond to all child nodes (i.e. the complete subtree) of the respective family. The Fold Space Navigator displays the path of the selected domain from the root (no structural similarities) of the hierarchical classification tree down to the equivalent layer (highest structural similarities). The common relationship among the child nodes depends on the selected parent and the associated layer. On the equivalent layer, for example, all domains of a specific family have structural similarity ≥ 99%. The domains of a selected family are displayed in the form of a family table so that the domains can be sorted and grouped in various ways. Immediately after the query has been processed, several actions take place: the matching domains are listed in a result table, the first domain of the list is automatically selected, the equivalent layer in which this domain resides is opened and the respective domains are listed in the family table.
The family table has several columns providing sequence and structure classification information as well as data from the original PDB file. Particularly useful are the columns called S30, S90 and Struct-Id. The keys shown in these columns are derived from the BLASTclust program (ftp://ftp.ncbi.nih.gov/blast/documents/blastclust.html) applied to the sequences of all COPS domains, resulting in clusters of sequences where the pairwise similarity among the sequences within a cluster is >30% (S30) and >90% (S90), respectively. Hence, identical keys in the S30 and S90 columns of the family table reveal domains whose sequences are homologous. The column called Struct-Id contains keys corresponding to the family membership of the domains on the layer below the current layer. Hence, two domains having identical keys in this column are members of the same family on the subordinate layer. Identical keys in the Struct-Id column, therefore, identify domains whose structures are more similar than required by the family threshold.
Initially the content of the table is sorted by S30, S90 and the Struct-Id column in ascending order. This makes it very easy to identify domains with high sequence similarity (same S90 key) but varying structures (different Struct-Id) or vice versa, varying sequences and structural similarities. Moreover, the table can be sorted by any column or even combinations of columns in different sorting directions and the rows can be colored according to the row content. The data shown in the family table can be exported in different file formats.
Straight above the family table is the breadcrumb navigation tool bar of the Fold Space Navigator. The navigation bar displays the path through the nodes starting from the selected parent domain upwards to the root of COPS, i.e. it provides a linear view of the path from a node to the root. Clicking any node in this linear representation opens the respective family table. This is a short cut for the navigation through the layers.
iCOPS
A frequent task in protein structure determination is the characterization of a newly determined protein structure in terms of relationships to the whole repertoire of known structures, i.e. the classification of the new structure relative to all known folds. This task is solved by the iCOPS web service that exposes the COPS classification engine. To use this service, coordinate files in PDB format are uploaded to the iCOPS web server. The chains found in the uploaded file are automatically chopped into domains and the domain decomposition can be visualized in Jmol. Next, for each domain the structural neighbor in COPS is identified and returned on the display list. The classification of a single domain with a size about 100 residues takes usually <30 s and in the meantime any of the other COPS applications can be used. The current processing state of each domain in the classification pipeline is displayed as a set of traffic lights, where red means ‘in queue’, orange is ‘processing’ and green means ‘done’. Once a structural neighbor has been identified, it can be used as a starting point for explorations of the structural neighborhood with the Fold Space Navigator. Additionally, the structural similarities of a chopped domain to its structural neighbors or to any other domain can be visualized with TopMatch.
An example using the COPS web server
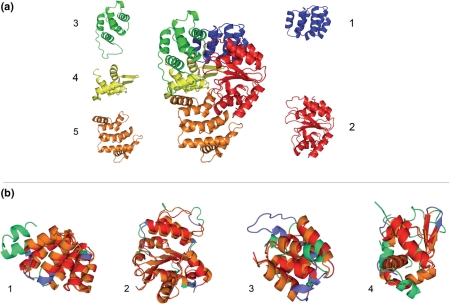
In the following section, we exemplify the usage of qCOPS using the PDB file 1z6t as an example. The file 1z6t represents the structure of the human apoptotic protease-activating factor 1 (Apaf-1) bound to ADP as determined by X-ray diffraction (14). When the PDB code 1z6t is entered and the search button in qCOPS is pressed, the result of the domain decomposition is returned and the 3D structure of each domain is visualized in a Jmol widget. The domain list shows that each of the four chains consists of five domains. The COPS domains agree nicely with the authors' assignments (Figure 3a). The structural redundancy between and within the chains is evident when the list is sorted and colored by the equivalent column. Here, domains three, four and five of all four chains are structurally equivalent, and domains one and two show extensive structural similarities (Figure 3a). Structure comparison of any two domains can conveniently be done by dragging the respective domain names to the Superimposition Box located below the list of domains and clicking the superimpose button, thereby submitting the domains to the TopMatch structure comparison application.
Figure 3.
Automatic domain decomposition (a) and structural neighbors (b) of the human Apaf-1 [PDB code 1z6t (14)] as provided by the COPS web server. (a) Chain A of 1z6t surrounded by the respective domains from the automatic domain decomposition. The colors indicate the position of the domains in the chain and the numbers denote the order on the amino acid sequence from N- to C-terminus. The borders of the chopped domains are in high agreement with the domain decomposition provided by the authors (14). (b) Superimpositions of the first four domains defined in (a) with the respective structural neighbors identified in chain B of the CED-4-CED-9 complex [PDB code 2a5y, (15)] of C. elegans in COPS. The domains of 1z6t are colored blue, domains of 2a5y are colored green and structurally equivalent regions are colored red and orange, respectively. Again, the numbers denote the order on the amino acid sequence from N- to C-terminus. (b1) COPS domain c1z6tA1 (CARD domain) with c2a5yB1, (b2) c1z6tA2 (α/β domain) with c2a5yB2, (b3) c1z6tA3 (helical domain I) with c2a5yB3 and (b4) c1z6tA4 (winged-helix domain) with c2a5yB4. Superimpositions were calculated with TopMatch (11).
For the inspection of the structural neighborhood, we use the Fold Space Navigator to find several close matches for all five domains of Apaf-1. A click on the ‘Similar (L80)’ button in the breadcrumb navigation bar reveals a list of domains having at least 80% relative structural similarity to the selected Apaf-1 domain. In the following, we restrict the discussion to the matches of the first four domains of chain A of Apaf-1 with the domains of chain B of the CED-4-CED-9 complex [PDB code 2a5y (15)] of Caenorhabditis elegans.
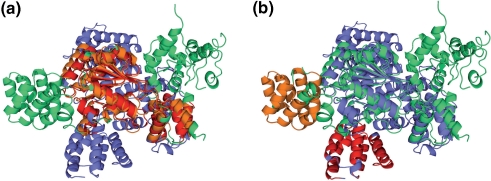
The superimpositions of the domains highlight the extensive structural similarities at low sequence identities (Figure 3b). This may suggest that both chains are superimposeable as a whole. Actually, only two domains of Apaf-1 (c1z6tA2 and c1z6tA3) can be superimposed simultaneously with domains of 2a5y (Figure 4). Obviously, the respective chains have significant conformational changes, possibly because of the binding of ADP instead of ATP. In fact, Riedl et al. (14) propose that Apaf-1 maintains an inactive state through the binding of ADP instead of ATP. A more detailed analysis may prove the functional assignment of the domains of Apaf-1 with the functional details of the CED-4-CED-9 complex. For example, a detailed look at the structure-based sequence alignments reveals the conservation of most of the residues that are crucial for ADP and ATP binding, respectively. A cross-check confirms that the domains of 1z6t and 2a5y are assigned equally in the original publications.
Figure 4.
Superimposition of chains 1z6t-A and 2a5y-B. Both chains are not superimposeable as a whole, although the constituting domains have considerable structural similarities (Figure 3b). The TopMatch algorithm (11) provides several solutions (alternative alignments) for the comparison of two protein structures, which is most auxiliary in the current example where chains have undergone major conformational changes. (a) Alignment with c1z6tA2 and c1z6tA3 superimposed on domains c2a5yB2 and c2a5yB3. (b) Alternative alignment, showing structural equivalences of c1z6tA1 (red) and domain c2a5yB1 (orange) while the chains remain in the superimposition displayed in Figure 4a.
There are further interesting relationships found on this layer that can be explored along the same lines. Rather than following these threads, we move up in the hierarchy of c1z6tA2 to find an even broader range of structural relationships on the remote layer. Here we find domains from all kingdoms, archaea, eubacteria, eukaryota and viruses, including, for example, the domain c1w5tA2 of the ORC2 protein of the archaeon Aeropyrum pernix [PDB code 1w5t, (16)]. Superimposition with c1z6tA2 shows a significant conservation of a three-layered α/β fold with 64% relative similarity but only 11% sequence identity. Furthermore, the remaining two domains of chain A of 1w5t can be superimposed on domains three (c1w5tA1-c1z6tA3) and four (c1w5tA3-c1z6tA4) of Apaf-1, respectively. In contrast to the four domains of chain B of the CED-4-CED-9 complex, chain A of the ORC2 protein consists of only three domains. Again, the chain is not superimposeable as a whole with chain A of 1z6t. In this case, only domains two (c1w5tA2) and one (c1w5tA1) are simultaneously superimposeable with domains two (c1z6tA2) and three (c1z6tA3) of 1z6t. Additionally, the nucleotide binding domain of 1z6t (c1z6tA2) can be found not only in complexes, but also in single chain domains from Escherichia coli [1jbk (17)] or the structural genomics target 2p65 from Plasmodium falciparum (A.K. Wernimont et al., submitted for publication).
CONCLUSION
The few examples presented here demonstrate how an enormous number of biologically relevant relationships can be discovered quickly using the COPS server. It is also clear that such explorations require efficient tools to find the desired pieces of information. To highlight this point, one has to compare the ease of use of the COPS server to the effort required when the respective information is collected using the variety of diverse and disparate tools available in structural bioinformatics. In the development of COPS our particular goal is to make protein structures accessible to the large number of biologists who need efficient access to relevant structural information.
FUNDING
Fonds zur Förderung der wissenschaftlichen Forschung Austria (Grant number P21294). Funding for open access charge: University of Salzburg.
Conflict of interest statement. None declared.
ACKNOWLEDGEMENTS
The structure superposition program TopMatch used to construct COPS is provided by Proceryon Science for Life GmbH (http://www.proceryon.com) under an academic license agreement which is gratefully acknowledged. All images of protein structures were prepared using PyMol (http://www.pymol.org).
REFERENCES
- 1.Berman HM, Westbrook J, Feng Z, Gilliland G, Bhat TN, Weissig H, Shindyalov IN, Bourne PE. The Protein Data Bank. Nucleic Acids Res. 2000;28:235–242. doi: 10.1093/nar/28.1.235. [DOI] [PMC free article] [PubMed] [Google Scholar]
- 2.Murzin AG, Brenner SE, Hubbard T, Chothia C. SCOP: a structural classification of proteins database for the investigation of sequences and structures. J. Mol. Biol. 1995;247:536–540. doi: 10.1006/jmbi.1995.0159. [DOI] [PubMed] [Google Scholar]
- 3.Orengo CA, Michie AD, Jones S, Jones DT, Swindells MB, Thornton JM. CATH–a hierarchic classification of protein domain structures. Structure. 1997;5:1093–1108. doi: 10.1016/s0969-2126(97)00260-8. [DOI] [PubMed] [Google Scholar]
- 4.Holm L, Sander C. The FSSP database of structurally aligned protein fold families. Nucleic Acids Res. 1994;22:3600–3609. [PMC free article] [PubMed] [Google Scholar]
- 5.Krissinel E, Henrick K. Secondary-structure matching (SSM), a new tool for fast protein structure alignment in three dimensions. Acta Crystallogr. D Biol. Crystallogr. 2004;60:2256–2268. doi: 10.1107/S0907444904026460. [DOI] [PubMed] [Google Scholar]
- 6.Holm L, Kääriäinen S, Rosenström P, Schenkel A. Searching protein structure databases with DaliLite v.3. Bioinformatics. 2008;24:2780–2781. doi: 10.1093/bioinformatics/btn507. [DOI] [PMC free article] [PubMed] [Google Scholar]
- 7.Marti-Renom MA, Pieper U, Madhusudhan MS, Rossi A, Eswar N, Davis FP, Al-Shahrour F, Dopazo J, Sali A. DBAli tools: mining the protein structure space. Nucleic Acids Res. 2007;35:W393–W397. doi: 10.1093/nar/gkm236. [DOI] [PMC free article] [PubMed] [Google Scholar]
- 8.Suhrer SJ, Wiederstein M, Sippl MJ. QSCOP – SCOP quantified by structural relationships. Bioinformatics. 2007;23:513–514. doi: 10.1093/bioinformatics/btl594. [DOI] [PubMed] [Google Scholar]
- 9.Sippl MJ. Fold space unlimited. Curr. Opin. Struct. Biol. 2009 doi: 10.1016/j.sbi.2009.03.010. In press. [DOI] [PubMed] [Google Scholar]
- 10.Sippl MJ, Suhrer SJ, Gruber M, Wiederstein M. A discrete view on fold space. Bioinformatics. 2008;24:870–871. doi: 10.1093/bioinformatics/btn020. [DOI] [PubMed] [Google Scholar]
- 11.Sippl MJ, Wiederstein M. A note on difficult structure alignment problems. Bioinformatics. 2008;24:426–427. doi: 10.1093/bioinformatics/btm622. [DOI] [PubMed] [Google Scholar]
- 12.Sippl MJ. On distance and similarity in fold space. Bioinformatics. 2008;24:872–873. doi: 10.1093/bioinformatics/btn040. [DOI] [PubMed] [Google Scholar]
- 13.Suhrer SJ, Gruber M, Sippl MJ. QSCOP-BLAST–fast retrieval of quantified structural information for protein sequences of unknown structure. Nucleic Acids Res. 2007;35:W411–W415. doi: 10.1093/nar/gkm264. [DOI] [PMC free article] [PubMed] [Google Scholar]
- 14.Riedl SJ, Li W, Chao Y, Schwarzenbacher R, Shi Y. Structure of the apoptotic protease-activating factor 1 bound to ADP. Nature. 2005;434:926–933. doi: 10.1038/nature03465. [DOI] [PubMed] [Google Scholar]
- 15.Yan N, Chai J, Lee ES, Gu L, Liu Q, He J, Wu J.-W, Kokel D, Li H, Hao Q, et al. Structure of the CED-4-CED-9 complex provides insights into programmed cell death in Caenorhabditis elegans. Nature. 2005;437:831–837. doi: 10.1038/nature04002. [DOI] [PubMed] [Google Scholar]
- 16.Singleton MR, Morales R, Grainge I, Cook N, Isupov MN, Wigley DB. Conformational changes induced by nucleotide binding in Cdc6/ORC from Aeropyrum pernix. J. Mol. Biol. 2004;343:547–557. doi: 10.1016/j.jmb.2004.08.044. [DOI] [PubMed] [Google Scholar]
- 17.Li J, Sha B. Crystal structure of E. coli Hsp100 ClpB nucleotide-binding domain 1 (NBD1) and mechanistic studies on ClpB ATPase activity. J. Mol. Biol. 2002;318:1127–1137. doi: 10.1016/S0022-2836(02)00188-2. [DOI] [PubMed] [Google Scholar]


