Abstract
MolLoc stands for Molecular Local surface comparison, and is a web server for the structural comparison of molecular surfaces. Given two structures in PDB format, the user can compare their binding sites, cavities or any arbitrary residue selection. Moreover, the web server allows the comparison of a query structure with a list of structures. Each comparison produces a structural alignment that maximizes the extension of the superimposition of the surfaces, and returns the pairs of atoms with similar physicochemical properties that are close in space after the superimposition. Based on this subset of atoms sharing similar physicochemical properties a new rototranslation is derived that best superimposes them. MolLoc approach is both local and surface-oriented, and therefore it can be particularly useful when testing if molecules with different sequences and folds share any local surface similarity. The MolLoc web server is available at http://bcb.dei.unipd.it/MolLoc.
INTRODUCTION
Structural comparison is used extensively to determine the function of proteins, and to study the interactions between proteins and nucleic acids. Most of the tools currently available are for global structural comparison. For instance, SSAP (1), STRUCTAL (2), DALI (3), LSQMAN (4), CE (5) and SSM (6) find the rototranslation of two given structures that maximizes the number of residues that are close after the global alignment (7). Moreover, the molecule is often represented by its atoms or a subset of its atoms (e.g. Cα atoms), which is a simplified representation of the molecular structure.
In this article, we introduce MolLoc (Molecular Local), a web server for the recognition of similar regions on molecular surfaces. The surfaces may be restricted to cavities, binding sites or any residue selection of complete protein, RNA or DNA. The server determines the most extended similar regions of the selected surfaces. This application can be particularly useful when the user is interested in inferring functional information for a molecule, be it a protein, RNA or DNA. First, if the molecule has a binding site, the surface comparison of its binding site with binding sites of other molecules can identify potential ligands or inhibitors to use within its binding site. Second, if the molecule has no known binding sites but has a set of functionally relevant residues, the comparison of these residues with other binding sites can suggest new ligands for these residues. Third, if the molecule has no functional characterization at all, comparing its cavities with other binding sites can provide clues to the molecular function, since binding sites usually lie in cavities (8,9).
Available tools that provide related facilities are Multibind (10), 3D-surfer (11), eF-seek (12) and FunClust (13). Multibind (http://bioinfo3d.cs.tau.ac.il/MultiBind/) recognizes spatial chemical binding patterns common to a set of protein structures. It handles several proteins at once but, like eF-seek (http://ef-site.hgc.jp/eF-seek/index.jsp), aligns binding sites only. 3D-surfer (http://dragon.bio.purdue.edu/3d-surfer/) performs a comparison of a query protein surface against all protein structures in the PDB and retrieves those with highest global surface similarity with the query. It establishes global surfaces similarity but, unlike MolLoc, does not search for local surface regions corresponding to candidate binding sites. FunClust (http://pdbfun.uniroma2.it/funclust/) takes as input a list of proteins and identifies a set of shared residues. It matches proteins based on a local structural representation, not on surface information as in MolLoc.
MATERIALS AND METHODS
Input data
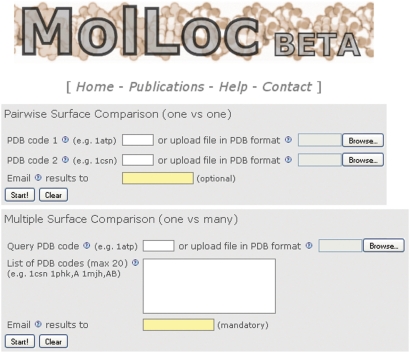
MolLoc can perform pairwise surface comparison of two structures, or multiple pairwise surface comparison of a query structure with a list of structures (Figure 1).
Figure 1.
Home page of MolLoc. The user can run a pairwise surface comparison between two structures, or a multiple pairwise surface comparison between a query structure and a list of structures from the PDB. In the latter case, the email address is mandatory.
Pairwise surface comparison
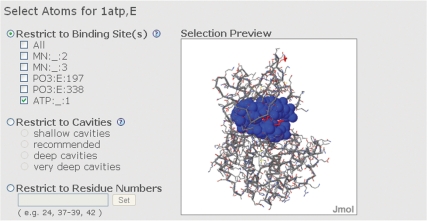
In the pairwise surface comparison, MolLoc takes in input the coordinate files of two molecules in PDB format (14). The user can either insert the pdb-ids of structures that belong to the PDB or upload his/her own structures. Optionally, the user can write his/her email address, to receive a link to the results at the end of the computation. Next, the user specifies one or more chains from each structure. The third step is the selection of the regions to compare (Figure 2). For each structure, the user can select one or more binding sites, cavities or any set of residues. A ligand is an HETATM residue different than HOH in the pdb file, and the binding site for a ligand L in a structure S is defined as the subset of atoms of S that are closer than 6 Å to at least one atom of L. The cavities are generated with different depths, ranging from shallow cavities to very deep cavities. Each structure is associated to a Jmol visualization (15), thus enabling the user to visualize the selected regions. Finally, the user can choose the comparison method. The method called only geometry does not make use of any physicochemical property, while the method called geometry + atomtype starts from the rototranslation obtained with the purely geometrical method and iteratively refines it by matching pairs of atoms with the same atomtype, as specified in (16). The atomtypes are defined only for protein atoms, and therefore the second method is specific for the comparison of two proteins.
Figure 2.
Atoms selection. The user has to provide a nonempty selection of atoms for each structure.
Multiple pairwise surface comparison
MolLoc also allows multiple pairwise surface comparison of one query structure with up to 20 other structures. Here, the email address is mandatory. For the query structure, the user can still specify a PDB ID or upload a structure. The preprocessing phase (chain selection and atoms selection) works like in the pairwise case. The list of other structures must belong to the PDB, and the user can specify the chain(s) using the syntax pdb_id,chain(s) (e.g. 1atp, EI). For these other structures, MolLoc automatically selects all of their binding sites for comparison with the query structure.
Processing method
The web server is built upon a method for the discovery of similar regions on two molecular surfaces based on a spin-image representation of the surfaces (17). Given two structures, the only geometry method:
builds their Connolly's molecular surfaces (18);
builds the spin-image representations of Connolly's points (19);
compares the spin images of the atoms of the two surfaces, and puts them in correspondence if their correlation is high (>0.5);
finds sets of geometrically consistent correspondences using a greedy procedure;
the largest set of correspondences represents the best solution;
the obtained point correspondences are given as input to the Horn method (20) that produces the best rototranslation that superimposes the two regions.
The geometry + atomtype method takes as input the superimposition obtained with the only geometry method, and checks for atoms of the first structure that are closer than 2.5 Å to at least one atom with the same atomtype (16) belonging to the second structure. The atomtypes are defined for protein atoms only, and correspond to the following properties: hydrogen-bond donor (DON), hydrogen-bond acceptor (ACC), mixed donor/acceptor (DAC), hydrophobic aliphatic (ALI) and aromatic contacts (PI). Then, the method keeps all the pairs of atoms that are unambiguous, where a pair (Ai, Bj) of atoms Ai in the first structure and Bj in the second structure is unambiguous if Bj is the only atom that is closer than 2.5 Å to Ai, and vice versa. These n pairs are given in input to the Horn's method, that produces a second rototranslation. Again, the method checks for unambiguous atom pairs. If the number m of the new set of pairs is such that m > n, then the procedure iterates (for a maximum of 10 steps), else it stops.
The cavity detection procedure is a novel method that allows the fast determination of cavities with adjustable depth. The method consists of the following steps:
for each atom i belonging to the surface, count the number of atom centers NC(i) that lie within a radius R from the center of i;
the cavity atoms are defined as those atoms i s.t. NC(i) ≥ μ(NC) + ξσ(NC), where μ(NC) is the mean, σ(NC) is the standard deviation and ξ = 0.5.
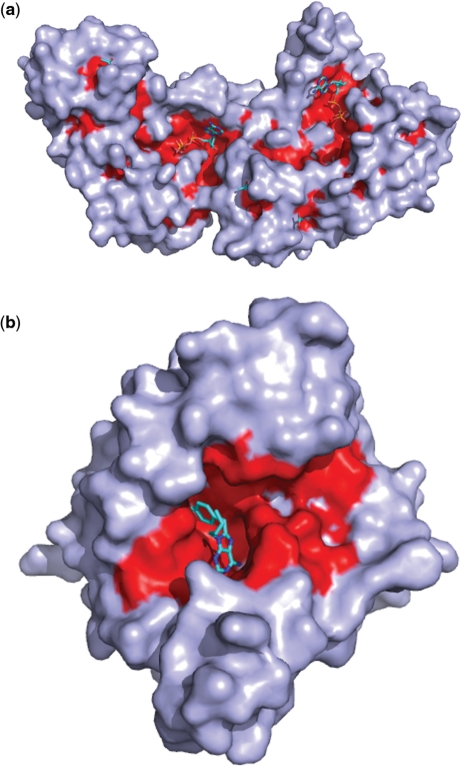
The cavity size and topology depends on the value of radius R (Figure 3). In MolLoc, the choices are R = 4, 8, 12, 20, where R = 4 is for shallow cavities and R = 20 is for very deep cavities.
Figure 3.
(a) Cavities of cystic fibrosis transmembrane conductance regulator with R = 12; (b) cavity of the human chaperon hsp90 with R = 20.
Output of the web server
The top of the results page presents the statistics of the experiment: number of selected input atoms in each structure, ratio of corresponding surface area to the selected input surface area in each structure, number of corresponding atoms with the same atomtype between the two structures, together with their RMSD. Furthermore, the page allows the download of the first PDB file by clicking on its protein name at the top of the right-hand column, the second PDB file rototranslated after the superimposition by clicking on its protein name in the right-hand column, the matrix of rototranslation in DaliLite (21) format, the table of atom correspondences and a PyMol (22) script that shows the pairs of surface points that generated the superimposition of the second structure onto the first.
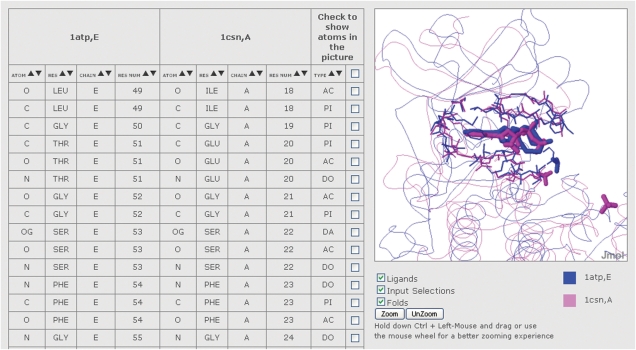
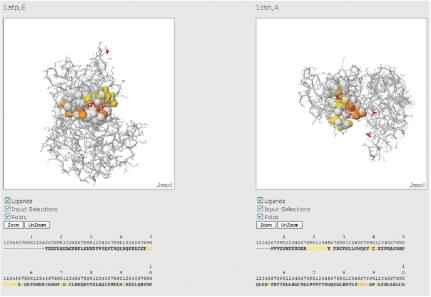
Below, the results page (Figure 4) presents a Jmol visualization of the two superimposed structures, and a table containing the correspondences between the atoms of the two structures with the same atomtype and closer than 2.5 Å after the superimposition. Each pair of corresponding atoms can be visualized in spacefill by clicking on its check box in the right-hand column of the table. (All the corresponding atoms can be simultaneously selected by clicking at the top of this column.) There is also a side-by-side view of the two structures where the regions that are found as similar by the comparison are colored with a gradient from Nter to Cter (Figure 5). Below the two structures are the residues of the two sequences and the residues of each sequence that belong to the solution have the same color as in the Jmol visualization.
Figure 4.
Alignment obtained from the comparison between the binding sites of 1atp, chain E and of 1csn, chain A. The table on the left shows the atom correspondences. When a box is checked, the relative pair of atoms is shown in spacefill.
Figure 5.
Side-by-side view of 1atp, chain E and 1csn, chain A. The atoms that belong to the solution are colored following a gradient from the N-terminal (yellow) to the C-terminal (red). For each structure, the residues that belong to the solution are colored according to the colors in the Jmol visualization.
The results of the multiple pairwise surface comparison are summarized in a table sorted by number of corresponding atoms for each pair. Each structure in the left-hand column is linked with the page that stores the results of the comparison between that structure and the query structure.
A note on chain selection
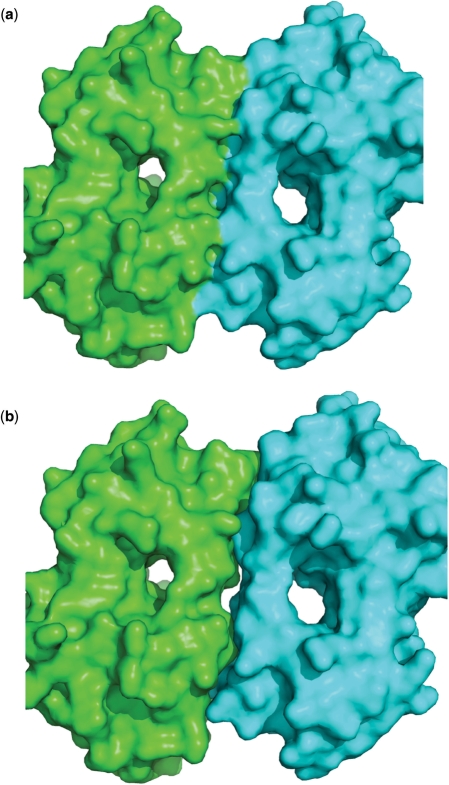
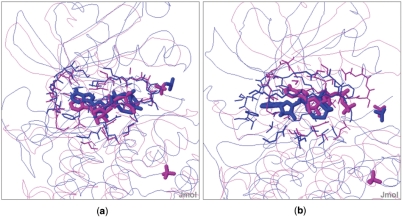
Users have to keep in mind a caveat when dealing with chain selection for a structure with multiple chains. That is, the surface representation of two contiguous chains is different from the surface representation of each of the two chains separately (Figure 6), and therefore the result of the comparison can be different. For example, the molecular surface of 1atp, chain E, is different from the molecular surface of 1atp, chains E and I. In fact, the ATP binding pocket of 1atp,E is an open cavity, while the ATP binding pocket of 1atp,EI is an internal cavity. Hence, the two surfaces are different and the optimal alignment between the ATP binding pockets of 1atp,EI (both chains) and of 1csn,A is slightly different from the optimal alignment between the ATP binding pockets of 1atp,E (only one chain) and of 1csn,A (Figure 7). In this example, the solution of the comparison between 1atp,EI and 1csn,A contains only corresponding atoms from chain E on structure 1atp. The web server gives a warning message, telling the user that the alignment may change if run again on a single chain (in this case chain E) of a multiple chain protein.
Figure 6.
PDB structure 104l. (a) Surface representation of the two chains together. (b) Surface representation of the two chains separately. The two representations differ in the interface between the two chains.
Figure 7.
1atp in purple, 1csn in blue. (a) The result of the comparison between 1atp,E and 1csn,A. (b) The result of the comparison of both chains of 1atp (E and I) with 1csn,A. In this case, differences in the initial surface lead to differences in the surface alignment.
PERFORMANCE
MolLoc web server uses several different software modules to build the surface representation, find the binding sites and the cavities, and to compare the surfaces.
The surface determination routine scales linearly with the number of atoms, ranging from a few seconds for ordinary structures (e.g. 1atp, chain E) to minutes for huge macromolecular complexes (e.g. 1aei, all chains). Therefore, each time the user provides one or more new chains from the PDB, their surface representations are saved into an internal database, to avoid rebuilding when the same chains are invoked again.
The surface comparison routine is the most time-consuming module on the web server. Its time complexity is O(n × m), where n,m are the number of atoms selected in the first and the second structure. The execution time ranges from a few seconds for comparison of medium-sized binding sites (e.g. the binding site of ATP in 1atp,E with the binding site of ATP in 1csn,A) to minutes for comparison of extended areas (e.g. residues 15–350 of 1atp,E with residues 6–298 of 1csn,A).
CONCLUSION
We have presented MolLoc, a new server for the structural comparison of molecular surfaces. The server allows comparison of binding sites, cavities and any arbitrary residue selection. The adopted approach is both local and surface-oriented, and therefore it can be particularly useful when testing if molecules with different sequences and folds share any local surface similarity.
FUNDING
Funding for open access charge: Progetto di Ateneo, Universita' degli Studi di Padova, and Progetto CARIPARO, Padova.
Conflict of interest statement. None declared.
REFERENCES
- 1.Orengo CA, Taylor WR. SSAP: sequential structure alignment program for protein structure comparison. Methods Enzymol. 1996;266:617–635. doi: 10.1016/s0076-6879(96)66038-8. [DOI] [PubMed] [Google Scholar]
- 2.Gerstein M, Levitt M. Comprehensive assessment of automatic structural alignment against a manual standard, the scop classification of proteins. Protein Sci. 1998;7:445–456. doi: 10.1002/pro.5560070226. [DOI] [PMC free article] [PubMed] [Google Scholar]
- 3.Holm L, Sander C. Dali: a network tool for protein structure comparison. Trends Biochem. Sci. 1995;20:478–480. doi: 10.1016/s0968-0004(00)89105-7. [DOI] [PubMed] [Google Scholar]
- 4.Kleywegt GJ. Use of non-crystallographic symmetry in protein structure refinement. Acta Crystallogr. D. 1996;D52:842–857. doi: 10.1107/S0907444995016477. [DOI] [PubMed] [Google Scholar]
- 5.Shindyalov IN. Protein structure alignment by incremental combinatorial extension (CE) of the optimal path. Protein Eng. Des. Sel. 1998;11:739–747. doi: 10.1093/protein/11.9.739. [DOI] [PubMed] [Google Scholar]
- 6.Krissinel E, Henrick K. Acta Crystallographica Section D: Biological Crystallography. Vol. 60. International Union of Crystallography; 2004. Secondary-structure matching (SSM), a new tool for fast protein structure alignment in three dimensions; pp. 2256–2268. [DOI] [PubMed] [Google Scholar]
- 7.Novotny M, Madsen D, Kleywegt GJ. Evaluation of protein fold comparison servers. Proteins Struct. Funct. Bioinform. 2004;54:260–270. doi: 10.1002/prot.10553. [DOI] [PubMed] [Google Scholar]
- 8.Glaser F, Morris RJ, Najmanovich RJ, Laskowski RA, Thornton JM. A method for localizing ligand binding pockets in protein structures. Proteins. Struct. Funct. Bioinform. 2006;62:479–488. doi: 10.1002/prot.20769. [DOI] [PubMed] [Google Scholar]
- 9.Bock ME, Garutti C, Guerra C. Computational Systems Bioinformatics: Proceedings of the CSB 2007 Conference. London: Imperial College Press; 2007. Effective labeling of molecular surface points for cavity detection and location of putative binding sites; pp. 263–274. [PubMed] [Google Scholar]
- 10.Shatsky M, Shulman-Peleg A, Nussinov R, Wolfson HJ. Lecture Notes in Computer Science. Vol. 3500. Springer; 2005. Recognition of binding patterns common to a set of protein structures; pp. 440–455. [Google Scholar]
- 11.Sael L, La D, Li B, Rustamov R, Kihara D. Rapid comparison of properties on protein surface. Proteins Struct. Funct. Bioinform. 2008;73:1–10. doi: 10.1002/prot.22141. [DOI] [PMC free article] [PubMed] [Google Scholar]
- 12.Kinoshita K, Murakami Y, Nakamura H. eF-seek: prediction of the functional sites of proteins by searching for similar electrostatic potential and molecular surface shape. Nucleic Acids Res. 2007;35:W398–W402. doi: 10.1093/nar/gkm351. [DOI] [PMC free article] [PubMed] [Google Scholar]
- 13.Ausiello G, Gherardini PF, Marcatili P, Tramontano A, Via A, Helmer-Citterich M. FunClust: a web server for the identification of structural motifs in a set of non-homologous protein structures. BMC Bioinformatics. 2008;9:S2. doi: 10.1186/1471-2105-9-S2-S2. [DOI] [PMC free article] [PubMed] [Google Scholar]
- 14.Berman HM, Battistuz T, Bhat TN, Bluhm WF, Bourne PE, Burkhardt K, Feng Z, Gilliland GL, Iype L, Jain S, et al. The protein data bank. Acta Crystallogr. D. 2002;D58:899–907. doi: 10.1107/s0907444902003451. [DOI] [PubMed] [Google Scholar]
- 15.Herraez A. Biomolecules in the computer: Jmol to the rescue. Biochem. Mol. Biol. Educ. 2006;34:255–261. doi: 10.1002/bmb.2006.494034042644. [DOI] [PubMed] [Google Scholar]
- 16.Schmitt S, Kuhn D, Klebe G. A new method to detect related function among proteins independent of sequence and fold homology. J. Mol. Biol. 2002;323:387–406. doi: 10.1016/s0022-2836(02)00811-2. [DOI] [PubMed] [Google Scholar]
- 17.Bock ME, Garutti C, Guerra C. Discovery of similar regions on protein surfaces. J. Comput. Biol. 2007;14:285–299. doi: 10.1089/cmb.2006.0145. [DOI] [PubMed] [Google Scholar]
- 18.Connolly ML. Analytical molecular surface calculation. J. Appl. Crystallogr. 1983;16:548–558. [Google Scholar]
- 19.Johnson AE, Hebert M. Using spin images for efficient object recognition in cluttered 3Dscenes. IEEE Trans. Pattern Anal. Mach. Intell. 1999;21:433–449. [Google Scholar]
- 20.Horn BKP. Closed-form solution of absolute orientation using unit quaternions. J. Opt. Soc. Am. A. 1987;4:629–642. [Google Scholar]
- 21.Holm L, Park J. Bioinformatics. Vol. 16. Oxford University Press; 2000. DaliLite workbench for protein structure comparison; pp. 566–567. [DOI] [PubMed] [Google Scholar]
- 22.DeLano WL. CA, USA,: DeLano Scientific, San Carlos; 2002. The PyMOL molecular graphics system. Available at http://pymol.sourceforge.net/faq.html#CITE. [Google Scholar]


