

Abstract
Current treatments of sBL are associated with severe toxicities. A better understanding of sBL formation would facilitate development of less toxic therapies. The etiology of sporadic Burkitt’s lymphoma (sBL) remains however largely unknown, being C-MYC up-regulation the only lesion known to occur in all sBL cases. Several studies examining the role of C-MYC in the pathogenesis of BL have concluded that C-MYC translocation is not the only critical event and that additional unidentified factors are expected to be involved in the formation of this tumor. We herein report that a gene distinct from C-MYC, E2F1, is involved in the formation of all or most sBL tumors. We found that E2F1 is highly expressed in Burkitt’s lymphoma cell lines and sBL lymphoma specimens. Our data indicate that its elevated expression is not merely the consequence of the presence of more cycling cells in this tumor relative to other cell lines or to other neoplasias. In fact, we show that reduction of its expression in sBL cells inhibits tumor formation and decreases their proliferation rate. We also provide data suggesting that E2F1 collaborates with C-MYC in sBL formation. E2F1 expression down-regulation did not affect, however, proliferation of human primary diploid fibroblasts. Since E2F1 is not needed for cell proliferation of normal cells, our results reveal E2F1 as a promising therapeutic target for sBL.
Keywords: Burkitt’s Lymphoma, E2F1, Cancer, Cell cycle
INTRODUCTION
Burkitt’s lymphoma (BL) is a highly aggressive form of mature B-cell non-Hodgkin’s lymphoma that shows a rapid clinical progression (1). It is a rapidly fatal tumor if untreated, but it is curable with highly aggressive short-term combination chemotherapy (2). Prophylactic intrathecal chemotherapy or systemic chemotherapy that crosses the blood-brain barrier is necessary in most cases because of the high risk of central nervous system involvement (2). Unfortunately, the toxicities reported from these intensive therapies are significant, including neurotoxicities from intratechal therapy, hematological toxicity, severe mucositis, cardiac disease, and infertility (3). Patients would therefore benefit from novel therapies aiming at specific molecular targets.
Three clinical variants are recognized by the World Health Organization classification: endemic, sporadic, and immunodeficiency-associated. The characteristic genetic marker of BL cells is a reciprocal translocation involving the C-MYC gene and one of three immunoglobulin gene loci, that leads to deregulated c-myc expression (4). However, several studies examining the role of C-MYC in the pathogenesis of BL have concluded that C-MYC translocation is not the only critical event (5). Hence, additional factors are expected to cooperate with C-MYC in BL lymphomagenesis.
The E2F family of transcription factors is essential for the regulation of cell growth and plays an important role in almost every phase of the cell cycle (6, 7). Eight different E2F genes (E2F1 to E2F8) and three different DP genes belong to this family in mammals. E2F factors are divided between transcriptional activators (E2F1, E2F2, and E2F3a) and transcriptional repressors (E2F3b and E2F4 to E2F8). The role of E2F family members in tumor formation has been extensively studied in rodent models. Results from these studies indicate that E2F factors show bimodal actions in these systems, functioning either as oncogenes or as tumor-suppressors. However, it remains largely unknown how E2F family members affect human tumors. Several groups have found that E2F1 is over-expressed in lung, breast, thyroid, and pancreatic tumors as a consequence of the fact that they contain more cycling cells relative to other neoplasias or to normal tissues (7, 8). Results from other groups suggest that E2F1 might behave as a tumor suppressor gene for several human neoplasias, such as large B-cell lymphomas, colon, prostate, lung, and invasive bladder cancer (8). However, to the best of our knowledge, evidence that over-expression of any E2F family member is required for human tumor formation has not yet been reported.
To gain insight into the molecular basis of sBL tumor formation we looked for genes whose expression was deregulated in most sBL cases and may therefore have a role in lymphomagenesis. Because the activator members of the E2F family of transcription factors can behave like oncogenes in mouse models, we hypothesized that these factors might also play an oncogenic role in some human tumors. We therefore investigated the role of activator E2F factors in sBL tumor formation and found that E2F1 is involved in the formation of all or most sBL tumors. Thus, we determined that E2F1 is over-expressed in sBL tumor samples and that its elevated expression is not merely the consequence of the presence of more cycling cells in this tumor relative to other neoplasias. Instead, we found that E2F1 enhanced expression in BLs is functionally relevant to the tumor phenotype since reduction of its expression in sBL cells inhibits their growth capacity and their tumor formation capabilities. Our data also suggest that E2F1 enhanced expression cooperates with c-myc in sBL lymphomagenesis.
MATERIALS AND METHODS
Northern blotting and quantitative PCR analysis
Northern blotting was performed as previously described (9) using 32P-labeled 5’ E2F1 and γ-actin DNA fragments. Real-time quantitative RT-PCR (q-PCR) was performed as described (9) using primers and probes specific for human E2F1 and β-ACTIN (Applied Biosystems, Foster City, CA). β-ACTIN was chosen as a control gene on the basis of its homogeneous expression in tissue specimens. Calculations were made from measurements of 3 replicates of each sample. Results were normalized and analyzed using sequence-detector software (Applied Biosystems).
Patients and cells
All cases were obtained from the Spanish Tumor Bank Network of the Centro Nacional de Investigaciones Oncológicas (CNIO). Institutional Review Board approval was obtained for these studies and all participants provided written informed consent. Biopsy specimens from different lymphoma cases were reviewed by M.A. Piris and his team of expert hematopathologists using the criteria of the World Health Organization (10). Thirthy specimens corresponding to sBL from patients that were not immunocompromised, together with reactive lymph nodes and tonsils and biopsy specimens from Mantle Cell Lymphoma (MCL), Splenic Marginal Zone Lymphoma (SMZL), Diffuse Large B-Cell Lymphoma (DLBCL), and Follicular Lymphoma cases were finally selected.
BL cell lines Raji, Rael, Mutu, Akata, BL2, Ramos, and DG75, as well as Lymphoblastoid B-cell lines (LCL) X50-7, JY, Dana, and IB4 were cultured in RPMI-1640, whereas human kidney 293-T and human primary diploid fibroblasts Imr-90 cells were cultured in Dulbecco’s modified Eagle medium. Both media were supplemented with 10% FCS (GIBCO, Invitrogen Corp.), 2mM glutamine, 100U/ml penicillin, and 100μg/ml streptomycin.
Lentivirus production and infections
Human kidney 293-T cells were co-transfected with MISSION pLKO.1-puro-based vectors (Sigma-Aldrich; St. Louis, Missouri), psPAX2 packaging vector, and pMD2G-VSVG envelope plasmid using calcium-phosphate DNA precipitation (11). MISSION pLKO.1-puro-based vectors contained no shRNA or encoded either for a non-targeting shRNA (a hairpin insert that will generate siRNAs containing 5 base pair mismatch to any known human or mouse gene; SHC002) or for three different shRNAs specific for human E2F1: E2F1-A (TRCN0000039658), E2F1-B (TRCN0000039662), and E2F1-C (TRCN0000039660). Conditioned medium was harvested, cleared of debris by low-speed centrifugation, and filtered through 0.45-μm filters. For cell transduction, we incubated cells in the presence of medium containing viruses and protamine sulfate during 6h. Cells were washed and non-transduced cells were eliminated from the culture by incubating cell cultures with 2μg/ml puromycin for 96h, at least.
Immunoblotting and immunohistochemistry
Cell extracts were boiled in loading buffer, fractionated in 8% SDS-PAGE, and transferred to nitrocellulose membranes. Protein loading equivalence was verified by ponceau red (Sigma-Aldrich) staining. Anti-E2F1, anti-E2F2, anti-E2F3, or the anti-C-MYC 9E10 monoclonal antibody from Santa Cruz Biotechnology (Santa Cruz, CA), or anti-Tubulin from Sigma-Aldrich, followed by peroxidase-anti-mouse or –anti-rabbit antibodies (Sigma-Aldrich) were used to probe the membranes. Chemiluninescent detection reagent (Western Lightning Chemiluninescence Reagent Plus; PerkinElmer LAS, Inc.; Boston, MA) was used and the membrane exposed to X-Ray Medical film.
Paraffin-embedded tissue samples were stained with anti-E2F1 (Santa Cruz) or anti-Ki67 (DAKO, Copenhagen, Denmark) and counterstained with hematoxylin or simply stained with hematoxylin and eosin. The specimens were analyzed by microscopy, using an Olympus BX60 (Olympus Optical, Hamburg, Germany). Images were taken with an Olympus DP50 camera.
Cell growth, cell proliferation, and cell cycle analysis
To determine cell growth, cells were resuspended at a concentration of 2 × 10⁵/ml and placed in culture in 24-well plates by triplicate. Growth was measured by cell count at different intervals. Cell viability was assessed by trypan blue exclusion. Cell cycle analysis was performed as previously described (12). For cell proliferation assays, 5 × 10⁴ cells in 200μl of culture medium were added to each well of a 96-well flat-bottomed microtiter plate and cultured in triplicate. Cell proliferation was estimated by [3H]dThd (New England Nuclear, Boston, MA) incorporation during the last 16 h of culture. Cells were harvested and the radioactivity measured in a liquid scintillation counter.
Transformation assays in vitro and in vivo
Wells of a six-well plate (Falcon) were covered with 0.5% SeaPlaque agarose (FMC, Rockland, Maine) containing RPMI 1640 medium and 10% FCS. Onto this base, 104 cells in 0.3% SeaPlaque agarose containing RPMI 1640 medium and 10% FCS were embedded. Triplicate plates were scored for colonies 2-3 weeks after seeding. DG75, BL2, or Ramos cells (2 × 10⁶) in 0.1 ml of phosphate-buffered saline were injected into 6- to 8-week-old female C.B.-17 severe combined immunodeficiency (SCID) mice. Tumor masses were removed after 3 weeks, weighted and paraffin-embedded for immunohistochemistry. All animal procedures were approved by the Institution Review Board.
RESULTS
E2F1 expression is higher in BL cell lines than in immortalized, but non-transformed Lymphoblastoid B-cell lines
BL cell lines show a transformed phenotype in that they are able to grow in soft agar and to form tumors in immunodeficient mice. To initially investigate whether activator E2F genes might participate in sBL lymphomagenesis, we first compared their expression in BL cell lines relative to EBV-immortalized, but non-transformed, Lymphoblastoid B-cell lines (LCL). Northern blot analysis of E2F1, E2F2, and E2F3 expression in several BL and LCL cell lines indicated that E2F1 expression was detected in BL cell lines, but not in LCL cell lines; whereas E2F2, E2F3 and ACTIN expression (used as a loading control) were observed at similar levels in all cell lines (Fig. 1A). Using qPCR and immunoblotting to compare E2F1 expression in BL and LCL cell lines, E2F1 expression was found to be higher in BL cell lines than in the LCL cell line, Dana, whereas its expression was similar among the different LCL cell lines (Fig. 1B, 1C and 1D).
Figure 1. E2F1 expression is higher in BL than in LCL cell lines.
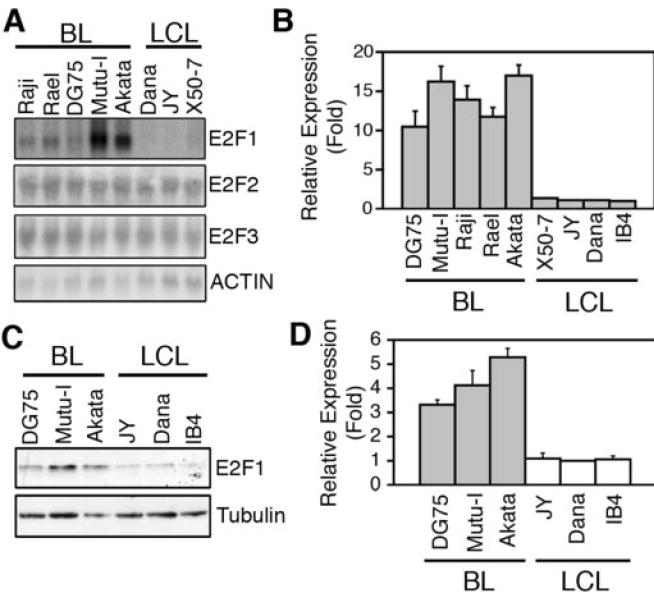
(A) Northern blot analysis of E2F1-E2F3, and ACTIN mRNA expression in the indicated cell lines. (B) qPCR analysis of E2F1 expression in the indicated cell lines. Expression is shown relative to that found in the LCL cell line Dana as the average ± SD (n=4). (C) A representative immunoblotting analysis of E2F1 and Tubulin protein expression in the indicated cell lines is shown. (D) The E2F1 signal was normalized by the Tubulin signal for each sample. The normalized expression of E2F1 (Average ± SD) in each cell line, relative to that in Dana, of four independent experiments is shown.
A correlation between expression of genes involved in cell proliferation and the growth rate of cells in culture has been previously reported (13). To assess whether the prominent expression levels of E2F1 in cultured BL cell lines is a consequence of a greater growth rate in these cultures than in those of LCL cell lines, we compared the growth characteristics of DG75 and Mutu-I BL cell lines with those of JY and X50-7 LCL cell lines. LCL cell lines are known to grow rapidly and continuously as a consequence of the expression of several EBV-encoded proteins (14). As shown in Supplementary Fig. S1A, the growth rates of these cell lines were almost identical. All cell cultures presented over 98% of viability, as determined by trypan blue exclusion. BrdU incorporation levels and cell cycle distribution of these cells were also determined and found to be indistinguishable (Supplementary Fig. S1B and S1C). Hence, the higher expression of E2F1 found in BL relative to LCL cell lines is not simply a consequence of different growth capacities.
E2F1 expression is deregulated in sBL tumor samples
We next used qPCR to compare E2F1 expression in biopsy specimens from sBL, MCL, SMZL, DLBCL, and FL patients with that in control tissues derived from reactive lymph nodes (LN1-LN3) and tonsils (T1, T2). Similar E2F1 expression was observed in all control tissues (Supplementary Fig. S2). In contrast, 100% of sBL samples (BL1 to BL30) expressed 5 to 45 times higher E2F1 levels than reactive tonsil T2 (Fig. 2A). E2F1 expression in MCL, SMZL, and FL specimens was very similar to that in control tissue T2 (0.5 to 2.5 fold) (Fig. 2B). Three DLBCL samples (DLBCL-3, -4 and -5) showed E2F1 levels similar to those in control sample T2 (1 to 1.9 fold), whereas E2F1 expression was 3-4 times higher in the other three DLBCL samples (DLBCL-1, -2, and -6) than in sample T2 (Fig. 2B and Table 1). Although E2F1 expression in samples DLBCL4 and DLBCL5 was very similar to that of control tissues, the proliferation index of these samples was as high as that of sBL specimens (over 95%), as indicated by Ki67 immunostaining (Table 1). E2F1 protein levels were also higher in sBL samples (sBL8) than in control tissues (T2) or a lymphoma sample with a similar proliferation index (DLBCL4), as determined by immunohistochemistry (Fig. 2C). Together, our results indicate that elevated E2F1 expression is observed in sBL cases. Moreover, in accordance with our results employing sBL and LCL cell lines, elevated E2F1 expression is not merely a marker of cell proliferation because other B-cell lymphomas with a high proliferation index expressed substantially lower E2F1 levels.
Figure 2. E2F1 expression is deregulated in sBL.
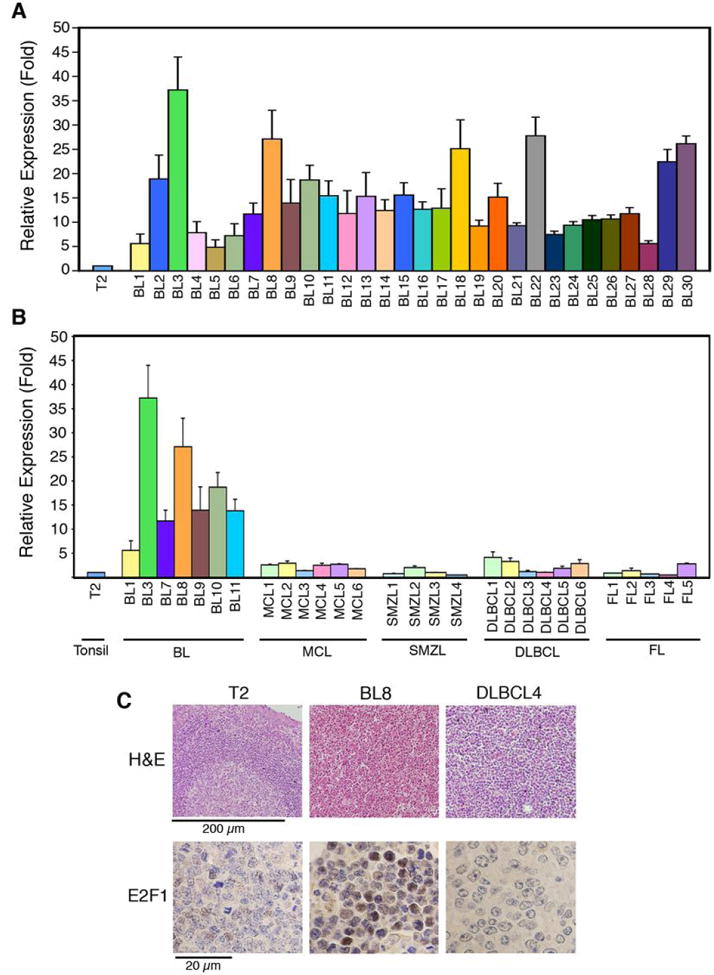
Relative E2F1 mRNA expression levels were determined by qPCR (A-B) and is shown as average ± SD (n ≥ 3). E2F1 expression levels in sBL samples BL1 to BL30 (A) and other B-cell lymphomas (B) are shown relative to sample T2. (C) H&E and E2F1 staining of sBL8, DLBCL4, and Control T2 samples. Scale bars are shown.
Table 1. DLBCL samples with high proliferation index show low E2F1 expression levels.
Tissue sections from the indicated samples were immunostained for Ki67. Percent of positive cells for this antigen is shown (Ki67). E2F1 expression was determined by qPCR and is shown (E2F1) relative to sample T2 as average ± SD (n=3).
| Sample | Ki67 | E2F1 |
|---|---|---|
| DLBCL1 | 100 | 4.14 ± 1.13 |
| DLBCL2 | 87 | 3.28 ± 0.71 |
| DLBCL3 | 82 | 1.17 ± 0.26 |
| DLBCL4 | 98 | 1.03 + 0.08 |
| DLBCL5 | 95 | 1.87 + 0.41 |
| DLBCL6 | 84 | 2.84 ± 0.83 |
Elevated E2F1 expression is required for sBL tumor formation
BL, but not LCL cell lines, form colonies in soft agar and produce malignant tumors in immunodeficient mice (15). Accordingly, we found that the BL cell line, DG75, derived from a sBL patient (16), but not the LCL cell line, JY, was able to grow and form colonies in soft agar (Supplementary Fig. S3A) and to produce tumors in immunodeficient SCID mice (Supplementary Fig. S3B). To assess whether elevated E2F1 expression is required for tumorigenicity of sBL, DG75 cells were infected with either a lentivirus encoding no shRNA (None), a non-targeting shRNA (Control), or three different shRNAs specific for E2F1 (E2F1-A to E2F1-C). E2F1 expression was determined in infected cells following puromycin selection. Interfering RNAs E2F1-A and E2F1-B reduced E2F1 expression to the greatest extent (over 70%), while shRNA E2F1-C moderately reduced E2F1 expression (~ 50%), and the control shRNA did not reduce E2F1 expression (Fig. 3A and 3B). None of these lentiviruses significantly affected the expression of E2F2, E2F3, c-myc, or Tubulin (Fig. 3A and Supplementary Fig. S4), suggesting that the effect of E2F1 shRNAs is specific for E2F1.
Figure 3. E2F1 expression is down-regulated by specific shRNAs.
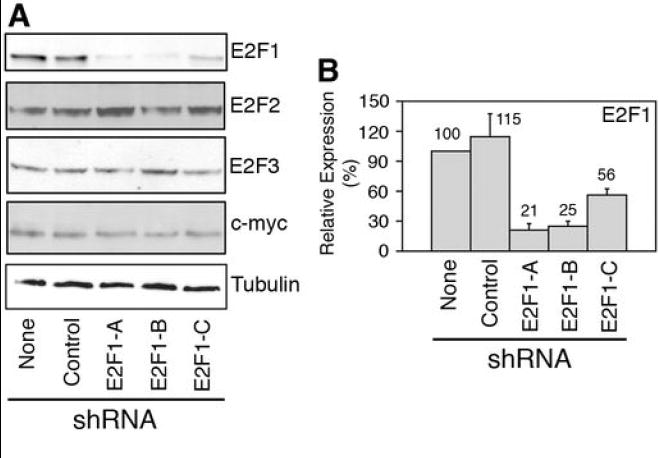
DG75 cells were transduced with lentiviruses bearing the indicated shRNAs. (A) Immunoblot staining of cell extracts with the indicated antibodies. (B) Average ± SD (n=4) of E2F1 expression normalized by the tubulin signal and relative to DG75 cells infected with the empty virus (None) is shown. Numbers above the columns indicate the average of E2F1 relative expression.
DG75 cells bearing no shRNA (None) or the Control shRNA efficiently formed colonies in soft agar, whereas cells transduced with shRNAs E2F1-A to E2F1-C displayed a reduced capacity to form colonies when compared with cells bearing no shRNA (Fig. 4A and 4B). To determine the role of enhanced E2F1 expression on the capacity of sBL cells to form tumors in vivo, we inoculated DG75 cells transduced with different lentiviruses into immunodeficient SCID mice. DG75 cells bearing no shRNA (None) or the control shRNA elicited tumor formation within 3 weeks in 9/9 SCID mice (Fig. 4C and Supplementary Fig. S5A). The tumors were solid masses (Supplementary Fig. S5B) consisting of tumor lymphoid cells that expressed high levels of E2F1 and Ki67 proteins (Supplementary Fig. S5C). In contrast, mice inoculated with DG75 cells bearing shRNA E2F1-A to E2F1-C either formed no tumors or formed very small tumors (Fig. 4C). Specific E2F1 expression knockdown in two additional sBL cell lines, BL2 and Ramos (Supplementary Fig. S6 and S7A), also prevented or greatly reduced tumor formation in mice (Fig. 4D and Supplementary Fig. S7B). These data indicate that reduction of E2F1 expression in three different sBL cell lines greatly inhibits their tumor formation capacity, thus pointing to E2F1 as a key player in sBL lymphomagenesis.
Figure 4. Elevated E2F1 expression is required for sBL growth in soft agar and tumor formation.
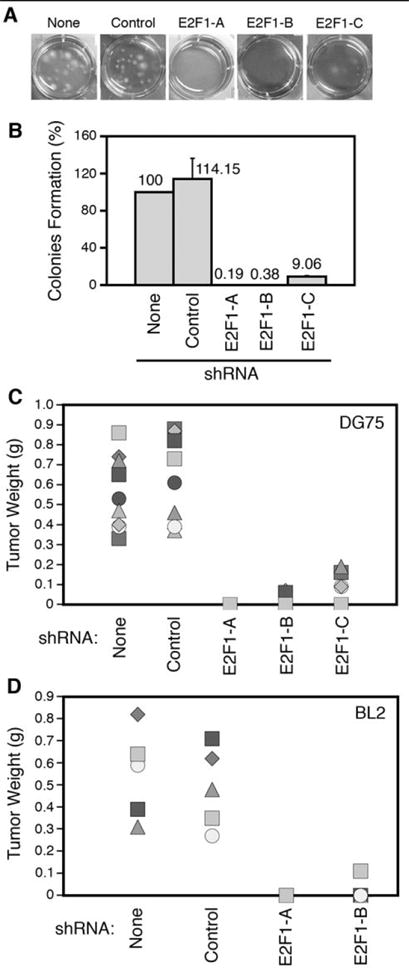
Pictures of representative wells (A) containing cells seeded in soft agar and colony formation quantization (B) of four independent experiments relative to cells infected with the empty vector (None) are shown. Numbers above each column indicate the average relative colony formation. (C and D) Weight of tumors extracted from mice subcutaneously inoculated with either DG75 (C) or BL2 (D) cells transduced with lentiviruses encoding for the indicated shRNAs (n=9 and n=5 for DG75 and BL2, respectively).
Down-regulation of E2F1 expression in sBL cells reduces their proliferation capacity and leads to their accumulation in G2/M
To investigate the mechanism involved in inhibition of tumor formation by reduced E2F1 expression, we compared the growth capacity of sBL cells with normal or reduced E2F1 expression levels. The number of DG75 cells bearing no shRNA (None) or a non-targeting shRNA (Control) increased 14-fold in a 4-day period, whereas the number of cells bearing shRNA E2F1-A or E2F1-B barely increased in the same period of time (Fig. 5A). Similarly, the growth capacity of two additional sBL cell lines, Ramos and BL2, was notably inhibited following reduction of E2F1 expression (Supplementary Fig. S8). The reduced growth capacity of these cells could be due to reduced proliferation or to increased cell death. Because all cell cultures presented over 98% viable cells, as determined by trypan blue exclusion, it is more likely that E2F1 knock-down in sBL cells inhibits their proliferation. Accordingly, DG75 cells bearing shRNA E2F1-A or E2F1-B incorporated less [3H]dThd than cells bearing no shRNA (None) or a non-targeting shRNA (Control) (Fig. 5B). Remarkably, the presence of shRNA E2F1-A or E2F1-B in human normal diploid fibroblasts (Imr-90) did not inhibit their proliferation rate (Fig. 5B), although these shRNA efficiently knocked-down E2F1 expression in these cells (Supplementary Fig. S9).
Figure 5. Reduction of E2F1 expression decreases cell growth in sBL cells.
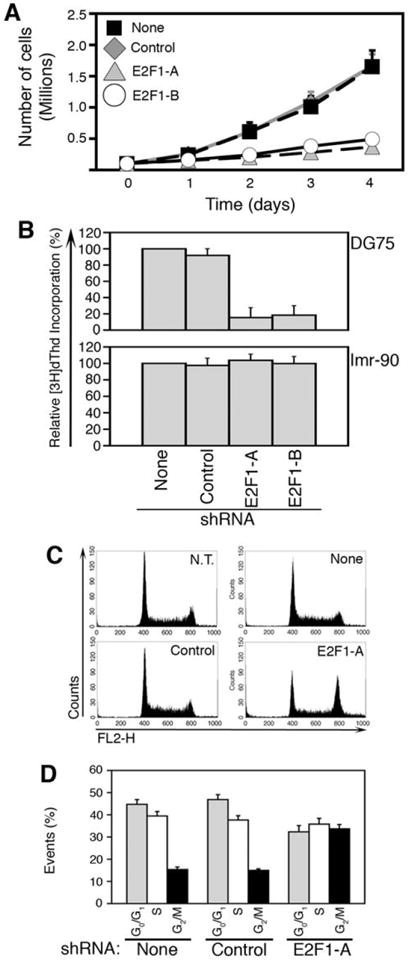
Growth curves (A) of DG75 and [3H]dThd incorporation (B) of DG75 and Imr-90 cells transduced with lentiviruses encoding for the indicated shRNAs relative to cells infected with the empty vector (None) are shown as the average ± SD (n=4). (C) Representative cell cycle profiles of non-transduced (N.T.) DG75 cells and cells transduced with lentiviruses encoding for the indicated shRNAs. (D) Average ± SD (n=4) of the percentage of each of these cells in G0/G1, S, and G2/M is shown.
It has been established that C-MYC over-expression in normal cells arrest them in the G2 phase of the cell cycle in the presence of serum (17) or induces apoptosis in its absence (18). Because E2F1 elicits the expression of genes involved in progression through G2 and M (19, 20), we hypothesized that elevated E2F1 expression might help B cells to overcome a C-MYC-induced arrest in G2. In such a scenario, reduction of E2F1 expression in sBL cells should lead to their accumulation in G2. As shown in figure 5C, cells bearing no shRNA (None) or a non-targeting shRNA (Control) presented a cell cycle distribution similar to that of non-transduced cells (N.T.), whereas sBL cells bearing shRNA E2F1-A accumulated in the G2/M phase of the cell cycle. Approximately 15% of the cells expressing no shRNA (None) or the Control shRNA were found in G2/M (Fig. 5D). In contrast, >35% of cells expressing reduced levels of E2F1 accumulated in G2/M (Fig. 5D). These data strongly suggest that E2F1 cooperates with c-myc in sBL formation by facilitating cell cycle progression.
DISCUSSION
Current therapies for sBL are based in highly aggressive short-term poly-chemotherapy treatments that include intrathecal chemotherapy (2). Unfortunately, the toxicities associated to these therapies can be too severe (3). A better understanding of sBL lymphomagenesis biology could allow identification of potential targets for intervention and thus would facilitate development of less toxic therapies. The EBV genome is incorporated into only 5-10% of adult sBL cases and it remains unclear whether its presence is required for tumor formation (21). Different alterations affecting p16INK4a, RB2/p130, the ARF-MDM2-p53 pathway, the p53-related p73 gene, BCL-6, or BAX have been found in different sBL patients, but the defects found in these genes or pathways are present in only small subsets of patients (21). In contrast, we have herein shown that E2F1 is highly expressed in biopsy specimens from 100% sBL patients. Furthermore, our data suggest that its elevated expression is required for sBL formation and that E2F1 might cooperate with c-myc in sBL formation.
A molecular signature able to distinguish sBL and DLBCL has been recently identified (22, 23). Notably, this signature did not include E2F1, suggesting that E2F1 deregulation may not be exclusive to sBL. In fact, we have found that some DLBCL tumor samples expressed E2F1 levels close to those found in some sBL specimens. Therefore, although E2F1 may not be employed as a molecular marker for distinguishing between BL and DLBCL, it might be used to discard a diagnosis of normal sporadic BL if low E2F1 expression levels are found in biopsy samples.
E2F1 over-expression has been found in diffuse large B-cell lymphomas, colon, prostate, bladder, lung, breast, thyroid, and pancreatic cancer (7, 8). The high levels of E2F1 expression that have been detected in some of these tumors correlate with high Ki67 expression (7, 8) and, in fact, E2F1 expression has been even proposed as a proliferation marker of breast cancer (24). However, none of the studies published so far clearly indicated a positive and active role of E2F1 over-expression in human tumor formation. Moreover, the role shown for E2F1 in several human tumors, such as diffuse large B-cell lymphomas, colon, lung, invasive bladder, and prostate carcinoma, rather was that of a tumor suppressor gene (25). Its capacity to inhibit tumor growth is likely associated to its capacity to elicit apoptosis (8). In this regard, E2F1 over-expression in breast and ovarian carcinoma induces apoptosis (26) and E2F1 has been shown to induce apoptosis in melanoma cells (27) and colon carcinomas (28).
The oncogenic role of activator E2F family members had been established in rodents, but there were no clear indications for an oncogenic role of these factors in humans. Together, our results show that an activator E2F family member, E2F1, might behave as an oncogene in humans playing a positive role in the formation of a human tumor, sBL. Since results from other groups suggest that E2F1 might behave as a tumor suppressor gene for other neoplasias, it appears that elevated E2F1 expression could exert opposing functions with respect to the regulation of tumor growth depending on the tumor type or the context. Whether E2F1 contributes to growth promotion or inhibition may depend on its expression levels and other factors such as, for instance, cell resistance to apoptosis. In this regard, it should be noted that most sBL cases show increased expression of TCL1, an oncoprotein that is involved in the AKT-mediated survival pathway (29).
The prominent expression levels of E2F1 in BL cell lines and tumor specimens could be seen as the consequence of the fact that sBL tumors and cell lines contain more cycling cells relative to other cell lines, to other tumors, or to normal tissues. However, our data suggest that its elevated expression is not merely a consequence of a higher proliferation rate of this tumor because i) BL and LCL cell lines proliferation rates and cell growth are indistinguishable; and ii) E2F1 expression levels in sBL biopsy specimens were much higher than in some DLBCL samples with a similar proliferation index. Instead, since reduction of E2F1 expression in sBL cells by specific shRNAs greatly inhibited tumor formation in mice, growth of colonies in soft agar, cell growth, and cell proliferation, our data rather indicate that its elevated expression is required for sBL formation. Regarding the mechanism leading to increased E2F1 expression in BL relative to other cell types, we have found recently that E2F1 promoter activity is higher in BL than in LCL cell lines (Molina-Privado, I. and Campanero, M.R., unpublished observations). Hence, it seems likely that different E2F1 transcription rates account for different E2F1 mRNA expression levels in different cell types.
As stated above, sBL cells express high C-MYC protein levels. However, C-MYC over-expression alone cannot sustain proliferation of normal cells but, instead, either arrest them in the G2 phase of the cell cycle in the presence of serum (17) or induces apoptosis in its absence (18). We have shown that reduction of E2F1 expression in sBL cells not only decreases proliferation but it also elicits accumulation of cells in the G2/M phase of the cell cycle. Hence, an elevated E2F1 expression might cooperate with C-MYC in sBL formation by helping cells that express elevated levels of c-myc to overcome the G2-arrest that C-MYC induces in normal cells. Although E2F1 capacity to elicit tumor formation was originally associated in mouse models to its involvement in the regulation of gene expression during the G1-S transition (6), our data suggest that E2F1 might be required for progression of sBL cells through G2/M. In this regard, more recent reports indicate that E2F1 regulates the expression in G2 of a number of genes that encode for centromeric proteins and other proteins known to function in centrosome duplication, spindle checkpoint, chromosome condensation and segregation, and cytokinesis (20, 30-32). Moreover, previous studies in Drosophila have provided evidence for a connection between E2F activity and the control of mitotic activities (33). In addition, B-MYB, a known E2F target during G1/S, regulates the expression of G2/M genes (34). It cannot therefore be ruled out that E2F1 might cooperate with C-MYC through the regulation of the expression of some of these genes.
Taking together, our data indicate that E2F1 expression is deregulated in BL cell lines and sBL tumor specimens, that its elevated expression in sBL cells is required for tumor formation, and that reduction of its expression in these cells decreases their growth rate and leads to their accumulation in G2/M. Knowing that E2f1-/- mice are viable until old age (35, 36), it is clear that E2F1 expression is not required for the proliferation of normal cells. Furthermore, specific ablation of E2F1 alone in patients would not be expected to cause immunosupression because E2F1 expression is dispensable for T cell proliferation in response to homeostatic signals or to stimulation in vivo (37). In addition, we have shown that E2F1 expression inhibition does not affect proliferation of human normal diploid fibroblasts. Therefore, our data suggest that E2F1 is a promising target for developing novel and less toxic treatments for sBL. In this regard, development of tools to transiently deliver siRNA specific for E2F1 into lymphoid tissues might help to treat sBL. Unfortunately, these tools are not yet widely available. Ongoing research on siRNA delivery into specific tissues together with our studies and additional research related to sBL lymphomagenesis biology would be of great help for the development of a less toxic sBL therapy in the coming future.
Acknowledgments
We thank D. Trono (Ecole Polytechnique Federale de Lausanne, Lausanne, Swisse) for psPAX2 and pMD2G-VSVG plasmids and M. Serrano, A. Muñoz, and T. Iglesias for critical reading of the manuscript. We are indebted to J.M. Redondo for his continuous support and to the CNIO Tumor Bank for kindly providing the cases included in this study. Our special thanks to CNIO’s Histology and Immunohistochemistry Unit and Molecular Cytogenetics Group for preparing histological slides and immunostains and for their excellent technical assistance with the FISH analyses, respectively.
MRC was supported by the Spanish Ministries of Education and Science (SAF04-05888 and SAF07-60647) and Health (G03-179). IMP was a recipient of a fellowship from the Spanish Ministry of Education and Science (AP-2004-3503). EKF was a recipient of a NIH grant (RO1 CA124311).
ABBREVIATIONS
- sBL
Sporadic Burkitt’s lymphoma
- BL
Burkitt’s lymphoma
- LCL
Lymphoblastoid B-cell lines
- qPCR
real-time quantitative RT-PCR
- MCL
Mantle Cell Lymphoma
- SMZL
Splenic Marginal Zone Lymphoma
- DLBCL
Diffuse Large B-Cell Lymphoma
- FL
Follicular Lymphoma
References
- 1.Shapira J, Peylan-Ramu N. Burkitt’s Lymphoma. Oral Oncology. 1998;34:15–23. doi: 10.1016/s1368-8375(97)00041-9. [DOI] [PubMed] [Google Scholar]
- 2.Yustein JT, Dang CV. Biology and treatment of Burkitt’s lymphoma. Curr Opin Hematol. 2007;14:375–81. doi: 10.1097/MOH.0b013e3281bccdee. [DOI] [PubMed] [Google Scholar]
- 3.Patte C, Auperin A, Gerrard M, et al. Results of the randomized international FAB/LMB96 trial for intermediate risk B-cell non-Hodgkin lymphoma in children and adolescents: it is possible to reduce treatment for the early responding patients. Blood. 2007;109:2773–80. doi: 10.1182/blood-2006-07-036673. [DOI] [PMC free article] [PubMed] [Google Scholar]
- 4.Hecht JL, Aster JC. Molecular biology of Burkitt’s lymphoma. J Clin Oncol. 2000;18:3707–21. doi: 10.1200/JCO.2000.18.21.3707. [DOI] [PubMed] [Google Scholar]
- 5.Hotchin NA, Allday MJ, Crawford DH. Deregulated c-myc expression in Epstein-Barr-virus-immortalized B-cells induces altered growth properties and surface phenotype but not tumorigenicity. Int J Cancer. 1990;45:566–71. doi: 10.1002/ijc.2910450332. [DOI] [PubMed] [Google Scholar]
- 6.Johnson DG, Schneider-Broussard R. Role of E2F in cell cycle control and cancer. Front Biosci. 1998;3:447–58. doi: 10.2741/a291. [DOI] [PubMed] [Google Scholar]
- 7.DeGregori J. The genetics of the E2F family of transcription factors: shared functions and unique roles. Biochim Biophys Acta. 2002;1602:131–50. doi: 10.1016/s0304-419x(02)00051-3. [DOI] [PubMed] [Google Scholar]
- 8.Tsantoulis PK, Gorgoulis VG. Involvement of E2F transcription factor family in cancer. Eur J Cancer. 2005;41:2403–14. doi: 10.1016/j.ejca.2005.08.005. [DOI] [PubMed] [Google Scholar]
- 9.Futterer A, Campanero MR, Leonardo E, et al. Dido gene expression alterations are implicated in the induction of hematological myeloid neoplasms. J Clin Invest. 2005;115:2351–62. doi: 10.1172/JCI24177. [DOI] [PMC free article] [PubMed] [Google Scholar]
- 10.Jaffe ES, Harris NL, Stein H, Vardiman JW. Pathology and genetics of tumours of haematopoietic and lymphoid tissues. Lyon, France: IARC Press; 2001. [Google Scholar]
- 11.Campanero MR, Flemington EK. Regulation of E2F through ubiquitin-proteasome-dependent degradation: stabilization by the pRB tumor suppressor protein. Proc Natl Acad Sci U S A. 1997;94:2221–6. doi: 10.1073/pnas.94.6.2221. [DOI] [PMC free article] [PubMed] [Google Scholar]
- 12.Campanero MR, Armstrong M, Flemington E. Distinct cellular factors regulate the c-myb promoter through its E2F element. Mol Cell Biol. 1999;19:8442–50. doi: 10.1128/mcb.19.12.8442. [DOI] [PMC free article] [PubMed] [Google Scholar]
- 13.Ross DT, Scherf U, Eisen MB, et al. Systematic variation in gene expression patterns in human cancer cell lines. Nat Genet. 2000;24:227–35. doi: 10.1038/73432. [DOI] [PubMed] [Google Scholar]
- 14.Thorley-Lawson DA, Allday MJ. The curious case of the tumour virus: 50 years of Burkitt’s lymphoma. Nat Rev Microbiol. 2008;6:913–24. doi: 10.1038/nrmicro2015. [DOI] [PubMed] [Google Scholar]
- 15.Nilsson K, Giovanella BC, Stehlin JS, Klein G. Tumorigenicity of human hematopoietic cell lines in athymic nude mice. Int J Cancer. 1977;19:337–44. doi: 10.1002/ijc.2910190309. [DOI] [PubMed] [Google Scholar]
- 16.Ben-Bassat H, Goldblum N, Mitrani S, et al. Establishment in continuous culture of a new type of lymphocyte from a “Burkitt like” malignant lymphoma (line D.G.-75) Int J Cancer. 1977;19:27–33. doi: 10.1002/ijc.2910190105. [DOI] [PubMed] [Google Scholar]
- 17.Felsher DW, Zetterberg A, Zhu J, Tlsty T, Bishop JM. Overexpression of MYC causes p53-dependent G2 arrest of normal fibroblasts. Proc Natl Acad Sci U S A. 2000;97:10544–8. doi: 10.1073/pnas.190327097. [DOI] [PMC free article] [PubMed] [Google Scholar]
- 18.Packham G, Cleveland JL. c-Myc and apoptosis. Biochim Biophys Acta. 1995;1242:11–28. doi: 10.1016/0304-419x(94)00015-t. [DOI] [PubMed] [Google Scholar]
- 19.Cam H, Dynlacht BD. Emerging roles for E2F: beyond the G1/S transition and DNA replication. Cancer Cell. 2003;3:311–6. doi: 10.1016/s1535-6108(03)00080-1. [DOI] [PubMed] [Google Scholar]
- 20.Seguin L, Liot C, Mzali R, et al. CUX1 and E2F1 regulate coordinated expression of the mitotic complex genes Ect2, MgcRacGAP and MKLP1 in S-phase. Mol Cell Biol. 2008 doi: 10.1128/MCB.01275-08. [DOI] [PMC free article] [PubMed] [Google Scholar]
- 21.Campanero MR. Mechanisms involved in Burkitt’s tumor formation. Clin Transl Oncol. 2008;10:250–5. doi: 10.1007/s12094-008-0193-x. [DOI] [PubMed] [Google Scholar]
- 22.Dave SS, Fu K, Wright GW, et al. Molecular diagnosis of Burkitt’s lymphoma. N Engl J Med. 2006;354:2431–42. doi: 10.1056/NEJMoa055759. [DOI] [PubMed] [Google Scholar]
- 23.Hummel M, Bentink S, Berger H, et al. A biologic definition of Burkitt’s lymphoma from transcriptional and genomic profiling. N Engl J Med. 2006;354:2419–30. doi: 10.1056/NEJMoa055351. [DOI] [PubMed] [Google Scholar]
- 24.Zhang SY, Liu SC, Al-Saleem LF, et al. E2F-1: a proliferative marker of breast neoplasia. Cancer Epidemiol Biomarkers Prev. 2000;9:395–401. [PubMed] [Google Scholar]
- 25.Zacharatos P, Kotsinas A, Evangelou K, et al. Distinct expression patterns of the transcription factor E2F-1 in relation to tumour growth parameters in common human carcinomas. J Pathol. 2004;203:744–53. doi: 10.1002/path.1582. [DOI] [PubMed] [Google Scholar]
- 26.Hunt KK, Deng J, Liu TJ, et al. Adenovirus-mediated overexpression of the transcription factor E2F-1 induces apoptosis in human breast and ovarian carcinoma cell lines and does not require p53. Cancer Res. 1997;57:4722–6. [PubMed] [Google Scholar]
- 27.Hao H, Dong Y, Bowling MT, Gomez-Gutierrez JG, Zhou HS, McMasters KM. E2F-1 induces melanoma cell apoptosis via PUMA up-regulation and Bax translocation. BMC Cancer. 2007;7:24. doi: 10.1186/1471-2407-7-24. [DOI] [PMC free article] [PubMed] [Google Scholar]
- 28.Bramis J, Zacharatos P, Papaconstantinou I, et al. E2F-1 transcription factor immunoexpression is inversely associated with tumor growth in colon adenocarcinomas. Anticancer Res. 2004;24:3041–7. [PubMed] [Google Scholar]
- 29.Teitell MA. The TCL1 family of oncoproteins: co-activators of transformation. Nat Rev Cancer. 2005;5:640–8. doi: 10.1038/nrc1672. [DOI] [PubMed] [Google Scholar]
- 30.Ishida S, Huang E, Zuzan H, et al. Role for E2F in control of both DNA replication and mitotic functions as revealed from DNA microarray analysis. Mol Cell Biol. 2001;21:4684–99. doi: 10.1128/MCB.21.14.4684-4699.2001. [DOI] [PMC free article] [PubMed] [Google Scholar]
- 31.Polager S, Kalma Y, Berkovich E, Ginsberg D. E2Fs up-regulate expression of genes involved in DNA replication, DNA repair and mitosis. Oncogene. 2002;21:437–46. doi: 10.1038/sj.onc.1205102. [DOI] [PubMed] [Google Scholar]
- 32.Ren B, Cam H, Takahashi Y, et al. E2F integrates cell cycle progression with DNA repair, replication, and G(2)/M checkpoints. Genes Dev. 2002;16:245–56. doi: 10.1101/gad.949802. [DOI] [PMC free article] [PubMed] [Google Scholar]
- 33.Neufeld TP, de la Cruz AF, Johnston LA, Edgar BA. Coordination of growth and cell division in the Drosophila wing. Cell. 1998;93:1183–93. doi: 10.1016/s0092-8674(00)81462-2. [DOI] [PubMed] [Google Scholar]
- 34.Zhu W, Giangrande PH, Nevins JR. E2Fs link the control of G1/S and G2/M transcription. Embo J. 2004;23:4615–26. doi: 10.1038/sj.emboj.7600459. [DOI] [PMC free article] [PubMed] [Google Scholar]
- 35.Field SJ, Tsai FY, Kuo F, et al. E2F-1 functions in mice to promote apoptosis and suppress proliferation. Cell. 1996;85:549–61. doi: 10.1016/s0092-8674(00)81255-6. [DOI] [PubMed] [Google Scholar]
- 36.Yamasaki L, Jacks T, Bronson R, Goillot E, Harlow E, Dyson NJ. Tumor induction and tissue atrophy in mice lacking E2F-1. Cell. 1996;85:537–48. doi: 10.1016/s0092-8674(00)81254-4. [DOI] [PubMed] [Google Scholar]
- 37.DeRyckere D, DeGregori J. E2F1 and E2F2 are differentially required for homeostasis-driven and antigen-induced T cell proliferation in vivo. J Immunol. 2005;175:647–55. doi: 10.4049/jimmunol.175.2.647. [DOI] [PubMed] [Google Scholar]